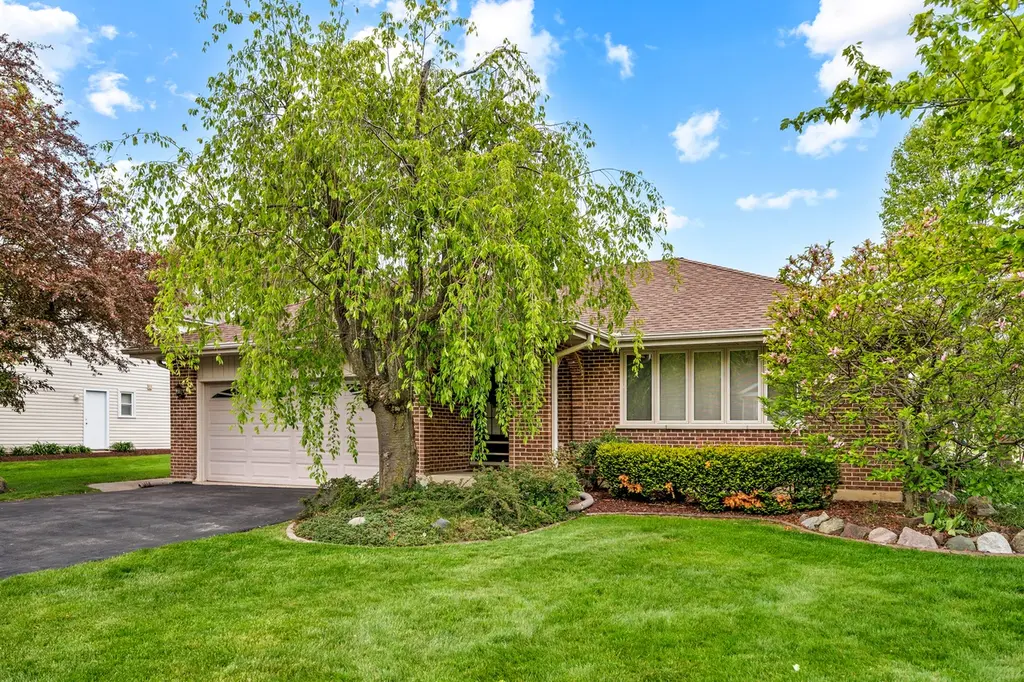
1281 Tracie Dr · Lake Zurich, IL
Flood risk 1/10 · Minimal
- FEMA flood zone
- X (unshaded)
- Chance of flooding over 30 yrs
- 0.0%
- Est. flood insurance / yr
- $473 – $860
Fire risk 3/10 · Minor
- Est. fire insurance / yr
- $804 – $1,492
Heat risk 2/10 · Minimal
- Hot days now (above 100°F)
- 7 days/yr
- Hot days in 30 yrs
- 14 days/yr
Wind risk 2/10 · Minimal
- Chance of severe wind over 30 yrs
- 0.0%
Air-quality risk 3/10 · Minor
- Unhealthy air days now
- 3 days/yr
- Unhealthy air days in 30 yrs
- 3 days/yr
Risk factors via First Street. Map © Google.
Why this score? — see what drove the F grade
The composite is a weighted blend of 9 inputs, each scored 0–100. Each bar is that input's sub-score; the figure is the points it added to the 100-point composite (weight × sub-score).
- ARV discount +10.1/15.0
- Cash flow +6.0/30.0
- Schools +4.6/10.0
- Livability +3.8/5.0
- Rent growth +2.5/5.0
- Condition / age +2.5/5.0
- 1% rule +1.4/10.0
- DSCR +0.4/10.0
- Appreciation +0.0/10.0
$569,000
🖨 Deal sheet 📄 Offer letter ✓ Due diligence
Listing remarks
This beautifully maintained ranch home in the desirable Quail Run subdivision sits on a premium lot backing and siding to an active nature preserve. Thoughtfully designed for both everyday living and entertaining, it offers an ideal blend of comfort and functionality. A welcoming foyer opens to a spacious living room with an oversized picture window, while the adjacent dining room captures peaceful views of the preserve. The bright kitchen is filled with natural light from a large skylight and features granite countertops, beautiful cabinetry with abundant storage, stainless steel appliances, and an extended peninsula with counter-height seating, plus table space. The kitchen flows seamless
Key facts
- Premium lot
- 0.24 acre lot
- 2 garage spots
Tags
Property features AI
Finance
- Other: School bus service available; Subdivision: Quail Run; Directions available (local routing provided)
- HOA & community: Master association fees not required
Exterior
- Parking: Attached garage (owned) with 2 garage spaces and garage door opener; Driveway parking; total parking for 4 vehicles; Asphalt surfaces
- Security: CO detectors installed
- Utilities: Public water; Public sewer; Standard electrical service (no specific details provided)
- Home design: Detached single-family home; 1.5-story design; Fee simple ownership; Estimated living area reported
- Construction: Built approximately 31–40 years ago; Aluminum siding and brick exterior; Asphalt roof; Concrete perimeter foundation
- Exterior features: Nature preserve adjacent; Partially finished basement with egress window, concrete and storage space; Separate dining room; Park, curbs, sidewalks, street lights, paved streets in the community
Interior
- Kitchen: Granite counters; Gas cooktop and gas oven; Range; Microwave; Dishwasher; Refrigerator; Stainless steel appliances
- Bedrooms: 3 bedrooms total; Master bedroom on second level (full bath); Bedroom 2 on second level (13 x 14) with curtains/drapes and carpet; Bedroom 3 on second level (11 x 11) with blinds and carpet; Additional bedroom listed (details not specified)
- Flooring: Hardwood in many main-level rooms and kitchen; Carpet in bedrooms, living and dining areas; Vinyl in laundry; Some other/unspecified flooring in basement rooms
- Bathrooms: 2 full bathrooms; 1 half bathroom; Features include separate shower, double sink, soaking tub
- Heating & cooling: Natural gas heating with forced air; Central air conditioning
- Interior features: Walk-in closets; Bookcases; Granite counters; Separate dining room; Skylights and window treatments (drapes/blinds)
- Laundry & utility: Main-level laundry (5 x 8) with curtains/drapes; Washer and dryer included; Gas dryer hookup
Neighborhood map
What this means for you Summary
Snapshot
- This is a 3-bed/2.5-bath single-family listed at $569k.
Deal economics
- At list price, monthly cash flow is $-1k ($-13k/yr) — negative.
- To cash-flow at today's rent, offer at most $379k (33.4% below list).
- To meet the 1% rule (rent ≥ 1% of price), the offer needs to be $362k (36.3% below list).
- Recommended offer: $362k (36.3% below list) — sets the bar for 1% rule.
Location & tenants
- Location reads 76/100 on livability (#175 in IL, #3,345 nationally) — a middle-class / working-renter tenant base. Strengths: crime A+, employment A+, housing A+; Watch: health & safety C-, amenities F, commute F.
- Lake Zurich CUSD 95 (suburban): math 47% / reading 47% proficiency, ranked #44 of 620 in IL (top 7%) — families likely to look elsewhere, expect single-tenant / working-renter base with shorter leases; only 10% free/reduced lunch — higher-income household profile.
- Zoned schools: Isaac Fox Elementary School (math 52% / reading 48%, grade D+, #176 of 2,056 statewide, top 9%, 525 students, 0% FRL); Lake Zurich Middle - S Campus (math 41% / reading 50%, grade D+, #89 of 665 statewide, top 14%, 599 students, 0% FRL); Lake Zurich High School (math 54% / reading 58%, grade C, #25 of 693 statewide, top 4%, 1,804 students, 0% FRL).
- Market conditions: 164 active listings in the ZIP; 3 comparable units currently listed for rent nearby; rentals leasing fast (median 2d on market — plan ~1-2 weeks tenant-placement turnaround); high-income renter base; 948 units permitted in Lake County in 2024 (424 in 5+ unit buildings).
Forward outlook
- Local home prices are declining (-3.0%/yr); year-one equity from $4k of loan paydown is wiped out by about $17k of value loss. Plan a longer hold.
- Lake County population projected to shrink 8% by 2050 — rents likely to lag national; underwrite the cash flow, not the appreciation.
Negotiation context
- It's been on market 35 days — a 3% lower offer ($552k) is reasonable based on typical stale-listing flexibility.
Questions for the listing agent
- What do current leases actually rent for vs. the listed asking? Can we see a recent rent roll and the last 12 months of T-12 income?
- It's been on market 35 days. Have you received any prior offers? Is the seller open to a 36% concession, seller financing, or rate buy-down credit?
- Is there a deadline driving the sale (1031 exchange, divorce, estate, relocation)? That informs how much negotiation room exists.
- Schools are B-rated — typically a magnet for longer-tenancy family renters. What's the average tenant stay here, and is there a school-zone premium baked into asking?
- The area grade is low — what's the realistic commute time and amenity access for the typical tenant pool here? Any planned neighborhood developments (good or bad) we should know about?
- What's the average days-on-market for RENTAL listings here right now (not sales)? A rising rental-DOM trend means longer vacancies and softer asking-rent achievability than the comps imply.
- What's the recent tenant-quality profile in this submarket — average credit score on applications, eviction rate, late-payment / NSF rate, and stable-employment percentage? A property-management company in the area should have these aggregated.
- How much new for-sale + rental construction is in the pipeline within 1–3 miles? Heavy new supply typically softens prices + rents 12–24 months out; constrained supply supports both.
Investment metrics
- 1% rule
- 0.64% ✗
- Cap rate
- 4.02%
- Cash-on-cash
- -8.10%
- DSCR
- 0.64
- GRM
- 13.1
CMA / ARV
- ARV (median comp)
- $604,262
- List price
- $569,000
- Delta
- -5.84%
- Verdict
- FAIR
- Comps
- 20 within 1.0 mi
Show comp detail 12 sales within ~0.75 mi
| Address | Dist | Beds/Ba | Sqft | Sold | Price | $/sf | Match |
|---|---|---|---|---|---|---|---|
| 1201 Tracie Dr | 0.18mi | 3/2.5 | 2,073 (0%) | 5mo | $575,000 | $277 | 88 |
| 1202 Tracie Dr | 0.21mi | 3/2.5 | 2,073 (0%) | 7mo | $514,900 | $248 | 84 |
| 282 Waterford Dr | 0.12mi | 4/2.5 (+1) | 2,162 (+4%) | 2mo | $677,000 | $313 | 80 |
| 21570 N Inglenook Ln | 0.19mi | 4/3.0 (+1) | 2,150 (+4%) | 10mo | $633,000 | $294 | 70 |
| 552 Garland Ct | 0.61mi | 3/2.5 | 2,096 (+1%) | 9mo | $480,000 | $229 | 62 |
| 555 Waterford Dr | 0.41mi | 4/2.5 (+1) | 2,208 (+6%) | 7mo | $605,000 | $274 | 59 |
| 23400 W Cattail Ln | 0.73mi | 4/2.5 (+1) | 2,023 (-2%) | 1mo | $680,000 | $336 | 56 |
| 551 Shaker Ln | 0.56mi | 4/2.5 (+1) | 1,912 (-8%) | 1mo | $577,000 | $302 | 55 |
| 1135 Lexington Ln | 0.51mi | 4/2.0 (+1) | 2,150 (+4%) | 11mo | $442,000 | $206 | 54 |
| 162 Washo Ct | 0.24mi | 4/2.5 (+1) | 2,351 (+13%) | 9mo | $575,000 | $245 | 54 |
| 1119 Berkshire Ln | 0.62mi | 4/2.5 (+1) | 2,252 (+9%) | 0mo | $615,000 | $273 | 51 |
| 695 Trailside Dr | 0.74mi | 4/2.5 (+1) | 1,863 (-10%) | 3mo | $525,000 | $282 | 41 |
Match score weights: distance 35% · size 25% · config 20% · recency 20%. Top-matched comps best support the ARV.
Projected returns pro-forma
-3.0% appreciation · 3.0% rent growth · sell at horizon
- IRR
- -30.5%
- Equity multiple
- -0.01×
- Total profit
- $-160,669
- Equity at exit
- $84,840
- IRR
- -32.7%
- Equity multiple
- -0.43×
- Total profit
- $-227,906
- Equity at exit
- $49,197
Cash invested: $159,320 (down + closing). Projections, not guarantees.
Landlord ↔ Tenant lean methodology
- Overall (STATE)
- 43 Moderately Tenant-Leaning
- State Illinois
- 43 Moderately Tenant-Leaning · D+7
- County
- — inherits STATE
- City
- — inherits STATE
ZIP-level market 60047
- Active inventory
- 164
- Price-to-rent
- 13.1×
Monthly cashflow live
- Estimated rent
- $3,624 medium interval (Pro) →
- Mortgage (P&I)
- −$2,984
- Tax from tax record
- −$718 /mo · $8,610/yr
- Insurance
- −$237
- HOA
- −$0
- Vacancy / Maint / Mgmt
- −$761
- Net cashflow
- $-1,076
Break-even live
UW: 25.0% down · 7.5% · 30yr · 1.5% tax · 5.0% vac · 8.0% maint · 8.0% mgmt
Financing live
Cash to close
- Down payment
- $142,250
- Closing costs
- $17,070
- Reserves months
- —
- Total cash needed
- —
Loan-product check · same deal, 3 products live
Conventional
25% down · 7.5% · 30yr
- Down + closing
- —
- Monthly P&I
- —
- Monthly cashflow
- —
- DSCR
- —
- Eligible?
- —
Personal DTI + credit; lowest rate.
DSCR
20% down · 8.5% · 30yr
- Down + closing
- —
- Monthly P&I
- —
- Monthly cashflow
- —
- DSCR
- —
- Eligible?
- —
No personal income docs; deal must DSCR.
Hard money
10% down · 12.0% · 12mo
- Down + closing
- —
- Monthly P&I
- —
- Monthly cashflow
- —
- DSCR
- —
- Eligible?
- —
Short-term bridge; refi at stabilization.
Rent comps 3 comps
| Address | Beds | Baths | Sqft | Rent | $/sqft | DOM | Units | Dist |
|---|---|---|---|---|---|---|---|---|
| 121 Rosehall Dr Lake Zurich, IL | 3.0 | 3.0 | 2000 | $3,600 | $1.80 | 44d | 1 | 0.75mi |
| 250 Rosehall Dr #260 Lake Zurich, IL | 2.0 | 2.0 | 1489 | $2,700 | $1.81 | 1d | 1 | 0.83mi |
| 375 Pebble Creek Dr Lake Zurich, IL | 3.0 | 1.5 | 1550 | $4,995 | $3.22 | 1d | 1 | 1.34mi |
Listing history 14 events
-
2026-06-18days on market $569,000 Active 35 DOM
-
2026-06-17days on market $569,000 Active 34 DOM
-
2026-06-16days on market $569,000 Active 33 DOM
-
2026-06-15days on market $569,000 Active 32 DOM
-
2026-06-13days on market $569,000 Active 30 DOM
-
2026-06-09days on market $569,000 Active 26 DOM
-
2026-06-08days on market $569,000 Active 25 DOM
-
2026-06-07days on market $569,000 Active 24 DOM
-
2026-06-04pricedays on market $569,000 Active 21 DOM
-
2026-06-03days on market $585,000 Active 20 DOM
-
2026-06-02days on market $585,000 Active 19 DOM
-
2026-06-01days on market $585,000 Active 18 DOM
-
2026-05-31days on market $585,000 Active 17 DOM
-
2026-05-14$585,000 Active 1961-char remark
ⓘ Source: listings_history table (triggers on properties + properties_extension) + one-shot
backfill from property_details.listing_events for pre-trigger history.
Tax reassessment forecast IL · Partial reset (capped growth)
- Current annual tax
- $8,610 · $718/mo
- Projected year-2 tax
- $10,763 · $897/mo
- Expected delta
- +$2,153/yr (+$179/mo · 25.0%)
ⓘ Screening estimate from a state-policy table — verify with the county assessor before closing.
Climate risk First Street
- Flood 1/10 Low FEMA zone X (unshaded) · 0% chance over 30 yrs
- Wildfire 3/10 Moderate
- Heat 2/10 Low 7 d/yr ≥100°F today · 14 d/yr by 30 yrs out
- Wind 2/10 Low 0% chance of damaging wind over 30 yrs
- Air quality 3/10 Moderate 3 unhealthy d/yr today · 3 by 30 yrs out
Nearby sold comps map
Loading sold comps map…
Walkable amenities ~0.75 mi
Loading nearby amenities…
Taxation est. · year 1
- Rental income
- $43,483
- − Mortgage interest
- −$31,873
- − Property taxes
- −$8,610
- − Insurance
- −$2,845
- − Repairs & maintenance
- −$3,479
- − Management
- −$3,479
- − Depreciation
- −$16,553
- Taxable loss
- −$23,356
- Est. tax savings @ 24.0%
- +$5,605
- After-tax cash flow
- $-7,306/yr
For passive investors: Depreciation is non-cash, so a rental often shows a tax loss while cash-flowing — sheltering income. Rental losses are passive: they offset passive income freely, and up to $25,000/yr can offset ordinary (W-2) income if you actively participate and your MAGI is under $100k (phasing out to $0 by $150k); unused losses carry forward. On sale, claimed depreciation is recaptured at up to 25%, and gains may owe capital-gains tax (a 1031 exchange can defer both). Figures are a year-1 estimate at your 24.0% rate — not tax advice; consult a CPA.
Schools (NCES district)
- District
- Lake Zurich CUSD 95
- NCES district ID
- 1721900
- Math proficiency
- 47% ▼ -5.00%
- Reading proficiency
- 47% ▼ -7.00%
- Median HH income
- $114,452
- Composite
- 46.47/100
- National rank
- #2437
- State rank
- #44 of 620 in IL
Livability — Lake Zurich
- Score
- 76/100
- State rank
- #175
- US rank
- #3345
Category grades
Schools grade is shown separately in the Schools card above.
Census & demographics
- Census place
- Lake Zurich, IL
- County
- Lake County · 591,991 people
- Metro
- Chicago-Naperville-Elgin, IL-IN-WI
- Population (ZIP)
- 44,240
- Household income
- $176,081
- Rent vs Own
- Severe rent burden
- 377.0
Population outlook (Lake County) Hauer SSP2
- Today (2025)
- 700,217 people
- By 2030
- 693,290 · -1.0%
- By 2040
- 673,588 · -3.8%
- By 2050
- 643,556 · -8.1%
- By 2075
- 562,792 · -19.6%
- By 2100
- 457,715 · -34.6%
Race, ethnicity, and origin ACS 2023
- Neighborhood character
- Predominantly White (78%)
- Race & ethnicity
- White 78% Asian 12% Two or more races 6% Hispanic / Latino 6%
- Hispanic origin (detail)
- Mexican 3%
- Common ancestry
- Romanian 11% Scotch-Irish 3% Portuguese 2%
- Foreign-born
- 18% · Canada, China, South Korea
- Languages at home
- 76% English-only · Russian/Polish/Slavic 8% Spanish 5% Other Indo-European 4%
Political lean MEDSL · Lake
- 2024 margin
- Strong D (+20.8) · D 59.7% · R 38.9% · Other 1.4%
- 2008→2024 swing
- +1.1pp toward D · 2008: 19.6pp · 2024: 20.8pp
- All cycles
- 2024: D+20.8 2020: D+24.1 2016: D+20.3 2012: D+8.1 2008: D+19.6
Not yet ingested
- Civics
- —
Market trends
- HPI YoY
- ▼ -228.82%
- Current HPI
- 204.4326
- Rent YoY
- —
- Metro
- Chicago-Naperville-Elgin, IL-IN-WI
- State GDP YoY
- ▲ 1.59%
- F500 in state
- 60
Industry mix (Fortune 500 HQ in IL)
| Industry | F500 HQs | Revenue |
|---|---|---|
| Insurance | 4 | $201B |
|
||
| Consumer Goods | 4 | $87B |
|
||
| Industrial Machinery | 3 | $64B |
|
||
| Healthcare | 2 | $55B |
|
||
| Retail / Pharmacy | 1 | $148B |
|
||
| Agriculture / Food | 1 | $86B |
|
||
Price history
-2.7% since first listed2 events — show timeline
- 2026-06-04 Price Changed $569,000 MRED as Distributed by MLS Grid
- 2026-05-14 Listed $585,000 MRED as Distributed by MLS Grid
Property tax history
+1.8%/yrLatest (2024): $8,610 · +0.2% YoY. Source: county tax records.
Cash-flow waterfall
monthlySold comps — $/sqft
last 12 mo · ≤1 miLoading sold comps…