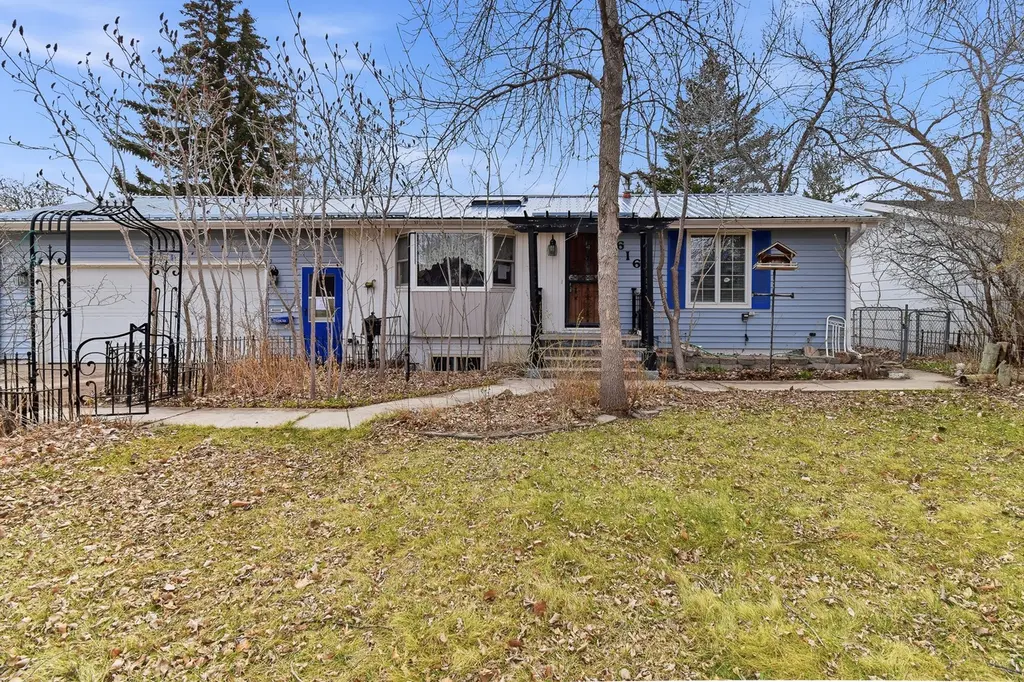
616 27th Ave NE · Great Falls, MT
Flood risk 1/10 · Minimal
- FEMA flood zone
- X (unshaded)
- Chance of flooding over 30 yrs
- 0.0%
- Est. flood insurance / yr
- $473 – $860
Fire risk 4/10 · Minor
- Est. fire insurance / yr
- $918 – $1,706
Heat risk 2/10 · Minimal
- Hot days now (above 92°F)
- 7 days/yr
- Hot days in 30 yrs
- 14 days/yr
Wind risk 1/10 · Minimal
- Chance of severe wind over 30 yrs
- —
Air-quality risk 5/10 · Moderate
- Unhealthy air days now
- 8 days/yr
- Unhealthy air days in 30 yrs
- 9 days/yr
Risk factors via First Street. Map © Google.
Why this score? — see what drove the D grade
The composite is a weighted blend of 9 inputs, each scored 0–100. Each bar is that input's sub-score; the figure is the points it added to the 100-point composite (weight × sub-score).
- ARV discount +15.0/15.0
- Cash flow +11.5/30.0
- Livability +3.9/5.0
- DSCR +3.4/10.0
- 1% rule +3.3/10.0
- Schools +2.8/10.0
- Rent growth +2.5/5.0
- Condition / age +2.5/5.0
- Appreciation +0.0/10.0
$225,000
🖨 Deal sheet (PDF) 📄 Offer letter ✓ Due diligence
Key facts
- Built-in cabinetry
- Charming gazebo
- Peaceful pond
Tags
Property features AI
Exterior
- Parking: Attached 2-car garage
- Home design: Single-family residence; Residential property
- Construction: Finished below-grade area (816); Foundation: see remarks
- Exterior features: Enclosed patio/porch; Lot approximately 8,146 sq ft (0.187 acre)
Interior
- Kitchen: Dishwasher; Microwave; Range; Refrigerator
- Bathrooms: 1 full bathroom; 1 three-quarter bathroom
- Interior features: Finished basement; Enclosed patio/porch
Neighborhood map
What this means for you Summary
Snapshot
- This is a 2-bed/2.0-bath single-family listed at $225k.
Deal economics
- At list price, monthly cash flow is $-76 ($-911/yr) — negative.
- To cash-flow at today's rent, offer at most $214k (4.9% below list).
- To meet the 1% rule (rent ≥ 1% of price), the offer needs to be $187k (16.8% below list).
- Recommended offer: $187k (16.8% below list) — sets the bar for 1% rule.
- Cap rate 5.9% vs local median 3.5% in Great Falls — top-decile yield for the area; either an underpriced asset or a hidden risk that comps aren't pricing in. Stress-test before assuming the spread holds.
Location & tenants
- Location reads 78/100 on livability (#19 in MT, #2,473 nationally) — a middle-class / working-renter tenant base. Strengths: amenities A+, cost of living A+, housing A+; Watch: employment C-, crime F.
- Great Falls H S (urban): math 27% / reading 39% proficiency, ranked #79 of 116 in MT (top 68%) — families likely to look elsewhere, expect single-tenant / working-renter base with shorter leases.
- Zoned schools: Sacajawea School (math 42% / reading 55%, grade D, #99 of 293 statewide, top 34%, 407 students, 0% FRL); North Middle School (math 43% / reading 55%, grade C-, #34 of 146 statewide, top 24%, 724 students, 0% FRL); C M Russell High School (math 32% / reading 43%, grade F, #47 of 132 statewide, top 35%, 1,454 students, 0% FRL).
- Zoned-school proficiency averages 45% at this address vs 33% district-wide (+12 pts) — the actual schools serving this property are materially stronger than the Great Falls H S average implies; a family-tenant draw the district grade alone would hide.
- Market conditions: 131 active listings in the ZIP; solid renter incomes; 223 units permitted in Cascade County in 2024 (37 in 5+ unit buildings).
Forward outlook
- Local home prices are declining (-3.0%/yr); year-one equity from $2k of loan paydown is wiped out by about $7k of value loss. Plan a longer hold.
- Cascade County population projected to shrink 5% by 2050 — rents likely to lag national; underwrite the cash flow, not the appreciation.
Negotiation context
- It's been on market 37 days — a 3% lower offer ($218k) is reasonable based on typical stale-listing flexibility.
Questions for the listing agent
- What do current leases actually rent for vs. the listed asking? Can we see a recent rent roll and the last 12 months of T-12 income?
- It's been on market 37 days. Have you received any prior offers? Is the seller open to a 17% concession, seller financing, or rate buy-down credit?
- Built in 1963 — when were the roof, HVAC, electrical panel, plumbing, and water heater last replaced?
- Is there a deadline driving the sale (1031 exchange, divorce, estate, relocation)? That informs how much negotiation room exists.
- Crime grade is F in this area — have there been break-ins, vandalism, or insurance claims at this property in the last 3 years? What carrier currently insures it and at what premium?
- The area grade is low — what's the realistic commute time and amenity access for the typical tenant pool here? Any planned neighborhood developments (good or bad) we should know about?
- What's the average days-on-market for RENTAL listings here right now (not sales)? A rising rental-DOM trend means longer vacancies and softer asking-rent achievability than the comps imply.
- What's the recent tenant-quality profile in this submarket — average credit score on applications, eviction rate, late-payment / NSF rate, and stable-employment percentage? A property-management company in the area should have these aggregated.
- How much new for-sale + rental construction is in the pipeline within 1–3 miles? Heavy new supply typically softens prices + rents 12–24 months out; constrained supply supports both.
Investment metrics
- 1% rule
- 0.83% ✗
- Cap rate
- 5.89%
- Cash-on-cash
- -1.45%
- DSCR
- 0.94
- GRM
- 10.0
CMA / ARV
- ARV (on-the-fly)
- $326,400
- Comps found
- 12
Show comp detail 12 sales within ~0.75 mi
| Address | Dist | Beds/Ba | Sqft | Sold | Price | $/sf | Match |
|---|---|---|---|---|---|---|---|
| 500 25th Ave NE | 0.22mi | 3/2.0 (+1) | 1,632 (0%) | 4mo | $327,000 | $200 | 81 |
| 432 23rd Ave NE | 0.31mi | 3/3.0 (+1) | 1,632 (0%) | 3mo | $337,000 | $206 | 74 |
| 517 27th Ave NE | 0.14mi | 3/2.0 (+1) | 1,696 (+4%) | 10mo | $299,500 | $177 | 74 |
| 500 24th Ave NE | 0.25mi | 2/2.0 | 1,632 (0%) | 18mo | $262,900 | $161 | 74 |
| 212 Riverview 2 E | 0.45mi | 3/2.0 (+1) | 1,632 (0%) | 1mo | $349,000 | $214 | 73 |
| 408 23rd Ave NE | 0.36mi | 3/2.0 (+1) | 1,680 (+3%) | 10mo | $320,000 | $190 | 65 |
| 3405 5th St NE | 0.52mi | 3/2.0 (+1) | 1,574 (-4%) | 3mo | $380,000 | $241 | 62 |
| 210 Riverview 3 E | 0.50mi | 3/2.0 (+1) | 1,632 (0%) | 12mo | $349,900 | $214 | 61 |
| 2405 4th St NE | 0.32mi | 3/3.0 (+1) | 1,728 (+6%) | 9mo | $350,000 | $203 | 58 |
| 632 33rd Ave NE | 0.39mi | 3/2.0 (+1) | 1,824 (+12%) | 13mo | $334,000 | $183 | 47 |
| 743 33b Ave NE | 0.53mi | 3/3.0 (+1) | 1,820 (+12%) | 7mo | $339,777 | $187 | 41 |
| 136 Riverview B | 0.68mi | 3/2.0 (+1) | 1,800 (+10%) | 7mo | $265,000 | $147 | 40 |
Match score weights: distance 35% · size 25% · config 20% · recency 20%. Top-matched comps best support the ARV.
Projected returns pro-forma
-3.0% appreciation · 3.0% rent growth · sell at horizon
- IRR
- -18.7%
- Equity multiple
- 0.34×
- Total profit
- $-41,269
- Equity at exit
- $33,548
- IRR
- -11.1%
- Equity multiple
- 0.33×
- Total profit
- $-42,050
- Equity at exit
- $19,454
Cash invested: $63,000 (down + closing). Projections, not guarantees.
Landlord ↔ Tenant lean methodology
- Overall (STATE)
- 82 Strongly Landlord-Friendly
- State Montana
- 82 Strongly Landlord-Friendly · R+11
- County
- — inherits STATE
- City
- — inherits STATE
ZIP-level market 59404
- Active inventory
- 131
- Price-to-rent
- 10.0×
Monthly cashflow live
- Estimated rent
- $1,872 medium interval (Pro) →
- Mortgage (P&I)
- −$1,180
- Tax est. 1.5%
- −$281 /mo · $3,375/yr
- Insurance
- −$94
- HOA
- −$0
- Vacancy / Maint / Mgmt
- −$393
- Net cashflow
- $-76
Break-even live
Sensitivity live
| Price | -10% $80 | -5% $2 | +0% $-76 | +5% $-154 | +10% $-231 |
|---|---|---|---|---|---|
| Rent | -10% $-224 | -5% $-150 | +0% $-76 | +5% $-2 | +10% $72 |
| Rate | -1.0pp $37 | -0.5pp $-19 | base $-76 | +0.5pp $-134 | +1.0pp $-194 |
UW: 25.0% down · 7.5% · 30yr · 1.5% tax · 5.0% vac · 8.0% maint · 8.0% mgmt
Financing live
Cash to close
- Down payment
- $56,250
- Closing costs
- $6,750
- Reserves months
- —
- Total cash needed
- —
Loan-product check · same deal, 3 products live
Conventional
25% down · 7.5% · 30yr
- Down + closing
- —
- Monthly P&I
- —
- Monthly cashflow
- —
- DSCR
- —
- Eligible?
- —
Personal DTI + credit; lowest rate.
DSCR
20% down · 8.5% · 30yr
- Down + closing
- —
- Monthly P&I
- —
- Monthly cashflow
- —
- DSCR
- —
- Eligible?
- —
No personal income docs; deal must DSCR.
Hard money
10% down · 12.0% · 12mo
- Down + closing
- —
- Monthly P&I
- —
- Monthly cashflow
- —
- DSCR
- —
- Eligible?
- —
Short-term bridge; refi at stabilization.
Listing history 4 events
-
2026-05-08status Pending
-
2026-04-28price $225,000
-
2026-04-16price $255,000
-
2026-03-31$270,000 Active
ⓘ Source: listings_history table (triggers on properties + properties_extension) + one-shot
backfill from property_details.listing_events for pre-trigger history.
Climate risk First Street
- Flood 1/10 Low FEMA zone X (unshaded) · 0% chance over 30 yrs
- Wildfire 4/10 Moderate
- Heat 2/10 Low 7 d/yr ≥92°F today · 14 d/yr by 30 yrs out
- Wind 1/10 Low
- Air quality 5/10 Major 8 unhealthy d/yr today · 9 by 30 yrs out
Nearby sold comps map
Loading sold comps map…
Walkable amenities ~0.75 mi
Loading nearby amenities…
Taxation est. · year 1
- Rental income
- $22,465
- − Mortgage interest
- −$12,603
- − Property taxes
- −$3,375
- − Insurance
- −$1,125
- − Repairs & maintenance
- −$1,797
- − Management
- −$1,797
- − Depreciation
- −$6,545
- Taxable loss
- −$4,778
- Est. tax savings @ 24.0%
- +$1,147
- After-tax cash flow
- $235/yr
For passive investors: Depreciation is non-cash, so a rental often shows a tax loss while cash-flowing — sheltering income. Rental losses are passive: they offset passive income freely, and up to $25,000/yr can offset ordinary (W-2) income if you actively participate and your MAGI is under $100k (phasing out to $0 by $150k); unused losses carry forward. On sale, claimed depreciation is recaptured at up to 25%, and gains may owe capital-gains tax (a 1031 exchange can defer both). Figures are a year-1 estimate at your 24.0% rate — not tax advice; consult a CPA.
Schools (NCES district)
- District
- Great Falls H S
- NCES district ID
- 3013050
- Math proficiency
- 27% ▼ -6.00%
- Reading proficiency
- 39% ▼ -3.00%
- Median HH income
- $43,586
- Composite
- 28.03/100
- National rank
- #6846
- State rank
- #79 of 116 in MT
Livability — Great Falls
- Score
- 78/100
- State rank
- #19
- US rank
- #2473
Category grades
Schools grade is shown separately in the Schools card above.
Census & demographics
- Census place
- Great Falls, MT
- County
- Cascade County · 75,427 people
- City population
- 75,427
- Metro
- Great Falls, MT
- Population (ZIP)
- 28,822
- Household income
- $83,867
- Rent vs Own
- Severe rent burden
- 280.0
Population outlook (Cascade County) Hauer SSP2
- Today (2025)
- 81,936 people
- By 2030
- 81,376 · -0.7%
- By 2040
- 79,435 · -3.1%
- By 2050
- 77,906 · -4.9%
- By 2075
- 78,595 · -4.1%
- By 2100
- 79,997 · -2.4%
Race, ethnicity, and origin ACS 2023
- Neighborhood character
- Predominantly White (87%)
- Race & ethnicity
- White 87% Two or more races 5% Hispanic / Latino 3% Native American 2% Asian 1% Black 1%
- Common ancestry
- Portuguese 8% Slovak 3% Lithuanian 3%
- Foreign-born
- 2% · Canada
- Languages at home
- 97% English-only · German/W. Germanic 1% Spanish 1%
Political lean MEDSL · Cascade
- 2024 margin
- Strong R (+22.3) · D 37.3% · R 59.6% · Other 3.0%
- 2008→2024 swing
- -24.6pp toward R · 2008: 2.3pp · 2024: -22.3pp
- All cycles
- 2024: R+22.3 2020: R+19.7 2016: R+21.6 2012: R+9.1 2008: D+2.3
Not yet ingested
- Civics
- —
Market trends
- HPI YoY
- ▼ -126.73%
- Current HPI
- 208.7527
- Rent YoY
- —
- Metro
- Great Falls, MT
- State GDP YoY
- ▲ 3.41%
- F500 in state
- 2
Industry mix (Fortune 500 HQ in MT)
| Industry | F500 HQs | Revenue |
|---|---|---|
| Technology / Analytics | 1 | $2B |
|
||
Price history
-16.7% since first listed4 events — show timeline
- 2026-05-08 Pending — MRMLS
- 2026-04-28 Price Changed $225,000 MRMLS
- 2026-04-16 Price Changed $255,000 MRMLS
- 2026-03-31 Listed $270,000 MRMLS
Property tax history
+2.2%/yrLatest (2025): $242 · +7.9% YoY. Source: county tax records.
Cash-flow waterfall
monthlySold comps — $/sqft
last 12 mo · ≤1 miLoading sold comps…