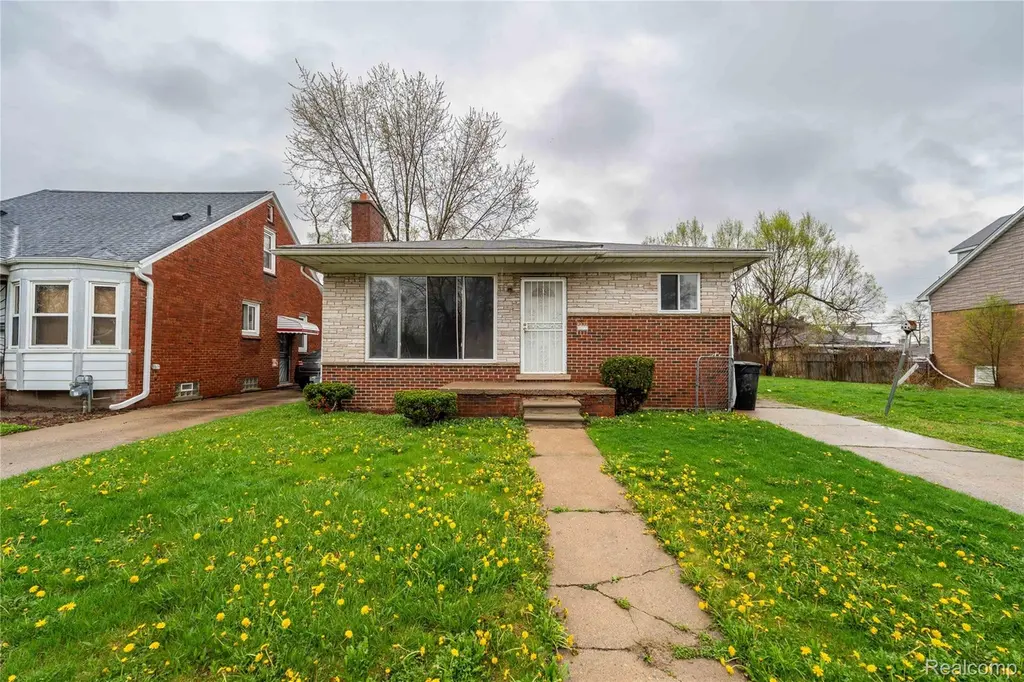
7282 Forrer St · Detroit, MI
Flood risk 1/10 · Minimal
- FEMA flood zone
- X (unshaded)
- Chance of flooding over 30 yrs
- 0.0%
- Est. flood insurance / yr
- $473 – $860
Fire risk 1/10 · Minimal
- Est. fire insurance / yr
- $784 – $1,456
Heat risk 3/10 · Minor
- Hot days now (above 97°F)
- 7 days/yr
- Hot days in 30 yrs
- 15 days/yr
Wind risk 2/10 · Minimal
- Chance of severe wind over 30 yrs
- —
Air-quality risk 3/10 · Minor
- Unhealthy air days now
- 2 days/yr
- Unhealthy air days in 30 yrs
- 4 days/yr
Risk factors via First Street. Map © Google.
Why this score? — see what drove the F grade
The composite is a weighted blend of 9 inputs, each scored 0–100. Each bar is that input's sub-score; the figure is the points it added to the 100-point composite (weight × sub-score).
- Cash flow +12.7/30.0
- DSCR +3.8/10.0
- Livability +3.7/5.0
- 1% rule +3.2/10.0
- Condition / age +2.5/5.0
- Rent growth +1.9/5.0
- Schools +1.3/10.0
- ARV discount +0.0/15.0
- Appreciation +0.0/10.0
$160,000
🖨 Deal sheet 📄 Offer letter ✓ Due diligence
Listing remarks MLS
Welcome to this Beautiful 3-bedroom brick ranch located in the desirable Warrendale area. This home features a spacious living room, a large kitchen with plenty of room to cook and dine, and a generously sized bathroom. All three bedrooms offer great space and comfort. The finished basement provides extra living or entertainment space. Solid home in a great location perfect for homeowners.
Key facts
- 5,227 sq ft lot
- 2 garage spots
- Built 1956
Neighborhood map
What this means for you Summary
Snapshot
- This is a 3-bed/1.0-bath single-family listed at $160k.
Deal economics
- At list price, monthly cash flow is $-17 ($-206/yr) — negative.
- To cash-flow at today's rent, offer at most $157k (1.9% below list).
- To meet the 1% rule (rent ≥ 1% of price), the offer needs to be $131k (18.4% below list).
- Recommended offer: $131k (18.4% below list) — sets the bar for 1% rule.
- Cap rate 6.2% vs local median 10.2% in Detroit — below-typical yield; the buyer is paying a premium for something (appreciation thesis, condition, location) that the cap rate doesn't capture.
Location & tenants
- Location reads 73/100 on livability (#218 in MI) — a middle-class / working-renter tenant base. Strengths: amenities A+, commute A+, cost of living A+; Watch: schools F, crime F, employment F.
- Detroit Public Schools Community District (urban): math 10% / reading 24% proficiency, ranked #499 of 540 in MI (top 92%) — low school quality limits family demand, transient renter base, plan for 1-2y turnover; 90% free/reduced lunch — lower-income household profile, screen leases tightly.
- Market conditions: Rents soft (-2.3%/yr); 363 active listings in the ZIP; 23 comparable units currently listed for rent nearby; rentals at typical pace (median 18d on market — plan ~3-4 weeks tenant-placement turnaround); lower-income renter base — watch delinquency; 2,639 units permitted in Wayne County in 2024 (1,216 in 5+ unit buildings).
- At $1,306/mo this rent would consume 51% of the median local household income ($31k/yr) (locally 4144% of renters already pay >50% of income on rent) — very limited rent-growth headroom before tenants either downsize or default.
Forward outlook
- Local home prices are declining (-3.0%/yr); year-one equity from $1k of loan paydown is wiped out by about $5k of value loss. Plan a longer hold.
- Wayne County population projected at -17% by 2050 — secular population decline; favor cash flow + early exit over multi-decade hold.
Negotiation context
- Only 5 days on market — expect competitive offers; lowballing is unlikely to land.
- 2 sale attempts with the ask held roughly flat each time — persistent listings suggest the price (not the market) is what's stuck; bring a comps-based counter.
Risks & watch-outs
- Watch-outs: built in 1956 — expect roof / HVAC / electrical / plumbing capex.
Questions for the listing agent
- What do current leases actually rent for vs. the listed asking? Can we see a recent rent roll and the last 12 months of T-12 income?
- Built in 1956 — when were the roof, HVAC, electrical panel, plumbing, and water heater last replaced?
- Is there a deadline driving the sale (1031 exchange, divorce, estate, relocation)? That informs how much negotiation room exists.
- Schools are F-rated, which usually means shorter tenancies and higher turnover. Who's the typical renter profile here, and what's been the actual vacancy rate?
- Crime grade is F in this area — have there been break-ins, vandalism, or insurance claims at this property in the last 3 years? What carrier currently insures it and at what premium?
- The area grade is low — what's the realistic commute time and amenity access for the typical tenant pool here? Any planned neighborhood developments (good or bad) we should know about?
- What's the average days-on-market for RENTAL listings here right now (not sales)? A rising rental-DOM trend means longer vacancies and softer asking-rent achievability than the comps imply.
- What's the recent tenant-quality profile in this submarket — average credit score on applications, eviction rate, late-payment / NSF rate, and stable-employment percentage? A property-management company in the area should have these aggregated.
- How much new for-sale + rental construction is in the pipeline within 1–3 miles? Heavy new supply typically softens prices + rents 12–24 months out; constrained supply supports both.
Investment metrics
- 1% rule
- 0.82% ✗
- Cap rate
- 6.16%
- Cash-on-cash
- -0.46%
- DSCR
- 0.98
- GRM
- 10.2
CMA / ARV
- ARV (on-the-fly)
- $130,620
- Comps found
- 12
Show comp detail 12 sales within ~0.75 mi
| Address | Dist | Beds/Ba | Sqft | Sold | Price | $/sf | Match |
|---|---|---|---|---|---|---|---|
| 7304 Saint Marys St | 0.19mi | 3/1.0 | 1,215 (-2%) | 5mo | $50,000 | $41 | 83 |
| 6857 Woodmont Ave | 0.45mi | 3/1.5 | 1,234 (-1%) | 7mo | $129,000 | $105 | 70 |
| 7483 Mettetal St | 0.32mi | 3/1.5 | 1,124 (-10%) | 5mo | $86,000 | $77 | 63 |
| 8040 Coyle St | 0.60mi | 3/1.0 | 1,248 (+0%) | 10mo | $150,000 | $120 | 63 |
| 7522 Forrer St | 0.20mi | 3/1.0 | 1,425 (+14%) | 7mo | $75,000 | $53 | 61 |
| 6303 Grandmont Ave | 0.74mi | 3/2.0 | 1,230 (-1%) | 4mo | $90,000 | $73 | 56 |
| 7904 Mead St | 0.57mi | 3/1.0 | 1,080 (-13%) | 6mo | $160,000 | $148 | 47 |
| 7484 Clayburn St | 0.61mi | 3/1.0 | 1,100 (-12%) | 7mo | $80,000 | $73 | 46 |
| 6400 Payne Ave | 0.71mi | 3/1.0 | 1,119 (-10%) | 7mo | $185,000 | $165 | 44 |
| 6463 Payne Ave | 0.62mi | 4/2.0 (+1) | 1,350 (+8%) | 6mo | $320,000 | $237 | 43 |
| 7793 Clayburn St | 0.71mi | 3/1.0 | 1,065 (-14%) | 8mo | $75,000 | $70 | 37 |
| 8131 Coyle St | 0.66mi | 4/1.0 (+1) | 1,094 (-12%) | 10mo | $140,000 | $128 | 36 |
Match score weights: distance 35% · size 25% · config 20% · recency 20%. Top-matched comps best support the ARV.
Projected returns pro-forma
-3.0% appreciation · 0.0% rent growth · sell at horizon
- IRR
- -20.3%
- Equity multiple
- 0.31×
- Total profit
- $-30,861
- Equity at exit
- $23,857
- IRR
- -21.4%
- Equity multiple
- 0.04×
- Total profit
- $-43,131
- Equity at exit
- $13,834
Cash invested: $44,800 (down + closing). Projections, not guarantees.
Landlord ↔ Tenant lean methodology
- Overall (STATE)
- 62 Landlord-Friendly
- State Michigan
- 62 Landlord-Friendly · EVEN
- County
- — inherits STATE
- City
- — inherits STATE
ZIP-level market 48228
- Rents YoY
- -2.3%
- Active inventory
- 363
- Price-to-rent
- 10.2×
Monthly cashflow live
- Estimated rent
- $1,306 high interval (Pro) →
- Mortgage (P&I)
- −$839
- Tax from tax record
- −$143 /mo · $1,717/yr
- Insurance
- −$67
- HOA
- −$0
- Vacancy / Maint / Mgmt
- −$274
- Net cashflow
- $-17
Break-even live
UW: 25.0% down · 7.5% · 30yr · 1.5% tax · 5.0% vac · 8.0% maint · 8.0% mgmt
Financing live
Cash to close
- Down payment
- $40,000
- Closing costs
- $4,800
- Reserves months
- —
- Total cash needed
- —
Loan-product check · same deal, 3 products live
Conventional
25% down · 7.5% · 30yr
- Down + closing
- —
- Monthly P&I
- —
- Monthly cashflow
- —
- DSCR
- —
- Eligible?
- —
Personal DTI + credit; lowest rate.
DSCR
20% down · 8.5% · 30yr
- Down + closing
- —
- Monthly P&I
- —
- Monthly cashflow
- —
- DSCR
- —
- Eligible?
- —
No personal income docs; deal must DSCR.
Hard money
10% down · 12.0% · 12mo
- Down + closing
- —
- Monthly P&I
- —
- Monthly cashflow
- —
- DSCR
- —
- Eligible?
- —
Short-term bridge; refi at stabilization.
Rent comps 23 comps
| Address | Beds | Baths | Sqft | Rent | $/sqft | DOM | Units | Dist |
|---|---|---|---|---|---|---|---|---|
| 7312 Mansfield St Detroit, MI | 4.0 | 1.0 | 1300 | $1,400 | $1.08 | 16d | 1 | 0.11mi |
| 7419 Rutherford St Detroit, MI | 2.0 | 1.0 | 981 | $1,150 | $1.17 | 14d | 1 | 0.13mi |
| 6474 Saint Marys St Detroit, MI | 3.0 | 1.0 | 1237 | $1,350 | $1.09 | 43d | 1 | 0.46mi |
| 8047 Robson St Detroit, MI | 3.0 | 2.0 | 1184 | $1,200 | $1.01 | 43d | 1 | 0.64mi |
| 6761 Memorial Ave Detroit, MI | 3.0 | 1.0 | 1060 | $1,100 | $1.04 | 24d | 1 | 0.64mi |
| 6406 Mead St Dearborn, MI | 2.0 | 1.0 | 904 | $1,100 | $1.22 | 24d | 1 | 0.75mi |
| 8331 Whitcomb St Detroit, MI | 4.0 | 1.0 | 1342 | $1,350 | $1.01 | 21d | 1 | 0.76mi |
| 8114 Marlowe St Unit home Detroit, MI | 3.0 | 1.0 | 985 | $1,350 | $1.37 | 43d | 1 | 0.82mi |
| 8212 Lauder St Detroit, MI | 3.0 | 1.0 | 1026 | $1,150 | $1.12 | 43d | 1 | 0.83mi |
| 8604 Whitcomb St Detroit, MI | 3.0 | 2.0 | 1033 | $1,300 | $1.26 | 43d | 1 | 0.89mi |
| 8262 Rosemont Ave Detroit, MI | 3.0 | 1.0 | 836 | $1,200 | $1.44 | 4d | 1 | 1.11mi |
| 6225 Middlesex St Unit 5 Dearborn, MI | 2.0 | 1.0 | 700 | $950 | $1.36 | 12d | 1 | 1.16mi |
| 6225 Middlesex St Unit 5 Dearborn, MI | 2.0 | 1.0 | 700 | $950 | $1.36 | 4d | 1 | 1.16mi |
| 8451 Rosemont Ave Detroit, MI | 3.0 | 1.0 | 867 | $1,150 | $1.33 | 43d | 1 | 1.20mi |
| 9220 Mansfield St Detroit, MI | 3.0 | 1.0 | 1200 | $1,300 | $1.08 | 43d | 1 | 1.25mi |
| 9222 Forrer St Detroit, MI | 3.0 | 1.0 | 947 | $1,450 | $1.53 | 16d | 1 | 1.25mi |
| 6490 Stahelin Ave Detroit, MI | 3.0 | 1.0 | 960 | $1,299 | $1.35 | 16d | 1 | 1.30mi |
| 9345 Rutherford St Unit 3 Detroit, MI | 2.0 | 1.0 | 850 | $1,050 | $1.24 | 24d | 1 | 1.33mi |
| 8850 Rosemont Ave Detroit, MI | 3.0 | 1.0 | 933 | $1,100 | $1.18 | 17d | 1 | 1.34mi |
| 5777 Southfield Fwy Detroit, MI | 2.0 | 1.0–2.0 | 667 | $1,540 | $2.31 | 2d | 10 | 1.35mi |
| 9108 Archdale St Detroit, MI | 3.0 | 1.0 | 1000 | $1,300 | $1.30 | 4d | 1 | 1.36mi |
| 9386 Coyle St Detroit, MI | 3.0 | 1.0 | 1000 | $1,300 | $1.30 | 1d | 1 | 1.40mi |
| 4900 Heather Dr Dearborn, MI | 1.0–2.0 | 1.0–2.0 | 921 | $1,980 | $2.15 | 1d | 1 | 1.48mi |
Listing history 4 events
-
2026-04-22status Pending 392-char remark
Show marketing remark (392 chars)
Welcome to this Beautiful 3-bedroom brick ranch located in the desirable Warrendale area. This home features a spacious living room, a large kitchen with plenty of room to cook and dine, and a generously sized bathroom. All three bedrooms offer great space and comfort. The finished basement provides extra living or entertainment space. Solid home in a great location perfect for homeowners.
-
2026-04-22status Pending
Show marketing remark (392 chars)
Welcome to this Beautiful 3-bedroom brick ranch located in the desirable Warrendale area. This home features a spacious living room, a large kitchen with plenty of room to cook and dine, and a generously sized bathroom. All three bedrooms offer great space and comfort. The finished basement provides extra living or entertainment space. Solid home in a great location perfect for homeowners.
-
2026-04-17$160,000 Active 392-char remark
Show marketing remark (392 chars)
Welcome to this Beautiful 3-bedroom brick ranch located in the desirable Warrendale area. This home features a spacious living room, a large kitchen with plenty of room to cook and dine, and a generously sized bathroom. All three bedrooms offer great space and comfort. The finished basement provides extra living or entertainment space. Solid home in a great location perfect for homeowners.
-
2026-04-17$160,000 Active
Show marketing remark (392 chars)
Welcome to this Beautiful 3-bedroom brick ranch located in the desirable Warrendale area. This home features a spacious living room, a large kitchen with plenty of room to cook and dine, and a generously sized bathroom. All three bedrooms offer great space and comfort. The finished basement provides extra living or entertainment space. Solid home in a great location perfect for homeowners.
ⓘ Source: listings_history table (triggers on properties + properties_extension) + one-shot
backfill from property_details.listing_events for pre-trigger history.
Tax reassessment forecast MI · Partial reset (capped growth)
- Current annual tax
- $1,717 · $143/mo
- Projected year-2 tax
- $2,090 · $174/mo
- Expected delta
- +$374/yr (+$31/mo · 21.8%)
ⓘ Screening estimate from a state-policy table — verify with the county assessor before closing.
Climate risk First Street
- Flood 1/10 Low FEMA zone X (unshaded) · 0% chance over 30 yrs
- Wildfire 1/10 Low
- Heat 3/10 Moderate 7 d/yr ≥97°F today · 15 d/yr by 30 yrs out
- Wind 2/10 Low
- Air quality 3/10 Moderate 2 unhealthy d/yr today · 4 by 30 yrs out
Nearby sold comps map
Loading sold comps map…
Walkable amenities ~0.75 mi
Loading nearby amenities…
Taxation est. · year 1
- Rental income
- $15,670
- − Mortgage interest
- −$8,962
- − Property taxes
- −$1,717
- − Insurance
- −$800
- − Repairs & maintenance
- −$1,254
- − Management
- −$1,254
- − Depreciation
- −$4,655
- Taxable loss
- −$2,971
- Est. tax savings @ 24.0%
- +$713
- After-tax cash flow
- $507/yr
For passive investors: Depreciation is non-cash, so a rental often shows a tax loss while cash-flowing — sheltering income. Rental losses are passive: they offset passive income freely, and up to $25,000/yr can offset ordinary (W-2) income if you actively participate and your MAGI is under $100k (phasing out to $0 by $150k); unused losses carry forward. On sale, claimed depreciation is recaptured at up to 25%, and gains may owe capital-gains tax (a 1031 exchange can defer both). Figures are a year-1 estimate at your 24.0% rate — not tax advice; consult a CPA.
Schools (NCES district)
- District
- Detroit Public Schools Community District
- NCES district ID
- 2601103
- Math proficiency
- 10% ▼ -2.00%
- Reading proficiency
- 24% ▲ 6.00%
- Median HH income
- $25,815
- Composite
- 13.06/100
- National rank
- #9564
- State rank
- #499 of 540 in MI
Livability — Detroit
- Score
- 73/100
- State rank
- #218
- US rank
- #5427
Category grades
Schools grade is shown separately in the Schools card above.
Census & demographics
- Census place
- Detroit, MI
- County
- Wayne County · 1,562,939 people
- City population
- 572,865
- Metro
- Detroit-Warren-Dearborn, MI
- Population (ZIP)
- 50,117
- Household income
- $30,680
- Rent vs Own
- Severe rent burden
- 4144.0
Population outlook (Wayne County) Hauer SSP2
- Today (2025)
- 1,675,273 people
- By 2030
- 1,620,300 · -3.3%
- By 2040
- 1,502,341 · -10.3%
- By 2050
- 1,384,039 · -17.4%
- By 2075
- 1,124,592 · -32.9%
- By 2100
- 881,193 · -47.4%
Race, ethnicity, and origin ACS 2023
- Neighborhood character
- Predominantly Black (71%)
- Race & ethnicity
- Black 71% White 16% Two or more races 7% Hispanic / Latino 6%
- Hispanic origin (detail)
- Mexican 3% Puerto Rican 2%
- Common ancestry
- Arab 2% Romanian 2% Lithuanian 1%
- Foreign-born
- 11% · Canada
- Languages at home
- 82% English-only · Arabic 11% Spanish 5%
Political lean MEDSL · Wayne
- 2024 margin
- Strong D (+29.0) · D 62.7% · R 33.7% · Other 3.6%
- 2008→2024 swing
- -20.5pp toward R · 2008: 49.5pp · 2024: 29.0pp
- All cycles
- 2024: D+29.0 2020: D+38.1 2016: D+37.3 2012: D+46.9 2008: D+49.5
Not yet ingested
- Civics
- —
Market trends
- HPI YoY
- ▼ -160.81%
- Current HPI
- 168.6843
- Rent YoY
- ▼ -2.30%
- Metro
- Detroit-Warren-Dearborn, MI
- State GDP YoY
- ▲ 1.37%
- F500 in state
- 28
Industry mix (Fortune 500 HQ in MI)
| Industry | F500 HQs | Revenue |
|---|---|---|
| Automotive Parts | 3 | $48B |
|
||
| Automotive | 2 | $372B |
|
||
| Chemicals | 1 | $45B |
|
||
| Automotive Retail | 1 | $29B |
|
||
| Healthcare / Medical Devices | 1 | $23B |
|
||
| Automotive Technology | 1 | $20B |
|
||
Price history
+0.0% since first listed4 events — show timeline
- 2026-04-22 Pending — MiRealSource-MiMLS
- 2026-04-22 Pending — REALCOMP
- 2026-04-17 Listed $160,000 REALCOMP
- 2026-04-17 Listed $160,000 MiRealSource-MiMLS
Property tax history
+0.1%/yrLatest (2025): $1,717 · -54.2% YoY. Source: county tax records.
Cash-flow waterfall
monthlySold comps — $/sqft
last 12 mo · ≤1 miLoading sold comps…