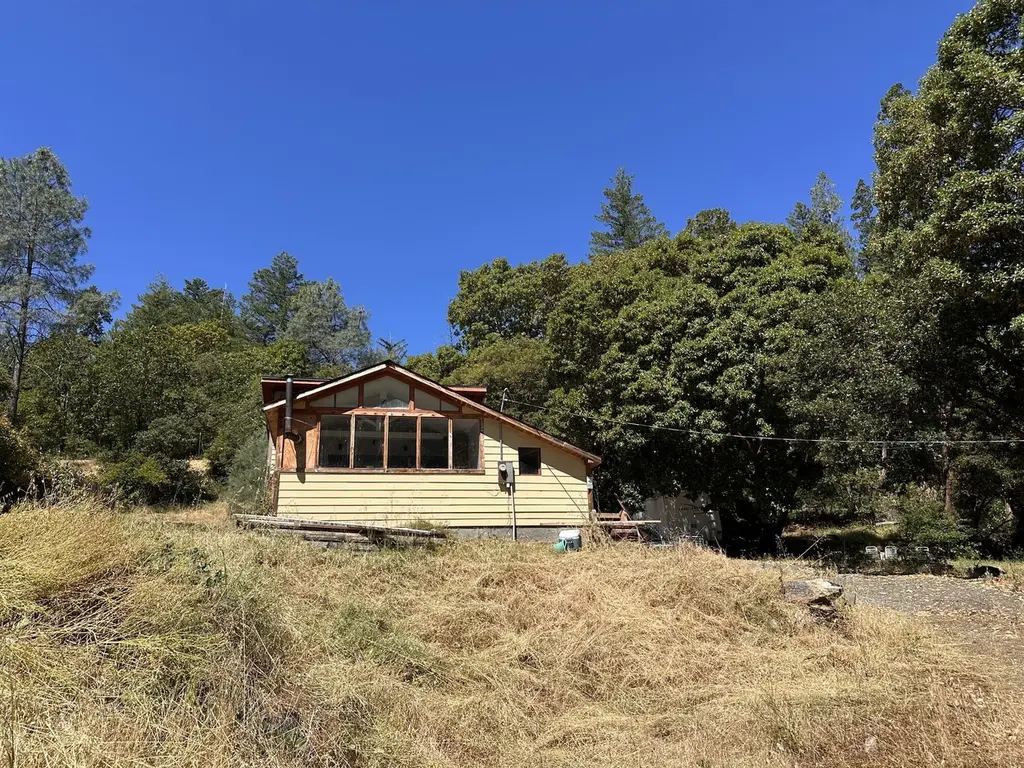
10250 California 299 None · Burnt Ranch, CA
Flood risk 6/10 · Moderate
- FEMA flood zone
- X (unshaded)
- Chance of flooding over 30 yrs
- 0.27%
- Est. flood insurance / yr
- $507 – $1,088
Fire risk 8/10 · Major
- Est. fire insurance / yr
- $659 – $1,223
Heat risk 6/10 · Moderate
- Hot days now (above 101°F)
- 9 days/yr
- Hot days in 30 yrs
- 19 days/yr
Wind risk 1/10 · Minimal
- Chance of severe wind over 30 yrs
- —
Air-quality risk 10/10 · Severe
- Unhealthy air days now
- 35 days/yr
- Unhealthy air days in 30 yrs
- 38 days/yr
Risk factors via First Street. Map © Google.
Why this score? — see what drove the B- grade
The composite is a weighted blend of 9 inputs, each scored 0–100. Each bar is that input's sub-score; the figure is the points it added to the 100-point composite (weight × sub-score).
- Cash flow +27.0/30.0
- DSCR +9.4/10.0
- ARV discount +7.5/15.0
- 1% rule +7.1/10.0
- Appreciation +4.1/10.0
- Schools +4.0/10.0
- Livability +2.6/5.0
- Rent growth +2.5/5.0
- Condition / age +2.5/5.0
$99,000
🖨 Deal sheet (PDF) 📄 Offer letter ✓ Due diligence
Listing remarks MLS
Seller financing available, inquire about terms with your agent! Vacant and ready for a new owner, this property is conveniently tucked up off of the highway with privacy and views of beautiful Ironside Mountain. Just minutes from the trails to the infamous Burnt Ranch Gorge for fishing and whitewater recreation. Nearby the Trinity Alps Wilderness and swimming holes of the Trinity River. This is your opportunity to build equity and restore this home and property to suit your needs. Price reflects that the property is being sold as is.
Key facts
- Blank canvas
- Fixer upper
- 0.35 acre lot
Tags
Property features AI
Exterior
- Parking: RV access/parking
- Utilities: Electricity connected; Private sewer
- Home design: Single-family residence; Multi/split levels
- Construction: Frame construction with wood siding; Metal roof; Other foundation
- Exterior features: Garden; Partial fencing; Gravel road access (public maintained road)
Interior
- Heating & cooling: Electric heating
- Interior features: Six total rooms
Neighborhood map
What this means for you Summary
Snapshot
- This is a 2-bed/2.0-bath single-family listed at $99k.
Deal economics
- At list price, monthly cash flow is $279 ($3k/yr) — positive.
- The deal already cash-flows at list — no discount required.
- Meets the 1% rule at list price ($1k rent vs $99k).
- Recommended offer: $98k (1.5% below list) — sets the bar for market timing.
Location & tenants
- Location reads 51/100 on livability (#1,057 in CA) — a working-class tenant base; expect higher turnover. Strengths: crime A; Watch: health & safety C-, employment D+, amenities F.
- Burnt Ranch Elementary (rural): math 40% / reading 50% proficiency, ranked #614 of 1,400 in CA (top 44%) — families likely to look elsewhere, expect single-tenant / working-renter base with shorter leases.
- Market conditions: 22 active listings in the ZIP; 21 units permitted in Trinity County in 2024 (0 in 5+ unit buildings).
Forward outlook
- Local home prices are declining (-1.9%/yr); year-one equity from $684 of loan paydown is wiped out by about $2k of value loss. Plan a longer hold.
- Trinity County population projected at -38% by 2050 — secular population decline; favor cash flow + early exit over multi-decade hold.
- At projected returns (-1.9% appreciation + 3.0% rent growth), your $28k cash investment doubles in ~8 years — after that, you're playing with house money.
Negotiation context
- It's been on market 20 days — a 2% lower offer ($98k) is reasonable based on typical stale-listing flexibility.
- 4 sale attempts since 9y ago with the ask held roughly flat each time — persistent listings suggest the price (not the market) is what's stuck; bring a comps-based counter.
- Current owner paid $47k; list at $99k implies a 111% gain — meaningful room to come down on a strong offer.
Risks & watch-outs
- Watch-outs: built in 1945 — expect roof / HVAC / electrical / plumbing capex.
- Climate carrying-cost: major flood risk; severe wildfire risk; extreme-heat days projected 9→19/yr by 2055 (HVAC capex compounding) — expect insurance premiums to compound above CPI over the hold.
Questions for the listing agent
- Built in 1945 — when were the roof, HVAC, electrical panel, plumbing, and water heater last replaced?
- Is there a deadline driving the sale (1031 exchange, divorce, estate, relocation)? That informs how much negotiation room exists.
- What's the average days-on-market for RENTAL listings here right now (not sales)? A rising rental-DOM trend means longer vacancies and softer asking-rent achievability than the comps imply.
- What's the recent tenant-quality profile in this submarket — average credit score on applications, eviction rate, late-payment / NSF rate, and stable-employment percentage? A property-management company in the area should have these aggregated.
- How much new for-sale + rental construction is in the pipeline within 1–3 miles? Heavy new supply typically softens prices + rents 12–24 months out; constrained supply supports both.
Investment metrics
- 1% rule
- 1.21% ✓
- Cap rate
- 9.67%
- Cash-on-cash
- 12.06%
- DSCR
- 1.54
- GRM
- 6.9
CMA / ARV
- ARV (on-the-fly)
- $507,600
- Comps found
- 1
Show comp detail 1 sale within ~0.75 mi
| Address | Dist | Beds/Ba | Sqft | Sold | Price | $/sf | Match |
|---|---|---|---|---|---|---|---|
| 10331 Highway 299 | 0.16mi | 3/2.5 (+1) | 1,550 (-14%) | 4mo | $437,000 | $282 | 59 |
Match score weights: distance 35% · size 25% · config 20% · recency 20%. Top-matched comps best support the ARV.
Projected returns pro-forma
-1.89% appreciation · 3.0% rent growth · sell at horizon
- IRR
- 5.5%
- Equity multiple
- 1.23×
- Total profit
- $6,379
- Equity at exit
- $19,731
- IRR
- 13.1%
- Equity multiple
- 2.18×
- Total profit
- $32,625
- Equity at exit
- $17,345
Cash invested: $27,720 (down + closing). Projections, not guarantees.
Landlord ↔ Tenant lean methodology
- Overall (STATE)
- 18 Strongly Tenant-Friendly
- State California
- 18 Strongly Tenant-Friendly · D+13
- County
- — inherits STATE
- City
- — inherits STATE
ZIP-level market 95527
- Home prices YoY
- -2.1%
- Active inventory
- 22
- Price-to-rent
- 6.9×
Monthly cashflow live
- Estimated rent
- $1,200 medium interval (Pro) →
- Mortgage (P&I)
- −$519
- Tax from tax record
- −$109 /mo · $1,312/yr
- Insurance
- −$41
- HOA
- −$0
- Vacancy / Maint / Mgmt
- −$252
- Net cashflow
- $279
Break-even live
Sensitivity live
| Price | -10% $335 | -5% $307 | +0% $279 | +5% $251 | +10% $222 |
|---|---|---|---|---|---|
| Rent | -10% $184 | -5% $231 | +0% $279 | +5% $326 | +10% $373 |
| Rate | -1.0pp $328 | -0.5pp $304 | base $279 | +0.5pp $253 | +1.0pp $227 |
UW: 25.0% down · 7.5% · 30yr · 1.5% tax · 5.0% vac · 8.0% maint · 8.0% mgmt
Financing live
Cash to close
- Down payment
- $24,750
- Closing costs
- $2,970
- Reserves months
- —
- Total cash needed
- —
Loan-product check · same deal, 3 products live
Conventional
25% down · 7.5% · 30yr
- Down + closing
- —
- Monthly P&I
- —
- Monthly cashflow
- —
- DSCR
- —
- Eligible?
- —
Personal DTI + credit; lowest rate.
DSCR
20% down · 8.5% · 30yr
- Down + closing
- —
- Monthly P&I
- —
- Monthly cashflow
- —
- DSCR
- —
- Eligible?
- —
No personal income docs; deal must DSCR.
Hard money
10% down · 12.0% · 12mo
- Down + closing
- —
- Monthly P&I
- —
- Monthly cashflow
- —
- DSCR
- —
- Eligible?
- —
Short-term bridge; refi at stabilization.
Listing history 15 events
-
2026-06-21days on market $99,000 Active 20 DOM
-
2026-06-19days on market $99,000 Active 18 DOM
-
2026-06-18days on market $99,000 Active 17 DOM
-
2026-06-17days on market $99,000 Active 16 DOM
-
2026-06-16days on market $99,000 Active 15 DOM
-
2026-06-15days on market $99,000 Active 14 DOM
-
2026-06-14days on market $99,000 Active 12 DOM
-
2026-06-12days on market $99,000 Active 11 DOM
-
2026-06-09days on market $99,000 Active 8 DOM
-
2026-06-08days on market $99,000 Active 7 DOM
-
2026-06-07days on market $99,000 Active 6 DOM
-
2026-06-04remarks 699-char remark
-
2026-06-04days on market $99,000 Active 2 DOM
-
2026-06-02remarks 196-char remark
-
2026-06-02$99,000 Active 1 DOM
ⓘ Source: listings_history table (triggers on properties + properties_extension) + one-shot
backfill from property_details.listing_events for pre-trigger history.
Tax reassessment forecast CA · Resets to sale price
- Current annual tax
- $1,312 · $109/mo
- Projected year-2 tax
- $1,312 · $109/mo
- Expected delta
- $0/yr ($0/mo · 0.0%)
ⓘ Screening estimate from a state-policy table — verify with the county assessor before closing.
Climate risk First Street
- Flood 6/10 Major FEMA zone X (unshaded) · 27% chance over 30 yrs
- Wildfire 8/10 Severe
- Heat 6/10 Major 9 d/yr ≥101°F today · 19 d/yr by 30 yrs out
- Wind 1/10 Low
- Air quality 10/10 Extreme 35 unhealthy d/yr today · 38 by 30 yrs out
Nearby sold comps map
Loading sold comps map…
Walkable amenities ~0.75 mi
Loading nearby amenities…
Taxation est. · year 1
- Rental income
- $14,404
- − Mortgage interest
- −$5,546
- − Property taxes
- −$1,312
- − Insurance
- −$495
- − Repairs & maintenance
- −$1,152
- − Management
- −$1,152
- − Depreciation
- −$2,880
- Taxable income
- $1,867
- Est. tax owed @ 24.0%
- −$448
- After-tax cash flow
- $2,894/yr
For passive investors: Depreciation is non-cash, so a rental often shows a tax loss while cash-flowing — sheltering income. Rental losses are passive: they offset passive income freely, and up to $25,000/yr can offset ordinary (W-2) income if you actively participate and your MAGI is under $100k (phasing out to $0 by $150k); unused losses carry forward. On sale, claimed depreciation is recaptured at up to 25%, and gains may owe capital-gains tax (a 1031 exchange can defer both). Figures are a year-1 estimate at your 24.0% rate — not tax advice; consult a CPA.
Schools (NCES district)
- District
- Burnt Ranch Elementary
- NCES district ID
- 0606510
- Math proficiency
- 40% ▲ 20.00%
- Reading proficiency
- 50% ▲ 10.00%
- Median HH income
- $37,482
- Composite
- 39.65/100
- National rank
- #8040
- State rank
- #614 of 1400 in CA
Livability — Burnt Ranch
- Score
- 51/100
- State rank
- #1057
- US rank
- #25215
Category grades
Schools grade is shown separately in the Schools card above.
Census & demographics
- Census place
- Burnt Ranch, CA
- City population
- 584
- Population (ZIP)
- 708
Population outlook (Trinity County) Hauer SSP2
- Today (2025)
- 11,337 people
- By 2030
- 10,349 · -8.7%
- By 2040
- 8,518 · -24.9%
- By 2050
- 7,084 · -37.5%
- By 2075
- 4,693 · -58.6%
- By 2100
- 2,894 · -74.5%
Race, ethnicity, and origin ACS 2023
- Neighborhood character
- Predominantly White (87%)
- Race & ethnicity
- White 87% Native American 11% Two or more races 2%
- Common ancestry
- Portuguese 4% Lithuanian 2% Serbian 1%
- Foreign-born
- 3%
- Languages at home
- 97% English-only · Other Indo-European 3%
Political lean MEDSL · Trinity
- 2024 margin
- Lean R (+9.4) · D 43.4% · R 52.8% · Other 3.8%
- 2008→2024 swing
- -14.0pp toward R · 2008: 4.6pp · 2024: -9.4pp
- All cycles
- 2024: R+9.4 2020: R+5.4 2016: R+11.3 2012: R+1.1 2008: D+4.6
Not yet ingested
- Civics
- —
Market trends
- HPI YoY
- ▼ -1.89%
- Current HPI
- 86.6321
- Rent YoY
- —
- Metro
- —
- State GDP YoY
- ▲ 3.21%
- F500 in state
- 116
Industry mix (Fortune 500 HQ in CA)
| Industry | F500 HQs | Revenue |
|---|---|---|
| Technology | 27 | $1,492B |
|
||
| Financial Services | 3 | $174B |
|
||
| Retail | 3 | $44B |
|
||
| Insurance | 3 | $26B |
|
||
| Media / Entertainment | 2 | $115B |
|
||
| Pharmaceuticals / Biotech | 2 | $62B |
|
||
Price history
+273.6% since first listed9 events — show timeline
- 2026-05-29 Listed $99,000 HAR
- 2025-11-10 Sold (Public Records) $47,000 Public Records
- 2025-11-10 Sold (MLS) $47,000 HAR
- 2025-10-13 Relisted — HAR
- 2025-07-21 Listed $60,000 HAR
- 2017-05-25 Sold (Public Records) $100,909 Public Records
- 2017-05-25 Sold (MLS) $99,900 HAR
- 2017-05-10 Listed $125,000 HAR
- 1992-01-09 Sold (Public Records) $26,500 Public Records
Property tax history
+2.3%/yrLatest (2025): $1,312 · +1.6% YoY. Source: county tax records.
Cash-flow waterfall
monthlySold comps — $/sqft
last 12 mo · ≤1 miLoading sold comps…