2209 Katie Crk · Marion, TX
Flood risk No data
- FEMA flood zone
- —
- Chance of flooding over 30 yrs
- —
- Est. flood insurance / yr
- —
Fire risk No data
- Est. fire insurance / yr
- —
Heat risk No data
- Hot days now (above threshold)
- —
- Hot days in 30 yrs
- —
Wind risk No data
- Chance of severe wind over 30 yrs
- —
Air-quality risk No data
- Unhealthy air days now
- —
- Unhealthy air days in 30 yrs
- —
Risk factors via First Street. Map © Google.
Why this score? — see what drove the D grade
The composite is a weighted blend of 9 inputs, each scored 0–100. Each bar is that input's sub-score; the figure is the points it added to the 100-point composite (weight × sub-score).
- Cash flow +12.0/30.0
- ARV discount +9.1/15.0
- Schools +4.0/10.0
- Condition / age +4.0/5.0
- DSCR +3.5/10.0
- 1% rule +3.4/10.0
- Livability +3.3/5.0
- Rent growth +2.5/5.0
- Appreciation +0.0/10.0
$236,999
🖨 Deal sheet 📄 Offer letter ✓ Due diligence
Listing remarks
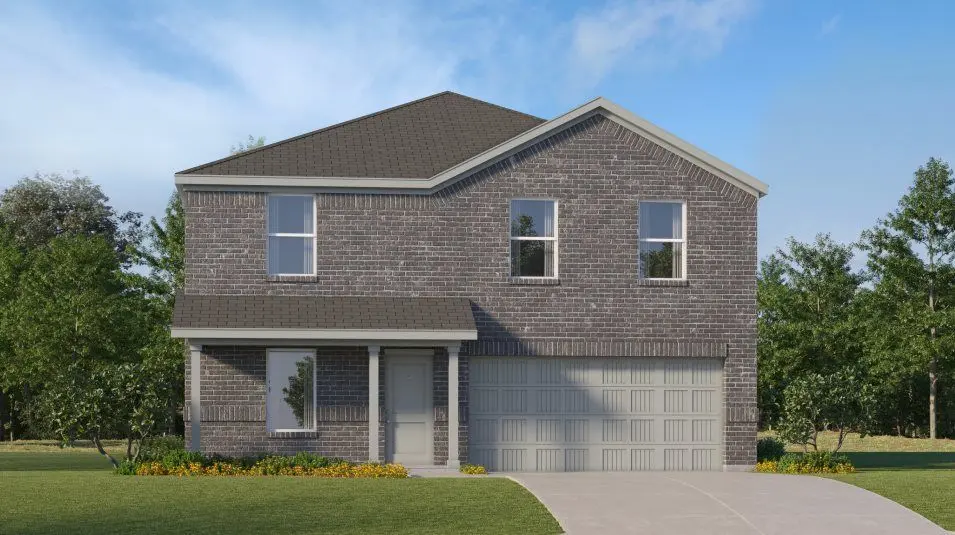
On the first floor of this spacious two-story home is a convenient and modern layout seamlessly connecting the kitchen, dining room and family room together. In a private corner is the tranquil owner's suite with an attached bathroom and walk-in closet. Upstairs is a sprawling central game room made for gatherings of all sizes, along with three secondary bedrooms to provide sleeping accommodations to family members and guests.
Key facts
- Central game room
- Attached bathroom
- Walk-in closet
Tags
Property features AI
Finance
- Other: List price $232,999; Property listed as Active (last modified May 26, 2026)
- Financial info:
- HOA & community:
Exterior
- Parking: Attached 2-car garage (2 total parking spaces)
- Security:
- Utilities:
- Home design: Spec new-construction plan named Littleton
- Construction:
- Exterior features: Living area approximately 1,891
Interior
- Kitchen:
- Bedrooms: 4 bedrooms
- Flooring:
- Bathrooms: 2 full bathrooms and 1 half bathroom
- Heating & cooling:
- Interior features: Open living area
- Laundry & utility:
Neighborhood map
What this means for you Summary
Snapshot
- This is a 4-bed/2.5-bath single-family listed at $237k. Condition is rated good.
Deal economics
- At list price, monthly cash flow is $-59 ($-702/yr) — negative.
- To cash-flow at today's rent, offer at most $229k (3.6% below list).
- To meet the 1% rule (rent ≥ 1% of price), the offer needs to be $200k (15.6% below list).
- Recommended offer: $200k (15.6% below list) — sets the bar for 1% rule.
- Cap rate 6.0% vs local median 4.5% in Marion — top-decile yield for the area; either an underpriced asset or a hidden risk that comps aren't pricing in. Stress-test before assuming the spread holds.
Location & tenants
- Location reads 66/100 on livability (#614 in TX) — a middle-class / working-renter tenant base. Strengths: crime A+, cost of living A+, housing A+; Watch: amenities F, commute F, health & safety F.
- Marion ISD (suburban): math 44% / reading 47% proficiency, ranked #243 of 826 in TX (top 29%) — families likely to look elsewhere, expect single-tenant / working-renter base with shorter leases.
- Market conditions: 408 active listings in the ZIP; 2,064 units permitted in Guadalupe County in 2024 (133 in 5+ unit buildings).
Forward outlook
- Local home prices are declining (-3.0%/yr); year-one equity from $2k of loan paydown is wiped out by about $7k of value loss. Plan a longer hold.
- Guadalupe County population projected at +61% by 2050 — long-run rental-demand tailwind backs the buy-and-hold thesis.
Negotiation context
- It's been on market 23 days — a 2% lower offer ($233k) is reasonable based on typical stale-listing flexibility.
Questions for the listing agent
- What do current leases actually rent for vs. the listed asking? Can we see a recent rent roll and the last 12 months of T-12 income?
- Is there a deadline driving the sale (1031 exchange, divorce, estate, relocation)? That informs how much negotiation room exists.
- The area grade is low — what's the realistic commute time and amenity access for the typical tenant pool here? Any planned neighborhood developments (good or bad) we should know about?
- What's the average days-on-market for RENTAL listings here right now (not sales)? A rising rental-DOM trend means longer vacancies and softer asking-rent achievability than the comps imply.
- What's the recent tenant-quality profile in this submarket — average credit score on applications, eviction rate, late-payment / NSF rate, and stable-employment percentage? A property-management company in the area should have these aggregated.
- How much new for-sale + rental construction is in the pipeline within 1–3 miles? Heavy new supply typically softens prices + rents 12–24 months out; constrained supply supports both.
Investment metrics
- 1% rule
- 0.84% ✗
- Cap rate
- 6.00%
- Cash-on-cash
- -1.06%
- DSCR
- 0.95
- GRM
- 9.9
CMA / ARV
- ARV (on-the-fly)
- $245,830
- Comps found
- 12
Show comp detail 12 sales within ~0.75 mi
| Address | Dist | Beds/Ba | Sqft | Sold | Price | $/sf | Match |
|---|---|---|---|---|---|---|---|
| 2215 Allison Crk | 0.00mi | 4/2.5 | 1,885 (-0%) | 1mo | $232,999 | $124 | 98 |
| 2223 Allison Crk | 0.00mi | 4/2.0 | 1,850 (-2%) | 1mo | $232,999 | $126 | 94 |
| 2111 Allison Crk | 0.00mi | 4/2.0 | 1,850 (-2%) | 1mo | $232,999 | $126 | 94 |
| 111 Petey Pl | 0.00mi | 4/3.0 | 1,795 (-5%) | 1mo | $263,999 | $147 | 89 |
| 127 Petey Pl | 0.00mi | 4/3.0 | 1,795 (-5%) | 1mo | $268,999 | $150 | 88 |
| 2231 Laurie Spgs | 0.00mi | 4/3.0 | 2,015 (+7%) | 1mo | $259,999 | $129 | 86 |
| 2219 Allison Crk | 0.00mi | 4/2.0 | 1,667 (-12%) | 1mo | $216,999 | $130 | 77 |
| 725 Thea Mdws | 0.00mi | 4/2.5 | 2,173 (+15%) | 1mo | $251,999 | $116 | 74 |
| 709 Thea Mdws | 0.00mi | 4/2.5 | 2,173 (+15%) | 1mo | $246,999 | $114 | 74 |
| 2126 Monument Hl | 0.46mi | 4/3.0 | 2,024 (+7%) | 1mo | $279,999 | $138 | 64 |
| 112 Seidel | 0.62mi | 4/2.0 | 2,054 (+9%) | 1mo | $319,000 | $155 | 54 |
| 121 Lost Pines Ln | 0.56mi | 3/2.0 (-1) | 1,658 (-12%) | 1mo | $315,000 | $190 | 45 |
Match score weights: distance 35% · size 25% · config 20% · recency 20%. Top-matched comps best support the ARV.
Projected returns pro-forma
-3.0% appreciation · 3.0% rent growth · sell at horizon
- IRR
- -18.0%
- Equity multiple
- 0.37×
- Total profit
- $-42,100
- Equity at exit
- $35,337
- IRR
- -10.2%
- Equity multiple
- 0.38×
- Total profit
- $-41,336
- Equity at exit
- $20,491
Cash invested: $66,360 (down + closing). Projections, not guarantees.
Landlord ↔ Tenant lean methodology
- Overall (STATE)
- 87 Strongly Landlord-Friendly
- State Texas
- 87 Strongly Landlord-Friendly · R+5
- County
- — inherits STATE
- City
- — inherits STATE
ZIP-level market 78124
- Active inventory
- 408
- Price-to-rent
- 9.9×
Monthly cashflow live
- Estimated rent
- $1,999 medium interval (Pro) →
- Mortgage (P&I)
- −$1,243
- Tax est. 1.5%
- −$296 /mo · $3,555/yr
- Insurance
- −$99
- HOA
- −$0
- Vacancy / Maint / Mgmt
- −$420
- Net cashflow
- $-59
Break-even live
UW: 25.0% down · 7.5% · 30yr · 1.5% tax · 5.0% vac · 8.0% maint · 8.0% mgmt
Financing live
Cash to close
- Down payment
- $59,250
- Closing costs
- $7,110
- Reserves months
- —
- Total cash needed
- —
Loan-product check · same deal, 3 products live
Conventional
25% down · 7.5% · 30yr
- Down + closing
- —
- Monthly P&I
- —
- Monthly cashflow
- —
- DSCR
- —
- Eligible?
- —
Personal DTI + credit; lowest rate.
DSCR
20% down · 8.5% · 30yr
- Down + closing
- —
- Monthly P&I
- —
- Monthly cashflow
- —
- DSCR
- —
- Eligible?
- —
No personal income docs; deal must DSCR.
Hard money
10% down · 12.0% · 12mo
- Down + closing
- —
- Monthly P&I
- —
- Monthly cashflow
- —
- DSCR
- —
- Eligible?
- —
Short-term bridge; refi at stabilization.
Listing history 14 events
-
2026-06-18days on market $236,999 Active 23 DOM
-
2026-06-17pricedays on market $236,999 Active 22 DOM
-
2026-06-16days on market $237,999 Active 21 DOM
-
2026-06-15days on market $237,999 Active 20 DOM
-
2026-06-13days on market $237,999 Active 18 DOM
-
2026-06-13days on market $237,999 Active 17 DOM
-
2026-06-09days on market $237,999 Active 14 DOM
-
2026-06-08days on market $237,999 Active 13 DOM
-
2026-06-07days on market $237,999 Active 12 DOM
-
2026-06-04pricedays on market $237,999 Active 9 DOM
-
2026-06-03days on market $232,999 Active 8 DOM
-
2026-06-02days on market $232,999 Active 7 DOM
-
2026-06-01days on market $232,999 Active 6 DOM
-
2026-05-31days on market $232,999 Active 5 DOM
ⓘ Source: listings_history table (triggers on properties + properties_extension) + one-shot
backfill from property_details.listing_events for pre-trigger history.
Nearby sold comps map
Loading sold comps map…
Walkable amenities ~0.75 mi
Loading nearby amenities…
Taxation est. · year 1
- Rental income
- $23,990
- − Mortgage interest
- −$13,276
- − Property taxes
- −$3,555
- − Insurance
- −$1,185
- − Repairs & maintenance
- −$1,919
- − Management
- −$1,919
- − Depreciation
- −$6,895
- Taxable loss
- −$4,759
- Est. tax savings @ 24.0%
- +$1,142
- After-tax cash flow
- $440/yr
For passive investors: Depreciation is non-cash, so a rental often shows a tax loss while cash-flowing — sheltering income. Rental losses are passive: they offset passive income freely, and up to $25,000/yr can offset ordinary (W-2) income if you actively participate and your MAGI is under $100k (phasing out to $0 by $150k); unused losses carry forward. On sale, claimed depreciation is recaptured at up to 25%, and gains may owe capital-gains tax (a 1031 exchange can defer both). Figures are a year-1 estimate at your 24.0% rate — not tax advice; consult a CPA.
Condition & rehab AI · 13 photos
This two-story home features a modern and spacious layout with good condition throughout. It is move-in ready with minor cosmetic updates that could significantly enhance its value.
Value-add opportunities
- Both Painting the exterior brick and updating the landscaping — Enhances curb appeal and adds value to the home.
- Resale Upgrading the kitchen appliances — Modernizes the kitchen and makes it more appealing to potential buyers.
- Resale Updating the bathroom fixtures — Modernizes the bathroom and enhances the overall appeal of the home.
Renovation cost estimate screening
Value-add ROI direction
- Both Painting the exterior brick and updating the landscaping — Enhances curb appeal and adds value to the home. ↑
- Resale Upgrading the kitchen appliances — Modernizes the kitchen and makes it more appealing to potential buyers. ↑
- Resale Updating the bathroom fixtures — Modernizes the bathroom and enhances the overall appeal of the home. ↑
ⓘ Cost ranges are severity-bucket heuristics (US national rule-of-thumb). Get contractor quotes + a written scope before underwriting a rehab budget.
Schools (NCES district)
- District
- Marion ISD
- NCES district ID
- 4829100
- Math proficiency
- 44% ▼ -10.00%
- Reading proficiency
- 47% ▼ -4.00%
- Median HH income
- $58,465
- Composite
- 39.86/100
- National rank
- #3867
- State rank
- #243 of 826 in TX
Livability — Marion
- Score
- 66/100
- State rank
- #614
- US rank
- #11619
Category grades
Schools grade is shown separately in the Schools card above.
Census & demographics
- Census place
- Marion, TX
- Population (ZIP)
- 6,907
Population outlook (Guadalupe County) Hauer SSP2
- Today (2025)
- 196,854 people
- By 2030
- 220,210 · +11.9%
- By 2040
- 268,004 · +36.1%
- By 2050
- 316,333 · +60.7%
- By 2075
- 434,747 · +120.8%
- By 2100
- 520,447 · +164.4%
Race, ethnicity, and origin ACS 2023
- Neighborhood character
- Diverse neighborhood (Simpson 0.61)
- Race & ethnicity
- White 49% Hispanic / Latino 38% Two or more races 24% Black 6% Asian 2%
- Hispanic origin (detail)
- Mexican 35% Puerto Rican 1%
- Common ancestry
- Slovak 3% Romanian 2% Iranian 1%
- Foreign-born
- 7% · Canada, Jamaica
- Languages at home
- 80% English-only · Spanish 18% Tagalog/Filipino 1%
Political lean MEDSL · Guadalupe
- 2024 margin
- Strong R (+29.5) · D 34.8% · R 64.3%
- 2008→2024 swing
- +1.5pp toward D · 2008: -31.0pp · 2024: -29.5pp
- All cycles
- 2024: R+29.5 2020: R+24.2 2016: R+31.8 2012: R+35.1 2008: R+31.0
Not yet ingested
- Civics
- —
Market trends
- HPI YoY
- ▼ -126.83%
- Current HPI
- 189.5796
- Rent YoY
- —
- Metro
- —
- State GDP YoY
- ▲ 3.95%
- F500 in state
- 110
Industry mix (Fortune 500 HQ in TX)
| Industry | F500 HQs | Revenue |
|---|---|---|
| Energy | 16 | $1,198B |
|
||
| Technology | 5 | $198B |
|
||
| Engineering / Construction | 4 | $72B |
|
||
| Energy Services | 3 | $60B |
|
||
| Utilities | 3 | $41B |
|
||
| Healthcare | 2 | $330B |
|
||
Cash-flow waterfall
monthlySold comps — $/sqft
last 12 mo · ≤1 miLoading sold comps…