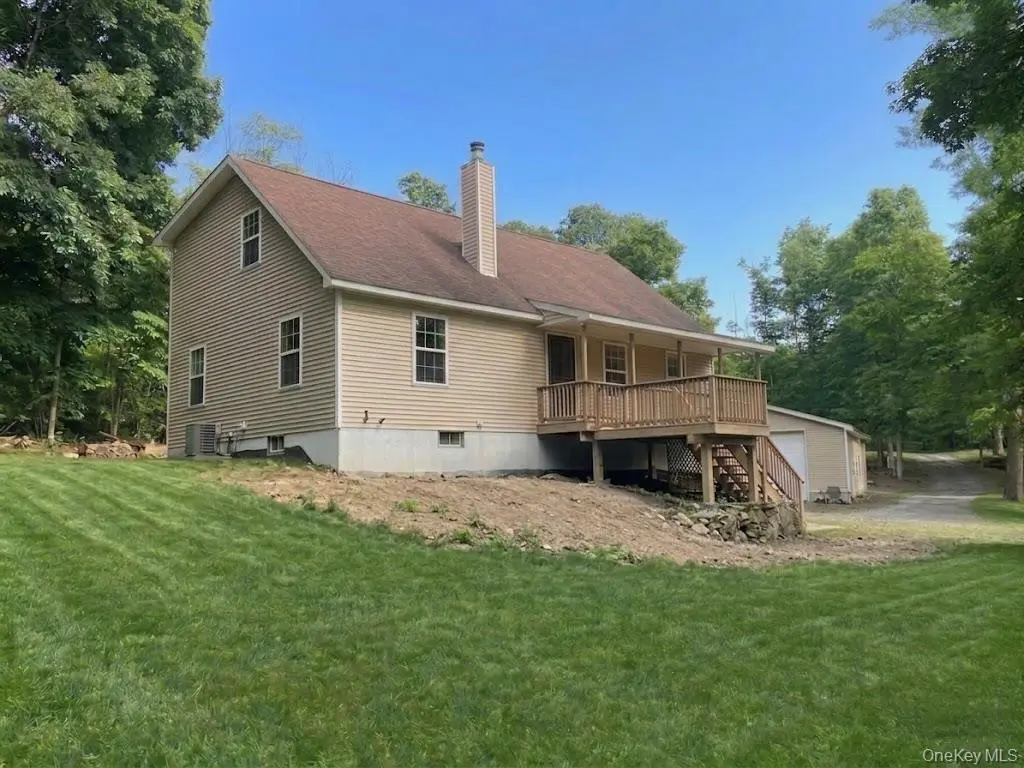
176 Downing Rd · Freedom Plains, NY
Flood risk 8/10 · Major
- FEMA flood zone
- X (unshaded)
- Chance of flooding over 30 yrs
- 0.99%
- Est. flood insurance / yr
- $473 – $860
Fire risk 5/10 · Moderate
- Est. fire insurance / yr
- $691 – $1,283
Heat risk 3/10 · Minor
- Hot days now (above 98°F)
- 7 days/yr
- Hot days in 30 yrs
- 15 days/yr
Wind risk 4/10 · Minor
- Chance of severe wind over 30 yrs
- 13.0%
Air-quality risk 3/10 · Minor
- Unhealthy air days now
- 2 days/yr
- Unhealthy air days in 30 yrs
- 3 days/yr
Risk factors via First Street. Map © Google.
Why this score? — see what drove the C- grade
The composite is a weighted blend of 9 inputs, each scored 0–100. Each bar is that input's sub-score; the figure is the points it added to the 100-point composite (weight × sub-score).
- Cash flow +18.5/30.0
- ARV discount +7.5/15.0
- Schools +6.3/10.0
- 1% rule +6.1/10.0
- DSCR +5.8/10.0
- Livability +3.2/5.0
- Rent growth +2.5/5.0
- Condition / age +2.5/5.0
- Appreciation +0.0/10.0
$495,000
🖨 Deal sheet 📄 Offer letter ✓ Due diligence
Listing remarks
The Ultimate Hudson Valley Retreat: Private Living Meets an Enthusiast’s Dream Escape to your own private, tree-lined sanctuary in Pleasant Valley. Tucked away in the highly desirable Arlington School District, this custom-built, 1.7-story residence offers the perfect blend of country living, efficiency, and unmatched mechanical utility. From the moment you arrive, the towering trees and serene surroundings establish a sense of total privacy. Inside, the home features 3 spacious bedrooms and 2 full baths, framed by striking A-frame commercial-grade windows that flood the main living spaces with beautiful natural light. Designed for total self-sufficiency and year-round comfort, the pr
Key facts
- A frame windows
- Tree lined sanctuary
- 2 acre lot
Tags
Property features AI
Exterior
- Parking: Attached and detached parking; Driveway; Garage with automatic door opener; 5 garage spaces
- Utilities: Septic tank; Cable available; Electricity available and connected
- Home design: Single family residence
- Construction: Vinyl siding construction; Concrete perimeter foundation
- Exterior features: Vinyl siding; Garage(s) and workshop present; Concrete perimeter foundation; Not waterfront
Interior
- Kitchen: Dishwasher; Electric range; Microwave
- Bedrooms: 6 total rooms (bedroom count not specified)
- Flooring: Carpet; Tile; Wood
- Bathrooms: 2 full bathrooms
- Heating & cooling: Central air conditioning; Baseboard heating; Hot air heating; Hot water heating; Wood heating
- Interior features: Central vacuum; High ceilings; Open floor plan; Unfinished walk-out basement
- Laundry & utility: Laundry located in hall
Neighborhood map
What this means for you Summary
Snapshot
- This is a 3-bed/2.5-bath single-family listed at $495k.
Deal economics
- At list price, monthly cash flow is $418 ($5k/yr) — positive.
- The deal already cash-flows at list — no discount required.
- Meets the 1% rule at list price ($6k rent vs $495k).
- Recommended offer: $488k (1.5% below list) — sets the bar for market timing.
- Cap rate 7.4% vs local median 3.4% in Freedom Plains — top-decile yield for the area; either an underpriced asset or a hidden risk that comps aren't pricing in. Stress-test before assuming the spread holds.
Location & tenants
- Location reads 65/100 on livability (#715 in NY) — a middle-class / working-renter tenant base. Watch: housing C-, crime F, amenities F.
- Arlington Central School District (suburban): math 77% / reading 65% proficiency, ranked #106 of 590 in NY (top 18%) — strong family-tenant draw, lease renewals of 3-5y typical; only 16% free/reduced lunch — higher-income household profile.
- Zoned schools: Overlook Primary School (402 students, 25% FRL); Lagrange Middle School (math 34% / reading 74%, grade B-, #214 of 729 statewide, top 31%, 865 students, 38% FRL); Arlington High School (math 95% / reading 58%, grade A-, #612 of 1,100 statewide, top 56%, 2,547 students, 26% FRL).
- Market conditions: 58 active listings in the ZIP; 1 comparable units currently listed for rent nearby; 620 units permitted in Dutchess County in 2024 (242 in 5+ unit buildings).
Forward outlook
- Local home prices are declining (-3.0%/yr); year-one equity from $3k of loan paydown is wiped out by about $15k of value loss. Plan a longer hold.
- Dutchess County population projected at -11% by 2050 — secular population decline; favor cash flow + early exit over multi-decade hold.
Negotiation context
- It's been on market 17 days — a 2% lower offer ($488k) is reasonable based on typical stale-listing flexibility.
- Current owner paid $20k; list at $495k implies a 2375% gain — meaningful room to come down on a strong offer.
Risks & watch-outs
- Watch-outs: property tax is 2.6% of price; flood insurance adds $56/mo.
- Climate carrying-cost: severe flood risk; moderate wildfire risk — expect insurance premiums to compound above CPI over the hold.
Questions for the listing agent
- Property tax is high relative to price — has the assessment been appealed recently, and will the sale trigger a re-assessment?
- What's the actual annual flood-insurance premium (NFIP or private), and is the property in a SFHA with mandatory coverage?
- Is there a deadline driving the sale (1031 exchange, divorce, estate, relocation)? That informs how much negotiation room exists.
- Schools are A-rated — typically a magnet for longer-tenancy family renters. What's the average tenant stay here, and is there a school-zone premium baked into asking?
- Crime grade is F in this area — have there been break-ins, vandalism, or insurance claims at this property in the last 3 years? What carrier currently insures it and at what premium?
- What's the average days-on-market for RENTAL listings here right now (not sales)? A rising rental-DOM trend means longer vacancies and softer asking-rent achievability than the comps imply.
- What's the recent tenant-quality profile in this submarket — average credit score on applications, eviction rate, late-payment / NSF rate, and stable-employment percentage? A property-management company in the area should have these aggregated.
- How much new for-sale + rental construction is in the pipeline within 1–3 miles? Heavy new supply typically softens prices + rents 12–24 months out; constrained supply supports both.
Investment metrics
- 1% rule
- 1.11% ✓
- Cap rate
- 7.44%
- Cash-on-cash
- 4.10%
- DSCR
- 1.18
- GRM
- 7.5
CMA / ARV
No comps found within radius.
Projected returns pro-forma
-3.0% appreciation · 3.0% rent growth · sell at horizon
- IRR
- -10.5%
- Equity multiple
- 0.62×
- Total profit
- $-53,187
- Equity at exit
- $73,806
- IRR
- -1.1%
- Equity multiple
- 0.92×
- Total profit
- $-10,422
- Equity at exit
- $42,799
Cash invested: $138,600 (down + closing). Projections, not guarantees.
Landlord ↔ Tenant lean methodology
- Overall (STATE)
- 15 Strongly Tenant-Friendly
- State New York
- 15 Strongly Tenant-Friendly · D+10
- County
- — inherits STATE
- City
- — inherits STATE
ZIP-level market 12569
- Home prices YoY
- -16.2%
- Active inventory
- 58
- Price-to-rent
- 7.5×
Monthly cashflow live
- Estimated rent
- $5,500 medium interval (Pro) →
- Mortgage (P&I)
- −$2,596
- Tax from tax record
- −$1,069 /mo · $12,831/yr
- Insurance
- −$206
- Flood insurance flood zone
- −$56 /mo · $666/yr
- HOA
- −$0
- Vacancy / Maint / Mgmt
- −$1,155
- Net cashflow
- $418
Break-even live
UW: 25.0% down · 7.5% · 30yr · 1.5% tax · 5.0% vac · 8.0% maint · 8.0% mgmt
Financing live
Cash to close
- Down payment
- $123,750
- Closing costs
- $14,850
- Reserves months
- —
- Total cash needed
- —
Loan-product check · same deal, 3 products live
Conventional
25% down · 7.5% · 30yr
- Down + closing
- —
- Monthly P&I
- —
- Monthly cashflow
- —
- DSCR
- —
- Eligible?
- —
Personal DTI + credit; lowest rate.
DSCR
20% down · 8.5% · 30yr
- Down + closing
- —
- Monthly P&I
- —
- Monthly cashflow
- —
- DSCR
- —
- Eligible?
- —
No personal income docs; deal must DSCR.
Hard money
10% down · 12.0% · 12mo
- Down + closing
- —
- Monthly P&I
- —
- Monthly cashflow
- —
- DSCR
- —
- Eligible?
- —
Short-term bridge; refi at stabilization.
Rent comps 1 comps
| Address | Beds | Baths | Sqft | Rent | $/sqft | DOM | Units | Dist |
|---|---|---|---|---|---|---|---|---|
| 272 Drake Rd Pleasant Valley, NY | 3.0 | 2.5 | 1709 | $5,500 | $3.22 | 23d | 1 | 1.08mi |
Listing history 13 events
-
2026-06-19price $495,000 Active 17 DOM
-
2026-06-18days on market $582,000 Active 17 DOM
-
2026-06-17days on market $582,000 Active 16 DOM
-
2026-06-16days on market $582,000 Active 15 DOM
-
2026-06-15days on market $582,000 Active 14 DOM
-
2026-06-14days on market $582,000 Active 12 DOM
-
2026-06-10days on market $582,000 Active 9 DOM
-
2026-06-09days on market $582,000 Active 8 DOM
-
2026-06-08days on market $582,000 Active 7 DOM
-
2026-06-07days on market $582,000 Active 6 DOM
-
2026-06-03days on market $582,000 Active 2 DOM
-
2026-06-01remarks 693-char remark
-
2026-06-01$582,000 Active 1 DOM
ⓘ Source: listings_history table (triggers on properties + properties_extension) + one-shot
backfill from property_details.listing_events for pre-trigger history.
Tax reassessment forecast NY · Partial reset (capped growth)
- Current annual tax
- $12,831 · $1,069/mo
- Projected year-2 tax
- $12,831 · $1,069/mo
- Expected delta
- $0/yr ($0/mo · 0.0%)
ⓘ Screening estimate from a state-policy table — verify with the county assessor before closing.
Climate risk First Street
- Flood 8/10 Severe FEMA zone X (unshaded) · 99% chance over 30 yrs
- Wildfire 5/10 Major
- Heat 3/10 Moderate 7 d/yr ≥98°F today · 15 d/yr by 30 yrs out
- Wind 4/10 Moderate 13% chance of damaging wind over 30 yrs
- Air quality 3/10 Moderate 2 unhealthy d/yr today · 3 by 30 yrs out
Nearby sold comps map
Loading sold comps map…
Walkable amenities ~0.75 mi
Loading nearby amenities…
Taxation est. · year 1
- Rental income
- $66,000
- − Mortgage interest
- −$27,728
- − Property taxes
- −$12,831
- − Insurance
- −$3,142
- − Repairs & maintenance
- −$5,280
- − Management
- −$5,280
- − Depreciation
- −$14,400
- Taxable loss
- −$2,660
- Est. tax savings @ 24.0%
- +$638
- After-tax cash flow
- $5,656/yr
For passive investors: Depreciation is non-cash, so a rental often shows a tax loss while cash-flowing — sheltering income. Rental losses are passive: they offset passive income freely, and up to $25,000/yr can offset ordinary (W-2) income if you actively participate and your MAGI is under $100k (phasing out to $0 by $150k); unused losses carry forward. On sale, claimed depreciation is recaptured at up to 25%, and gains may owe capital-gains tax (a 1031 exchange can defer both). Figures are a year-1 estimate at your 24.0% rate — not tax advice; consult a CPA.
Schools (NCES district)
- District
- Arlington Central School District
- NCES district ID
- 3603270
- Math proficiency
- 77% ▲ 19.00%
- Reading proficiency
- 65% ▲ 12.00%
- Median HH income
- $83,597
- Composite
- 63.47/100
- National rank
- #613
- State rank
- #106 of 590 in NY
Livability — Freedom Plains
- Score
- 65/100
- State rank
- #715
- US rank
- #13585
Category grades
Schools grade is shown separately in the Schools card above.
Census & demographics
- Population (ZIP)
- 9,766
Population outlook (Dutchess County) Hauer SSP2
- Today (2025)
- 291,768 people
- By 2030
- 287,131 · -1.6%
- By 2040
- 274,881 · -5.8%
- By 2050
- 259,971 · -10.9%
- By 2075
- 235,366 · -19.3%
- By 2100
- 208,786 · -28.4%
Race, ethnicity, and origin ACS 2023
- Neighborhood character
- Predominantly White (79%)
- Race & ethnicity
- White 79% Hispanic / Latino 12% Two or more races 9% Black 3% Asian 1%
- Hispanic origin (detail)
- Mexican 2% Puerto Rican 3% Cuban 1%
- Common ancestry
- Romanian 5% Lithuanian 3% Iranian 3%
- Foreign-born
- 7% · Canada, China, Jamaica
- Languages at home
- 91% English-only · Spanish 4% Russian/Polish/Slavic 2% Chinese 1%
Political lean MEDSL · Dutchess
- 2024 margin
- Lean D (+5.4) · D 52.7% · R 47.3%
- 2008→2024 swing
- -3.2pp toward R · 2008: 8.6pp · 2024: 5.4pp
- All cycles
- 2024: D+5.4 2020: D+9.6 2016: R+1.1 2012: D+6.6 2008: D+8.6
Not yet ingested
- Civics
- —
Market trends
- HPI YoY
- ▼ -46.72%
- Current HPI
- 240.7838
- Rent YoY
- —
- Metro
- —
- State GDP YoY
- ▲ 2.60%
- F500 in state
- 92
Industry mix (Fortune 500 HQ in NY)
| Industry | F500 HQs | Revenue |
|---|---|---|
| Financial Services | 10 | $950B |
|
||
| Consumer Goods | 9 | $162B |
|
||
| Insurance | 4 | $225B |
|
||
| Telecommunications | 2 | $144B |
|
||
| Pharmaceuticals | 2 | $112B |
|
||
| Media / Entertainment | 2 | $69B |
|
||
Price history
+2810.0% since first listed2 events — show timeline
- 2026-05-29 Listed $582,000 OneKey® MLS as Distributed by MLS Grid
- 1996-11-26 Sold (Public Records) $20,000 Public Records
Property tax history
+4.5%/yrLatest (2025): $12,831 · +6.2% YoY. Source: county tax records.
Cash-flow waterfall
monthlySold comps — $/sqft
last 12 mo · ≤1 miLoading sold comps…