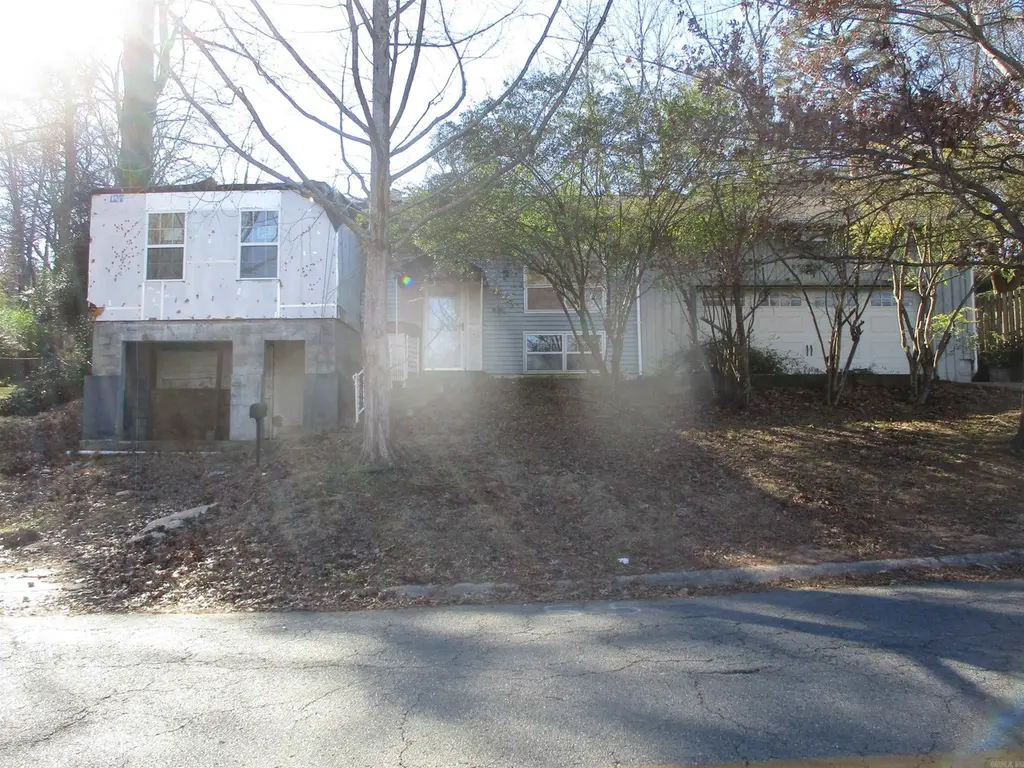
57 White Oak Ln · Little Rock, AR
Flood risk 1/10 · Minimal
- FEMA flood zone
- X (unshaded)
- Chance of flooding over 30 yrs
- 0.0%
- Est. flood insurance / yr
- $473 – $860
Fire risk 1/10 · Minimal
- Est. fire insurance / yr
- $1,499 – $2,785
Heat risk 7/10 · Major
- Hot days now (above 110°F)
- 7 days/yr
- Hot days in 30 yrs
- 19 days/yr
Wind risk 4/10 · Minor
- Chance of severe wind over 30 yrs
- 10.0%
Air-quality risk 2/10 · Minimal
- Unhealthy air days now
- 0 days/yr
- Unhealthy air days in 30 yrs
- 1 days/yr
Risk factors via First Street. Map © Google.
Why this score? — see what drove the B- grade
The composite is a weighted blend of 9 inputs, each scored 0–100. Each bar is that input's sub-score; the figure is the points it added to the 100-point composite (weight × sub-score).
- Cash flow +30.0/30.0
- 1% rule +10.0/10.0
- DSCR +10.0/10.0
- ARV discount +7.5/15.0
- Rent growth +3.7/5.0
- Livability +3.7/5.0
- Condition / age +2.5/5.0
- Schools +2.1/10.0
- Appreciation +0.0/10.0
$85,000
🖨 Deal sheet 📄 Offer letter ✓ Due diligence
Listing remarks MLS
Agents, a Hold Harmless Agreement must be signed by buyers and agents before they can enter this property. Hold Harmless Agreement is located in the associated docs. House has been added on to so sq. footage is not accurate. This spacious 3 bedroom 3 bath home is located in the heart of of Little Rock close to parks and shopping. With a little elbow grease this home could really shine. This is a Fannie Mae HomePath property so agents, see agent remarks on where and how to present offers.
Key facts
- Large bonus rooms
- Close to parks
- Covered parking
Tags
Neighborhood map
What this means for you Summary
Snapshot
- This is a 3-bed/2.0-bath single-family listed at $85k.
Deal economics
- At list price, monthly cash flow is $417 ($5k/yr) — positive.
- The deal already cash-flows at list — no discount required.
- Meets the 1% rule at list price ($1k rent vs $85k).
- Recommended offer: $82k (3.0% below list) — sets the bar for market timing.
- Cap rate 12.2% vs local median 4.1% in Little Rock — top-decile yield for the area; either an underpriced asset or a hidden risk that comps aren't pricing in. Stress-test before assuming the spread holds.
Location & tenants
- Location reads 73/100 on livability (#22 in AR) — a middle-class / working-renter tenant base. Strengths: commute A+, cost of living A+, housing A+; Watch: crime F.
- Little Rock School District (urban): math 23% / reading 26% proficiency, ranked #183 of 238 in AR (top 77%) — low school quality limits family demand, transient renter base, plan for 1-2y turnover; 69% free/reduced lunch — lower-income household profile, screen leases tightly.
- Market conditions: Rents rising fast (+4.8%/yr); 46 active listings in the ZIP; 34 comparable units currently listed for rent nearby; rentals at typical pace (median 24d on market — plan ~3-4 weeks tenant-placement turnaround); 1,006 units permitted in Pulaski County in 2024 (0 in 5+ unit buildings).
Forward outlook
- Local home prices are declining (-3.0%/yr); year-one equity from $588 of loan paydown is wiped out by about $3k of value loss. Plan a longer hold.
- Pulaski County population projected at +6% by 2050 — modest demand growth; plan on rents tracking national, not racing it.
- At projected returns (-3.0% appreciation + 4.8% rent growth), your $24k cash investment doubles in ~6 years — after that, you're playing with house money.
Negotiation context
- It's been on market 50 days — a 3% lower offer ($82k) is reasonable based on typical stale-listing flexibility.
Risks & watch-outs
- Watch-outs: property tax is 2.6% of price.
- Climate carrying-cost: extreme-heat days projected 7→19/yr by 2055 (HVAC capex compounding) — expect insurance premiums to compound above CPI over the hold.
Questions for the listing agent
- It's been on market 50 days. Have you received any prior offers? Is the seller open to a 3% concession, seller financing, or rate buy-down credit?
- Built in 1963 — when were the roof, HVAC, electrical panel, plumbing, and water heater last replaced?
- Property tax is high relative to price — has the assessment been appealed recently, and will the sale trigger a re-assessment?
- Is there a deadline driving the sale (1031 exchange, divorce, estate, relocation)? That informs how much negotiation room exists.
- Crime grade is F in this area — have there been break-ins, vandalism, or insurance claims at this property in the last 3 years? What carrier currently insures it and at what premium?
- What's the average days-on-market for RENTAL listings here right now (not sales)? A rising rental-DOM trend means longer vacancies and softer asking-rent achievability than the comps imply.
- What's the recent tenant-quality profile in this submarket — average credit score on applications, eviction rate, late-payment / NSF rate, and stable-employment percentage? A property-management company in the area should have these aggregated.
- How much new for-sale + rental construction is in the pipeline within 1–3 miles? Heavy new supply typically softens prices + rents 12–24 months out; constrained supply supports both.
Investment metrics
- 1% rule
- 1.61% ✓
- Cap rate
- 12.18%
- Cash-on-cash
- 21.04%
- DSCR
- 1.94
- GRM
- 5.2
CMA / ARV
- ARV (median comp)
- $245,382
- List price
- $85,000
- Delta
- -65.36%
- Verdict
- UNDERPRICED
- Comps
- 20 within 1.0 mi
Show comp detail 12 sales within ~0.75 mi
| Address | Dist | Beds/Ba | Sqft | Sold | Price | $/sf | Match |
|---|---|---|---|---|---|---|---|
| 105 White Oak Ln Ln | 0.16mi | 3/2.0 | 1,256 (-7%) | 2mo | $252,800 | $201 | 80 |
| 2224 Biscayne | 0.14mi | 3/1.0 | 1,286 (-5%) | 4mo | $210,000 | $163 | 79 |
| 5 Delray Dr | 0.20mi | 3/1.5 | 1,205 (-11%) | 3mo | $155,000 | $129 | 69 |
| 6 White Oak Cir | 0.05mi | 3/1.5 | 1,544 (+14%) | 4mo | $266,000 | $172 | 68 |
| 2 White Oak Ln | 0.21mi | 3/2.0 | 1,520 (+13%) | 5mo | $335,000 | $220 | 65 |
| 2408 Blackwood Rd | 0.53mi | 3/1.5 | 1,224 (-9%) | 2mo | $195,000 | $159 | 56 |
| 6721 Kenwood Rd | 0.72mi | 2/1.0 (-1) | 1,414 (+5%) | 0mo | $215,000 | $152 | 49 |
| 7520 M St | 0.72mi | 3/2.0 | 1,456 (+8%) | 6mo | $185,000 | $127 | 48 |
| 2816 Crouchwood Rd | 0.66mi | 3/1.0 | 1,222 (-9%) | 2mo | $230,000 | $188 | 48 |
| 2924 Circlewood | 0.53mi | 3/1.5 | 1,543 (+14%) | 2mo | $290,000 | $188 | 48 |
| 2901 Dalewood Rd | 0.48mi | 3/1.5 | 1,152 (-14%) | 6mo | $290,000 | $252 | 47 |
| 6716 Kenwood Rd Rd | 0.74mi | 3/3.0 | 1,504 (+12%) | 4mo | $280,000 | $186 | 39 |
Match score weights: distance 35% · size 25% · config 20% · recency 20%. Top-matched comps best support the ARV.
Projected returns pro-forma
-3.0% appreciation · 4.84% rent growth · sell at horizon
- IRR
- 15.7%
- Equity multiple
- 1.65×
- Total profit
- $15,441
- Equity at exit
- $12,674
- IRR
- 25.8%
- Equity multiple
- 3.48×
- Total profit
- $58,906
- Equity at exit
- $7,349
Cash invested: $23,800 (down + closing). Projections, not guarantees.
Landlord ↔ Tenant lean methodology
- Overall (STATE)
- 92 Strongly Landlord-Friendly
- State Arkansas
- 92 Strongly Landlord-Friendly · R+14
- County
- — inherits STATE
- City
- — inherits STATE
ZIP-level market 72227
- Rents YoY
- 4.8%
- Active inventory
- 46
- Price-to-rent
- 5.2×
Monthly cashflow live
- Estimated rent
- $1,366 high interval (Pro) →
- Mortgage (P&I)
- −$446
- Tax from tax record
- −$181 /mo · $2,171/yr
- Insurance
- −$35
- HOA
- −$0
- Vacancy / Maint / Mgmt
- −$287
- Net cashflow
- $417
Break-even live
UW: 25.0% down · 7.5% · 30yr · 1.5% tax · 5.0% vac · 8.0% maint · 8.0% mgmt
Financing live
Cash to close
- Down payment
- $21,250
- Closing costs
- $2,550
- Reserves months
- —
- Total cash needed
- —
Loan-product check · same deal, 3 products live
Conventional
25% down · 7.5% · 30yr
- Down + closing
- —
- Monthly P&I
- —
- Monthly cashflow
- —
- DSCR
- —
- Eligible?
- —
Personal DTI + credit; lowest rate.
DSCR
20% down · 8.5% · 30yr
- Down + closing
- —
- Monthly P&I
- —
- Monthly cashflow
- —
- DSCR
- —
- Eligible?
- —
No personal income docs; deal must DSCR.
Hard money
10% down · 12.0% · 12mo
- Down + closing
- —
- Monthly P&I
- —
- Monthly cashflow
- —
- DSCR
- —
- Eligible?
- —
Short-term bridge; refi at stabilization.
Rent comps 34 comps
| Address | Beds | Baths | Sqft | Rent | $/sqft | DOM | Units | Dist |
|---|---|---|---|---|---|---|---|---|
| 91 White Oak Ln Little Rock, AR | 3.0 | 1.5 | 1118 | $1,490 | $1.33 | 43d | 1 | 0.12mi |
| 8101 Cantrell Rd Little Rock, AR | 1.0–3.0 | 1.0–2.0 | 1055 | $1,649 | $1.56 | 14d | 20 | 0.25mi |
| 2824 Foxcroft Rd Little Rock, AR | 2.0 | 2.0 | 1435 | $1,500 | $1.05 | 23d | 1 | 0.25mi |
| 225 Keightley Dr Little Rock, AR | 2.0 | 2.0 | 930 | $1,100 | $1.18 | 43d | 1 | 0.26mi |
| 8110 Alvin Ln Little Rock, AR | 3.0 | 2.0 | 1500 | $1,595 | $1.06 | 14d | 1 | 0.38mi |
| 7575 Cantrell Rd Little Rock, AR | 1.0–3.0 | 1.0–2.5 | 907 | $1,050 | $1.16 | 14d | 8 | 0.41mi |
| 2308 Blackwood Rd Little Rock, AR | 2.0 | 2.5 | 1375 | $1,250 | $0.91 | 23d | 1 | 0.52mi |
| 7701 Illinois St Little Rock, AR | 3.0 | 1.0 | 1000 | $1,450 | $1.45 | 43d | 1 | 0.54mi |
| 7420 Illinois St Little Rock, AR | 3.0 | 1.0 | 1275 | $1,495 | $1.17 | 23d | 1 | 0.55mi |
| 6838 Cantrell Rd Little Rock, AR | 1.0–2.0 | 1.0–1.5 | 777 | $890 | $1.14 | 14d | 3 | 0.62mi |
| 7111 Indiana Ave Little Rock, AR | 2.0 | 2.0 | 980 | $882 | $0.90 | 14d | 9 | 0.64mi |
| 7318 L St Little Rock, AR | 3.0 | 2.0 | 1396 | $1,595 | $1.14 | 23d | 1 | 0.81mi |
| 1924 Pine Valley Rd Little Rock, AR | 3.0 | 2.0 | 1114 | $2,100 | $1.89 | 43d | 1 | 0.82mi |
| 1809 Reservoir Rd #19 Little Rock, AR | 2.0 | 1.5 | 1122 | $1,095 | $0.98 | 21d | 1 | 0.96mi |
| 4 Sunset Hl Little Rock, AR | 4.0 | 2.5 | 1826 | $2,295 | $1.26 | 43d | 1 | 0.97mi |
| 1014 N Coolidge St Little Rock, AR | 3.0 | 2.0 | 1163 | $1,478 | $1.27 | 23d | 1 | 1.07mi |
| 1812 Reservoir Rd Little Rock, AR | 1.0–3.0 | 1.0–2.0 | 973 | $1,110 | $1.14 | 14d | 17 | 1.10mi |
| 51 Wolfbridge Lop Little Rock, AR | 3.0 | 3.0 | 1497 | $1,700 | $1.14 | 21d | 1 | 1.14mi |
| 9324 Northedge Rd Little Rock, AR | 3.0 | 2.0 | 1435 | $1,600 | $1.11 | 43d | 1 | 1.15mi |
| 1901 Sanford Dr Little Rock, AR | 2.0 | 1.5 | 976 | $975 | $1.00 | 23d | 1 | 1.16mi |
| 2018 Sanford Dr Unit 07 Little Rock, AR | 2.0 | 1.0 | 950 | $775 | $0.82 | 43d | 1 | 1.16mi |
| 1821 Sanford Dr Little Rock, AR | 2.0 | 1.5 | 976 | $925 | $0.95 | 23d | 1 | 1.16mi |
| 1813 Sanford Dr Little Rock, AR | 2.0 | 1.0 | 1056 | $1,100 | $1.04 | 23d | 1 | 1.17mi |
| 1807 Sanford Dr Little Rock, AR | 2.0 | 1.0 | 1056 | $1,200 | $1.14 | 23d | 1 | 1.17mi |
| 1807 Sanford Dr #3 Little Rock, AR | 2.0 | 1.0 | 1056 | $1,100 | $1.04 | 23d | 1 | 1.18mi |
| 1912 Sanford Dr Unit 2 Little Rock, AR | 2.0 | 1.5 | 1100 | $1,500 | $1.36 | 43d | 1 | 1.19mi |
| 1912 Sanford Dr Little Rock, AR | 2.0 | 1.5 | 1100 | $1,475 | $1.34 | 21d | 1 | 1.19mi |
| 1820 Sanford Dr Unit 4 Little Rock, AR | 2.0 | 1.5 | 1170 | $1,300 | $1.11 | 23d | 1 | 1.20mi |
| 1812 Sanford Dr Little Rock, AR | 2.0 | 1.0 | 961 | $995 | $1.04 | 43d | 1 | 1.21mi |
| 1812 Sanford Dr Little Rock, AR | 2.0 | 1.0 | 961 | $995 | $1.04 | 19d | 1 | 1.21mi |
| 8 Towne Park Ct #10 Little Rock, AR | 2.0 | 2.0 | 1061 | $975 | $0.92 | 43d | 1 | 1.35mi |
| 1400 Old Forge Dr Little Rock, AR | 1.0–3.0 | 1.0–2.5 | 995 | $1,260 | $1.27 | 21d | 16 | 1.46mi |
| 8120 W Markham St Unit 2 Little Rock, AR | 2.0 | 1.5 | 950 | $950 | $1.00 | 23d | 1 | 1.49mi |
| 8120 W Markham St Unit 2 Little Rock, AR | 2.0 | 1.5 | 1000 | $950 | $0.95 | 43d | 1 | 1.49mi |
Listing history 9 events
-
2026-06-08statusdays on market $85,000 Under Contract 50 DOM
-
2026-06-05days on market $85,000 Active 49 DOM
-
2026-06-03days on market $85,000 Active 48 DOM
-
2026-06-02days on market $85,000 Active 47 DOM
-
2026-06-01days on market $85,000 Active 46 DOM
-
2026-05-31days on market $85,000 Active 45 DOM
-
2026-05-31days on market $85,000 Active 44 DOM
-
2026-04-16$90,000 New Listing 492-char remark
Show marketing remark (492 chars)
Agents, a Hold Harmless Agreement must be signed by buyers and agents before they can enter this property. Hold Harmless Agreement is located in the associated docs. House has been added on to so sq. footage is not accurate. This spacious 3 bedroom 3 bath home is located in the heart of of Little Rock close to parks and shopping. With a little elbow grease this home could really shine. This is a Fannie Mae HomePath property so agents, see agent remarks on where and how to present offers.
-
2003-06-12soldstatus $135,000
ⓘ Source: listings_history table (triggers on properties + properties_extension) + one-shot
backfill from property_details.listing_events for pre-trigger history.
Tax reassessment forecast AR · Resets to sale price
- Current annual tax
- $2,171 · $181/mo
- Projected year-2 tax
- $2,171 · $181/mo
- Expected delta
- $0/yr ($0/mo · 0.0%)
ⓘ Screening estimate from a state-policy table — verify with the county assessor before closing.
Climate risk First Street
- Flood 1/10 Low FEMA zone X (unshaded) · 0% chance over 30 yrs
- Wildfire 1/10 Low
- Heat 7/10 Severe 7 d/yr ≥110°F today · 19 d/yr by 30 yrs out
- Wind 4/10 Moderate 10% chance of damaging wind over 30 yrs
- Air quality 2/10 Low 0 unhealthy d/yr today · 1 by 30 yrs out
Nearby sold comps map
Loading sold comps map…
Walkable amenities ~0.75 mi
Loading nearby amenities…
Taxation est. · year 1
- Rental income
- $16,395
- − Mortgage interest
- −$4,761
- − Property taxes
- −$2,171
- − Insurance
- −$425
- − Repairs & maintenance
- −$1,312
- − Management
- −$1,312
- − Depreciation
- −$2,473
- Taxable income
- $3,941
- Est. tax owed @ 24.0%
- −$946
- After-tax cash flow
- $4,061/yr
For passive investors: Depreciation is non-cash, so a rental often shows a tax loss while cash-flowing — sheltering income. Rental losses are passive: they offset passive income freely, and up to $25,000/yr can offset ordinary (W-2) income if you actively participate and your MAGI is under $100k (phasing out to $0 by $150k); unused losses carry forward. On sale, claimed depreciation is recaptured at up to 25%, and gains may owe capital-gains tax (a 1031 exchange can defer both). Figures are a year-1 estimate at your 24.0% rate — not tax advice; consult a CPA.
Schools (NCES district)
- District
- Little Rock School District
- NCES district ID
- 0509000
- Math proficiency
- 23% ▼ -12.00%
- Reading proficiency
- 26% ▼ -8.00%
- Median HH income
- $43,346
- Composite
- 21.0/100
- National rank
- #8457
- State rank
- #183 of 238 in AR
Livability — Little Rock
- Score
- 73/100
- State rank
- #22
- US rank
- #5295
Category grades
Schools grade is shown separately in the Schools card above.
Census & demographics
- Census place
- Little Rock, AR
- County
- Pulaski County · 372,764 people
- City population
- 218,896
- Metro
- Little Rock-North Little Rock-Conway, AR
- Population (ZIP)
- 11,284
- Household income
- $73,879
- Rent vs Own
- Severe rent burden
- 488.0
Population outlook (Pulaski County) Hauer SSP2
- Today (2025)
- 415,378 people
- By 2030
- 423,720 · +2.0%
- By 2040
- 435,182 · +4.8%
- By 2050
- 440,904 · +6.1%
- By 2075
- 445,521 · +7.3%
- By 2100
- 419,173 · +0.9%
Race, ethnicity, and origin ACS 2023
- Neighborhood character
- Majority White (62%)
- Race & ethnicity
- White 62% Black 26% Two or more races 7% Hispanic / Latino 5%
- Common ancestry
- Slovak 4% Italian 3% Serbian 2%
- Foreign-born
- 4% · Canada
- Languages at home
- 95% English-only · Spanish 3%
Political lean MEDSL · Pulaski
- 2024 margin
- Strong D (+22.1) · D 59.8% · R 37.7% · Other 2.5%
- 2008→2024 swing
- +10.6pp toward D · 2008: 11.6pp · 2024: 22.1pp
- All cycles
- 2024: D+22.1 2020: D+22.5 2016: D+17.9 2012: D+11.4 2008: D+11.6
Not yet ingested
- Civics
- —
Market trends
- HPI YoY
- ▼ -176.00%
- Current HPI
- 194.5483
- Rent YoY
- ▲ 4.84%
- Metro
- Little Rock-North Little Rock-Conway, AR
- State GDP YoY
- ▲ 3.80%
- F500 in state
- 10
Industry mix (Fortune 500 HQ in AR)
| Industry | F500 HQs | Revenue |
|---|---|---|
| Retail | 1 | $681B |
|
||
| Food / Agriculture | 1 | $53B |
|
||
| Retail / Energy | 1 | $22B |
|
||
| Transportation / Logistics | 1 | $12B |
|
||
| Energy | 1 | $4B |
|
||
Price history
-33.3% since first listed2 events — show timeline
- 2026-04-16 Listed $90,000 CARMLS
- 2003-06-12 Sold (Public Records) $135,000 Public Records
Property tax history
+1.0%/yrLatest (2025): $2,171 · +0.0% YoY. Source: county tax records.
Cash-flow waterfall
monthlySold comps — $/sqft
last 12 mo · ≤1 miLoading sold comps…