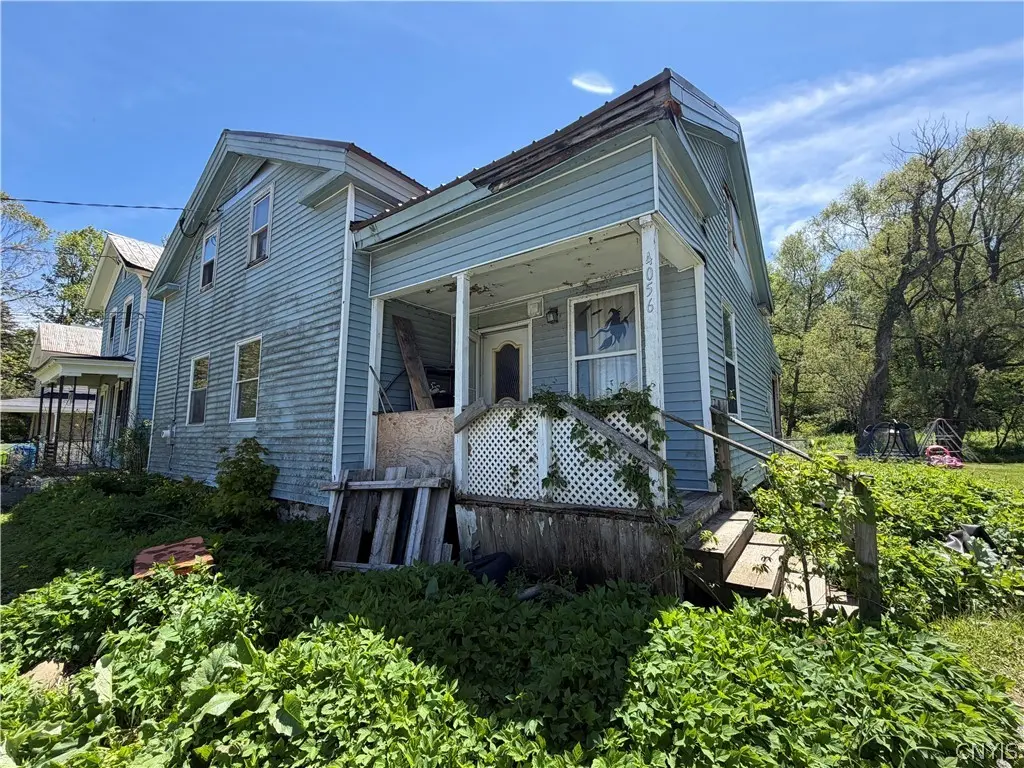
4056 State Route 26 · Hamilton, NY
Flood risk 6/10 · Moderate
- FEMA flood zone
- X
- Chance of flooding over 30 yrs
- 0.71%
- Est. flood insurance / yr
- $473 – $860
Fire risk 1/10 · Minimal
- Est. fire insurance / yr
- $691 – $1,283
Heat risk 2/10 · Minimal
- Hot days now (above 93°F)
- 7 days/yr
- Hot days in 30 yrs
- 16 days/yr
Wind risk 2/10 · Minimal
- Chance of severe wind over 30 yrs
- 1.0%
Air-quality risk 1/10 · Minimal
- Unhealthy air days now
- 0 days/yr
- Unhealthy air days in 30 yrs
- 0 days/yr
Risk factors via First Street. Map © Google.
Why this score? — see what drove the B+ grade
The composite is a weighted blend of 9 inputs, each scored 0–100. Each bar is that input's sub-score; the figure is the points it added to the 100-point composite (weight × sub-score).
- Cash flow +30.0/30.0
- 1% rule +10.0/10.0
- DSCR +10.0/10.0
- Appreciation +7.6/10.0
- ARV discount +7.5/15.0
- Schools +5.6/10.0
- Livability +3.6/5.0
- Rent growth +2.5/5.0
- Condition / age +2.5/5.0
$35,000
🖨 Deal sheet (PDF) 📄 Offer letter ✓ Due diligence
Listing remarks
Opportunity awaits with this 3-bedroom, 1 full bathroom home offering endless potential for the right buyer or investor. This property is being sold as-is, making it an ideal project for investors, flippers, or buyers looking to bring their vision to life. With a functional layout and solid potential, this home could be transformed into a great rental property, resale opportunity, or affordable primary residence. Priced to reflect the work needed, this is your chance to invest in a property with upside potential. Bring your tools, ideas, and creativity — the possibilities are here!
Key facts
- 9,147 sq ft lot
- Built 1901
- Listed 20 days
Property features AI
Exterior
- Parking: No garage
- Utilities: Electricity available; High-speed internet available; Septic tank; Well water
- Home design: 2-story home; Resale property; Metal roof
- Construction: Vinyl siding; PEX plumbing; Block and stone foundation; Existing construction
- Exterior features: Covered porch; Gravel driveway; Rectangular lot (48 x 196) on a main thoroughfare
Interior
- Kitchen: Dishwasher; Refrigerator
- Flooring: Laminate; Varied flooring
- Bathrooms: 1 full bathroom (main level)
- Heating & cooling: Forced air heating; Oil heating (see remarks)
- Interior features: Eat-in kitchen; Separate/formal living room; Full basement with sump pump
- Laundry & utility: Main-level laundry; Electric and oil water heaters
Neighborhood map
What this means for you Summary
Snapshot
- This is a 3-bed/1.0-bath single-family listed at $35k.
Deal economics
- At list price, monthly cash flow is $563 ($7k/yr) — positive.
- The deal already cash-flows at list — no discount required.
- Meets the 1% rule at list price ($1k rent vs $35k).
- Recommended offer: $34k (1.5% below list) — sets the bar for market timing.
- Cap rate 25.6% vs local median 1.3% in Hamilton — top-decile yield for the area; either an underpriced asset or a hidden risk that comps aren't pricing in. Stress-test before assuming the spread holds.
Location & tenants
- Location reads 72/100 on livability (#361 in NY) — a middle-class / working-renter tenant base. Strengths: health & safety A+, schools B+, crime B+; Watch: amenities F, commute F.
- Morrisville-Eaton Central School District (rural): math 59% / reading 72% proficiency, ranked #177 of 590 in NY (top 30%) — acceptable for families but not a draw, mixed tenant base, ~2y average lease.
- Market conditions: 9 active listings in the ZIP; 137 units permitted in Madison County in 2024 (46 in 5+ unit buildings).
Forward outlook
- In year one you build about $2k of equity ($242 loan paydown + $2k appreciation (5.2% local appreciation)).
- Madison County population projected at -24% by 2050 — secular population decline; favor cash flow + early exit over multi-decade hold.
- At projected returns (5.2% appreciation + 3.0% rent growth), your $10k cash investment doubles in ~2 years — after that, you're playing with house money.
Negotiation context
- It's been on market 20 days — a 2% lower offer ($34k) is reasonable based on typical stale-listing flexibility.
Risks & watch-outs
- Watch-outs: property tax is 3.7% of price; built in 1901 — expect roof / HVAC / electrical / plumbing capex.
- Climate carrying-cost: major flood risk — expect insurance premiums to compound above CPI over the hold.
Questions for the listing agent
- Built in 1901 — when were the roof, HVAC, electrical panel, plumbing, and water heater last replaced?
- Property tax is high relative to price — has the assessment been appealed recently, and will the sale trigger a re-assessment?
- Is there a deadline driving the sale (1031 exchange, divorce, estate, relocation)? That informs how much negotiation room exists.
- Schools are B-rated — typically a magnet for longer-tenancy family renters. What's the average tenant stay here, and is there a school-zone premium baked into asking?
- What's the average days-on-market for RENTAL listings here right now (not sales)? A rising rental-DOM trend means longer vacancies and softer asking-rent achievability than the comps imply.
- What's the recent tenant-quality profile in this submarket — average credit score on applications, eviction rate, late-payment / NSF rate, and stable-employment percentage? A property-management company in the area should have these aggregated.
- How much new for-sale + rental construction is in the pipeline within 1–3 miles? Heavy new supply typically softens prices + rents 12–24 months out; constrained supply supports both.
Investment metrics
- 1% rule
- 3.14% ✓
- Cap rate
- 25.60%
- Cash-on-cash
- 68.97%
- DSCR
- 4.07
- GRM
- 2.7
CMA / ARV
No comps found within radius.
Projected returns pro-forma
5.24% appreciation · 3.0% rent growth · sell at horizon
- IRR
- 75.7%
- Equity multiple
- 5.54×
- Total profit
- $44,467
- Equity at exit
- $20,336
- IRR
- 73.5%
- Equity multiple
- 11.54×
- Total profit
- $103,307
- Equity at exit
- $35,519
Cash invested: $9,800 (down + closing). Projections, not guarantees.
Landlord ↔ Tenant lean methodology
- Overall (STATE)
- 15 Strongly Tenant-Friendly
- State New York
- 15 Strongly Tenant-Friendly · D+10
- County
- — inherits STATE
- City
- — inherits STATE
ZIP-level market 13334
- Home prices YoY
- 1.9%
- Active inventory
- 9
- Price-to-rent
- 2.7×
Monthly cashflow live
- Estimated rent
- $1,099 medium interval (Pro) →
- Mortgage (P&I)
- −$184
- Tax from tax record
- −$107 /mo · $1,278/yr
- Insurance
- −$15
- HOA
- −$0
- Vacancy / Maint / Mgmt
- −$231
- Net cashflow
- $563
Break-even live
Sensitivity live
| Price | -10% $583 | -5% $573 | +0% $563 | +5% $553 | +10% $543 |
|---|---|---|---|---|---|
| Rent | -10% $476 | -5% $520 | +0% $563 | +5% $607 | +10% $650 |
| Rate | -1.0pp $581 | -0.5pp $572 | base $563 | +0.5pp $554 | +1.0pp $545 |
UW: 25.0% down · 7.5% · 30yr · 1.5% tax · 5.0% vac · 8.0% maint · 8.0% mgmt
Financing live
Cash to close
- Down payment
- $8,750
- Closing costs
- $1,050
- Reserves months
- —
- Total cash needed
- —
Loan-product check · same deal, 3 products live
Conventional
25% down · 7.5% · 30yr
- Down + closing
- —
- Monthly P&I
- —
- Monthly cashflow
- —
- DSCR
- —
- Eligible?
- —
Personal DTI + credit; lowest rate.
DSCR
20% down · 8.5% · 30yr
- Down + closing
- —
- Monthly P&I
- —
- Monthly cashflow
- —
- DSCR
- —
- Eligible?
- —
No personal income docs; deal must DSCR.
Hard money
10% down · 12.0% · 12mo
- Down + closing
- —
- Monthly P&I
- —
- Monthly cashflow
- —
- DSCR
- —
- Eligible?
- —
Short-term bridge; refi at stabilization.
Listing history 15 events
-
2026-06-18status $35,000 Pending 20 DOM
-
2026-06-17days on market $35,000 Active 20 DOM
-
2026-06-16days on market $35,000 Active 19 DOM
-
2026-06-15days on market $35,000 Active 18 DOM
-
2026-06-13days on market $35,000 Active 16 DOM
-
2026-06-12days on market $35,000 Active 15 DOM
-
2026-06-09days on market $35,000 Active 12 DOM
-
2026-06-08days on market $35,000 Active 11 DOM
-
2026-06-07days on market $35,000 Active 10 DOM
-
2026-06-07pricedays on market $35,000 Active 9 DOM
-
2026-06-04days on market $45,000 Active 6 DOM
-
2026-06-02days on market $45,000 Active 5 DOM
-
2026-06-01days on market $45,000 Active 4 DOM
-
2026-05-31days on market $45,000 Active 3 DOM
-
2026-05-28$45,000 Active
ⓘ Source: listings_history table (triggers on properties + properties_extension) + one-shot
backfill from property_details.listing_events for pre-trigger history.
Tax reassessment forecast NY · Partial reset (capped growth)
- Current annual tax
- $1,278 · $107/mo
- Projected year-2 tax
- $1,278 · $107/mo
- Expected delta
- $0/yr ($0/mo · 0.0%)
ⓘ Screening estimate from a state-policy table — verify with the county assessor before closing.
Climate risk First Street
- Flood 6/10 Major FEMA zone X · 71% chance over 30 yrs
- Wildfire 1/10 Low
- Heat 2/10 Low 7 d/yr ≥93°F today · 16 d/yr by 30 yrs out
- Wind 2/10 Low 100% chance of damaging wind over 30 yrs
- Air quality 1/10 Low 0 unhealthy d/yr today · 0 by 30 yrs out
Nearby sold comps map
Loading sold comps map…
Walkable amenities ~0.75 mi
Loading nearby amenities…
Taxation est. · year 1
- Rental income
- $13,183
- − Mortgage interest
- −$1,961
- − Property taxes
- −$1,278
- − Insurance
- −$175
- − Repairs & maintenance
- −$1,055
- − Management
- −$1,055
- − Depreciation
- −$1,018
- Taxable income
- $6,642
- Est. tax owed @ 24.0%
- −$1,594
- After-tax cash flow
- $5,165/yr
For passive investors: Depreciation is non-cash, so a rental often shows a tax loss while cash-flowing — sheltering income. Rental losses are passive: they offset passive income freely, and up to $25,000/yr can offset ordinary (W-2) income if you actively participate and your MAGI is under $100k (phasing out to $0 by $150k); unused losses carry forward. On sale, claimed depreciation is recaptured at up to 25%, and gains may owe capital-gains tax (a 1031 exchange can defer both). Figures are a year-1 estimate at your 24.0% rate — not tax advice; consult a CPA.
Schools (NCES district)
- District
- Morrisville-Eaton Central School District
- NCES district ID
- 3619920
- Math proficiency
- 59% ▲ 12.00%
- Reading proficiency
- 72% ▲ 17.00%
- Median HH income
- $49,688
- Composite
- 55.56/100
- National rank
- #1239
- State rank
- #177 of 590 in NY
Livability — Hamilton
- Score
- 72/100
- State rank
- #361
- US rank
- #6150
Category grades
Schools grade is shown separately in the Schools card above.
Census & demographics
- City population
- 6,275
- Population (ZIP)
- 887
Population outlook (Madison County) Hauer SSP2
- Today (2025)
- 69,528 people
- By 2030
- 66,599 · -4.2%
- By 2040
- 59,814 · -14.0%
- By 2050
- 52,842 · -24.0%
- By 2075
- 39,167 · -43.7%
- By 2100
- 28,442 · -59.1%
Race, ethnicity, and origin ACS 2023
- Neighborhood character
- Predominantly White (95%)
- Race & ethnicity
- White 95% Black 3% Two or more races 2%
- Common ancestry
- Romanian 2% Polish 2% Lithuanian 1%
- Foreign-born
- 1% · Canada
- Languages at home
- 97% English-only · German/W. Germanic 3%
Political lean MEDSL · Madison
- 2024 margin
- R (+13.1) · D 43.5% · R 56.5%
- 2008→2024 swing
- -13.9pp toward R · 2008: 0.9pp · 2024: -13.1pp
- All cycles
- 2024: R+13.1 2020: R+10.6 2016: R+15.9 2012: D+0.3 2008: D+0.9
Not yet ingested
- Civics
- —
Market trends
- HPI YoY
- ▲ 5.24%
- Current HPI
- 278.0875
- Rent YoY
- —
- Metro
- —
- State GDP YoY
- ▲ 2.60%
- F500 in state
- 92
Industry mix (Fortune 500 HQ in NY)
| Industry | F500 HQs | Revenue |
|---|---|---|
| Financial Services | 10 | $950B |
|
||
| Consumer Goods | 9 | $162B |
|
||
| Insurance | 4 | $225B |
|
||
| Telecommunications | 2 | $144B |
|
||
| Pharmaceuticals | 2 | $112B |
|
||
| Media / Entertainment | 2 | $69B |
|
||
Price history
1 event — show timeline
- 2026-05-28 Listed $45,000 CNYIS
Property tax history
-1.8%/yrLatest (2025): $1,278 · +1.7% YoY. Source: county tax records.
Cash-flow waterfall
monthlySold comps — $/sqft
last 12 mo · ≤1 miLoading sold comps…