 Duplex
637 State St · Menasha, WI
Flood risk 1/10 · Minimal
- FEMA flood zone
- X (unshaded)
- Chance of flooding over 30 yrs
- 0.0%
- Est. flood insurance / yr
- $473 – $860
Fire risk 1/10 · Minimal
- Est. fire insurance / yr
- $636 – $1,182
Heat risk 2/10 · Minimal
- Hot days now (above 97°F)
- 7 days/yr
- Hot days in 30 yrs
- 13 days/yr
Wind risk 2/10 · Minimal
- Chance of severe wind over 30 yrs
- —
Air-quality risk 2/10 · Minimal
- Unhealthy air days now
- 1 days/yr
- Unhealthy air days in 30 yrs
- 2 days/yr
Risk factors via First Street. Map © Google.
Why this score? — see what drove the C+ grade
The composite is a weighted blend of 9 inputs, each scored 0–100. Each bar is that input's sub-score; the figure is the points it added to the 100-point composite (weight × sub-score).
- Cash flow +22.4/30.0
- Appreciation +10.0/10.0
- DSCR +7.2/10.0
- 1% rule +5.7/10.0
- Livability +4.0/5.0
- ARV discount +3.8/15.0
- Rent growth +3.7/5.0
- Condition / age +2.5/5.0
- Schools +2.3/10.0
$279,900
🖨 Deal sheet (PDF) 📄 Offer letter ✓ Due diligence
Multi-family units
County records classify this as Multi-Family (2-4 Unit). Listing-text estimate: 2 units. confirmed
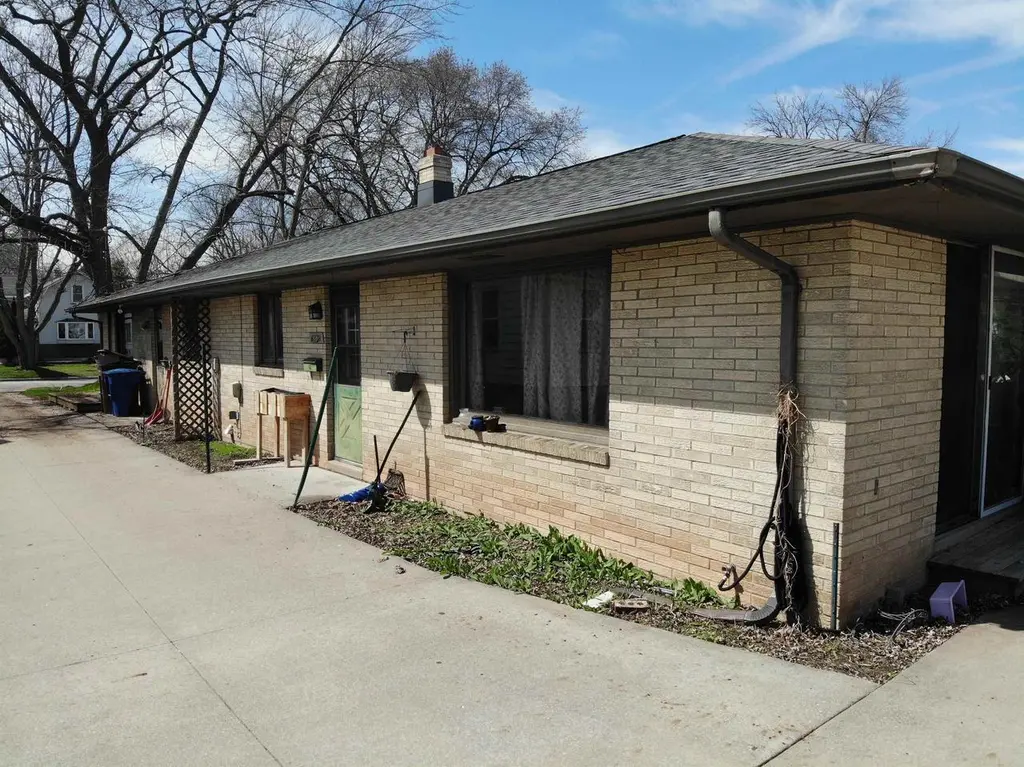
Listing remarks
Ranch style side by side duplex. Only one owner that's why the rents are low. The renters are on a month to month agreement at this time. New roof was just put on the unit in 2025. Updated cement driveway throughout the years. 2 car detached garage with a separator down the center so each renter gets half of the garage. Long term renters. Great owner occupy option or income waiting to finish off your portfolio, as a great investment. Call today for your private showing, but a 12 hour notice is required. Separate furnace, Hot water heater and electric panels.
Key facts
- Hot water heater
- Electric panels
- Separate furnace
Tags
Property features AI
Finance
- Other: Two-unit building with each unit approx. 938 sq ft (estimated total 1,751–2,000 sq ft); None of the appliances are included
- Financial info: Total taxes listed (see broker) — financial details provided separately
Exterior
- Parking: Outside parking
- Utilities: Municipal water; Municipal sewer
- Home design: Multi-family duplex; One-story building; Assessor/public record used for year built
- Construction: Lot size approx. 0.19 acre; Zoned 2 Family/Duplex
- Exterior features: Brick exterior; Level lot
Interior
- Kitchen: Unit 2 kitchen approx. 12 x 12
- Bedrooms: Unit 1: 2 bedrooms; Unit 2: 2 bedrooms (master approx. 12 x 15; second bedroom approx. 17 x 12)
- Bathrooms: Unit 1: 1 full bath; Unit 2: 1 full bath
- Heating & cooling: Hot water/steam heating; Natural gas fuel
- Interior features: Cable/Satellite available; Full poured concrete basement with sump pump
Neighborhood map
What this means for you Summary
Snapshot
- This is a 2 × 2-bed/1.0-bath units multifamily listed at $280k.
Deal economics
- At list price, monthly cash flow is $466 ($6k/yr) — positive. Per door: $233/mo.
- The deal already cash-flows at list — no discount required.
- Meets the 1% rule at list price ($3k rent vs $280k).
- Recommended offer: $272k (3.0% below list) — sets the bar for market timing.
- Cap rate 8.3% vs local median 2.5% in Menasha — top-decile yield for the area; either an underpriced asset or a hidden risk that comps aren't pricing in. Stress-test before assuming the spread holds.
Location & tenants
- Location reads 80/100 on livability (#59 in WI, #1,628 nationally) — a professional / high-income tenant draw. Strengths: commute A+, cost of living A+, housing A+; Watch: employment C-, schools D, amenities D.
- Menasha Joint School District (suburban): math 30% / reading 24% proficiency, ranked #300 of 342 in WI (top 88%) — low school quality limits family demand, transient renter base, plan for 1-2y turnover.
- Market conditions: Rents rising fast (+4.6%/yr); 69 active listings in the ZIP; 652 units permitted in Winnebago County in 2024 (333 in 5+ unit buildings).
- At $2,990/mo this rent would consume 52% of the median local household income ($69k/yr) (locally 636% of renters already pay >50% of income on rent) — very limited rent-growth headroom before tenants either downsize or default.
Forward outlook
- In year one you build about $30k of equity ($2k loan paydown + $28k appreciation (10.0% local appreciation)).
- Winnebago County population projected at +3% by 2050 — modest demand growth; plan on rents tracking national, not racing it.
- At projected returns (10.0% appreciation + 4.6% rent growth), your $78k cash investment doubles in ~3 years — after that, you're playing with house money.
- By year 2, paydown + projected appreciation supports a ~$48k cash-out refi (75% LTV) — recoverable capital for the next deal without selling this one.
Negotiation context
- It's been on market 41 days — a 3% lower offer ($272k) is reasonable based on typical stale-listing flexibility.
Questions for the listing agent
- It's been on market 41 days. Have you received any prior offers? Is the seller open to a 3% concession, seller financing, or rate buy-down credit?
- Can we see the unit-by-unit rent roll, current vacancy, and any below-market leases? What's the average tenancy length?
- What capital expenditures (roof, boiler, parking lot, exteriors) have been made in the last 5 years, and what's planned in the next 2?
- Built in 1964 — when were the roof, HVAC, electrical panel, plumbing, and water heater last replaced?
- Is there a deadline driving the sale (1031 exchange, divorce, estate, relocation)? That informs how much negotiation room exists.
- Schools are D-rated, which usually means shorter tenancies and higher turnover. Who's the typical renter profile here, and what's been the actual vacancy rate?
- What's the average days-on-market for RENTAL listings here right now (not sales)? A rising rental-DOM trend means longer vacancies and softer asking-rent achievability than the comps imply.
- What's the recent tenant-quality profile in this submarket — average credit score on applications, eviction rate, late-payment / NSF rate, and stable-employment percentage? A property-management company in the area should have these aggregated.
- How much new apartment / multifamily construction is in the pipeline within 1–3 miles? Heavy new supply (>2% of stock underway) typically softens rents 12–24 months out; light construction supports rent growth.
Investment metrics
- 1% rule
- 1.07% ✓
- Cap rate
- 8.29%
- Cash-on-cash
- 7.13%
- DSCR
- 1.32
- GRM
- 7.8
CMA / ARV
- ARV (on-the-fly)
- $258,720
- Comps found
- 4
Show comp detail 4 sales within ~0.75 mi
| Address | Dist | Beds/Ba | Sqft | Sold | Price | $/sf | Match |
|---|---|---|---|---|---|---|---|
| 966 7th St | 0.73mi | 4/2.5 | 2,352 (0%) | 21mo | $285,000 | $121 | 46 |
| 916 Jefferson St | 0.68mi | 4/2.0 | 2,103 (-11%) | 13mo | $231,000 | $110 | 40 |
| 725 2nd St | 0.45mi | 5/2.0 (+1) | 2,082 (-12%) | 23mo | $160,000 | $77 | 36 |
| 732 Broad St | 0.54mi | 4/2.0 | 2,030 (-14%) | 22mo | $95,000 | $47 | 34 |
Match score weights: distance 35% · size 25% · config 20% · recency 20%. Top-matched comps best support the ARV.
Projected returns pro-forma
10.0% appreciation · 4.62% rent growth · sell at horizon
- IRR
- 30.1%
- Equity multiple
- 3.39×
- Total profit
- $187,085
- Equity at exit
- $252,156
- IRR
- 26.6%
- Equity multiple
- 7.87×
- Total profit
- $538,378
- Equity at exit
- $543,784
Cash invested: $78,372 (down + closing). Projections, not guarantees.
Landlord ↔ Tenant lean methodology
- Overall (STATE)
- 73 Landlord-Friendly
- State Wisconsin
- 73 Landlord-Friendly · R+2
- County
- — inherits STATE
- City
- — inherits STATE
ZIP-level market 54952
- Home prices YoY
- 7.2%
- Rents YoY
- 4.6%
- Active inventory
- 69
- Price-to-rent
- 15.6×
Monthly cashflow live
- Estimated rent
- $2,990 high interval (Pro) →
- Mortgage (P&I)
- −$1,468
- Tax from tax record
- −$312 /mo · $3,742/yr
- Insurance
- −$117
- HOA
- −$0
- Vacancy / Maint / Mgmt
- −$628
- Net cashflow
- $466
Break-even live
Sensitivity live
| Price | -10% $624 | -5% $545 | +0% $466 | +5% $387 | +10% $307 |
|---|---|---|---|---|---|
| Rent | -10% $230 | -5% $348 | +0% $466 | +5% $584 | +10% $702 |
| Rate | -1.0pp $607 | -0.5pp $537 | base $466 | +0.5pp $393 | +1.0pp $320 |
2-unit breakdown (identical units grouped — click to expand)
| Units | Beds | Baths | Est. rent |
|---|---|---|---|
| 2× units | 2 | 1 | $2,990 |
| #1 | 2 | 1 | $1,495 |
| #2 | 2 | 1 | $1,495 |
| Total (2 units) | $2,990 | ||
UW: 25.0% down · 7.5% · 30yr · 1.5% tax · 5.0% vac · 8.0% maint · 8.0% mgmt
Financing live
Cash to close
- Down payment
- $69,975
- Closing costs
- $8,397
- Reserves months
- —
- Total cash needed
- —
Loan-product check · same deal, 3 products live
Conventional
25% down · 7.5% · 30yr
- Down + closing
- —
- Monthly P&I
- —
- Monthly cashflow
- —
- DSCR
- —
- Eligible?
- —
Personal DTI + credit; lowest rate.
DSCR
20% down · 8.5% · 30yr
- Down + closing
- —
- Monthly P&I
- —
- Monthly cashflow
- —
- DSCR
- —
- Eligible?
- —
No personal income docs; deal must DSCR.
Hard money
10% down · 12.0% · 12mo
- Down + closing
- —
- Monthly P&I
- —
- Monthly cashflow
- —
- DSCR
- —
- Eligible?
- —
Short-term bridge; refi at stabilization.
Listing history 5 events
-
2026-05-31status $279,900 Pending 41 DOM
-
2026-05-31days on market $279,900 Active w/ Contract 41 DOM
-
2026-05-30days on market $279,900 Active w/ Contract 40 DOM
-
2026-04-29historical Active w/ Contract
-
2026-04-17$279,900 Active
ⓘ Source: listings_history table (triggers on properties + properties_extension) + one-shot
backfill from property_details.listing_events for pre-trigger history.
Tax reassessment forecast WI · Partial reset (capped growth)
- Current annual tax
- $3,742 · $312/mo
- Projected year-2 tax
- $4,460 · $372/mo
- Expected delta
- +$718/yr (+$60/mo · 19.2%)
ⓘ Screening estimate from a state-policy table — verify with the county assessor before closing.
Climate risk First Street
- Flood 1/10 Low FEMA zone X (unshaded) · 0% chance over 30 yrs
- Wildfire 1/10 Low
- Heat 2/10 Low 7 d/yr ≥97°F today · 13 d/yr by 30 yrs out
- Wind 2/10 Low
- Air quality 2/10 Low 1 unhealthy d/yr today · 2 by 30 yrs out
Nearby sold comps map
Loading sold comps map…
Walkable amenities ~0.75 mi
Loading nearby amenities…
Taxation est. · year 1
- Rental income
- $35,880
- − Mortgage interest
- −$15,679
- − Property taxes
- −$3,742
- − Insurance
- −$1,400
- − Repairs & maintenance
- −$2,870
- − Management
- −$2,870
- − Depreciation
- −$8,143
- Taxable income
- $1,177
- Est. tax owed @ 24.0%
- −$282
- After-tax cash flow
- $5,308/yr
For passive investors: Depreciation is non-cash, so a rental often shows a tax loss while cash-flowing — sheltering income. Rental losses are passive: they offset passive income freely, and up to $25,000/yr can offset ordinary (W-2) income if you actively participate and your MAGI is under $100k (phasing out to $0 by $150k); unused losses carry forward. On sale, claimed depreciation is recaptured at up to 25%, and gains may owe capital-gains tax (a 1031 exchange can defer both). Figures are a year-1 estimate at your 24.0% rate — not tax advice; consult a CPA.
Schools (NCES district)
- District
- Menasha Joint School District
- NCES district ID
- 5509030
- Math proficiency
- 30% ▼ -10.00%
- Reading proficiency
- 24% ▼ -7.00%
- Median HH income
- $44,188
- Composite
- 23.19/100
- National rank
- #7945
- State rank
- #300 of 342 in WI
Livability — Menasha
- Score
- 80/100
- State rank
- #59
- US rank
- #1628
Category grades
Schools grade is shown separately in the Schools card above.
Census & demographics
- Census place
- Menasha, WI
- County
- Winnebago County · 155,689 people
- Metro
- Oshkosh-Neenah, WI
- Population (ZIP)
- 27,312
- Household income
- $69,196
- Rent vs Own
- Severe rent burden
- 636.0
Population outlook (Winnebago County) Hauer SSP2
- Today (2025)
- 175,480 people
- By 2030
- 177,928 · +1.4%
- By 2040
- 180,873 · +3.1%
- By 2050
- 181,302 · +3.3%
- By 2075
- 184,071 · +4.9%
- By 2100
- 175,932 · +0.3%
Race, ethnicity, and origin ACS 2023
- Neighborhood character
- Predominantly White (81%)
- Race & ethnicity
- White 81% Hispanic / Latino 11% Two or more races 8% Asian 2%
- Hispanic origin (detail)
- Mexican 8% Puerto Rican 3%
- Common ancestry
- Romanian 6% Iranian 4% Portuguese 4%
- Foreign-born
- 5% · Canada, China
- Languages at home
- 91% English-only · Spanish 6% Other Asian/Pacific 1%
Political lean MEDSL · Winnebago
- 2024 margin
- Toss-up / Even · D 46.9% · R 51.7% · Other 1.4%
- 2008→2024 swing
- -16.4pp toward R · 2008: 11.7pp · 2024: -4.8pp
- All cycles
- 2024: R+4.8 2020: R+4.0 2016: R+7.4 2012: D+3.8 2008: D+11.7
Not yet ingested
- Civics
- —
Market trends
- HPI YoY
- ▲ 30.18%
- Current HPI
- 446.39
- Rent YoY
- ▲ 4.62%
- Metro
- Oshkosh-Neenah, WI
- State GDP YoY
- ▲ 2.10%
- F500 in state
- 20
Industry mix (Fortune 500 HQ in WI)
| Industry | F500 HQs | Revenue |
|---|---|---|
| Industrial Machinery | 4 | $23B |
|
||
| Industrial Technology | 2 | $36B |
|
||
| Insurance | 1 | $36B |
|
||
| Professional Services | 1 | $19B |
|
||
| Utilities | 1 | $9B |
|
||
| Consumer Goods | 1 | $3B |
|
||
Price history
2 events — show timeline
- 2026-04-29 Contingent — RANW
- 2026-04-17 Listed $279,900 RANW
Property tax history
+4.2%/yrLatest (2021): $3,742 · +3.9% YoY. Source: county tax records.
Cash-flow waterfall
monthlySold comps — $/sqft
last 12 mo · ≤1 miLoading sold comps…