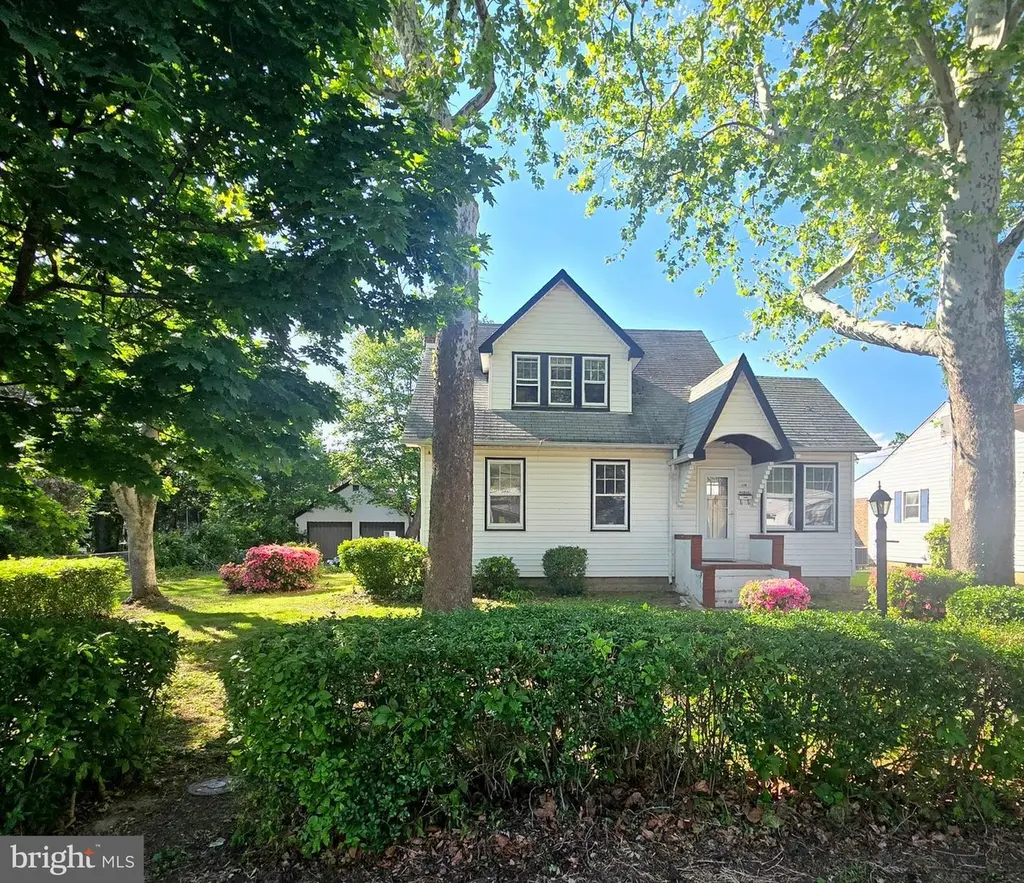
220 Meadow Rd · Riviera Beach, MD
Flood risk 1/10 · Minimal
- FEMA flood zone
- X (unshaded)
- Chance of flooding over 30 yrs
- 0.0%
- Est. flood insurance / yr
- $473 – $860
Fire risk 1/10 · Minimal
- Est. fire insurance / yr
- $755 – $1,403
Heat risk 8/10 · Major
- Hot days now (above 104°F)
- 7 days/yr
- Hot days in 30 yrs
- 15 days/yr
Wind risk 6/10 · Moderate
- Chance of severe wind over 30 yrs
- 63.0%
Air-quality risk 5/10 · Moderate
- Unhealthy air days now
- 6 days/yr
- Unhealthy air days in 30 yrs
- 8 days/yr
Risk factors via First Street. Map © Google.
Why this score? — see what drove the D- grade
The composite is a weighted blend of 9 inputs, each scored 0–100. Each bar is that input's sub-score; the figure is the points it added to the 100-point composite (weight × sub-score).
- Cash flow +13.9/30.0
- DSCR +4.2/10.0
- ARV discount +3.4/15.0
- Livability +3.2/5.0
- 1% rule +3.0/10.0
- Schools +2.9/10.0
- Rent growth +2.7/5.0
- Condition / age +2.5/5.0
- Appreciation +0.0/10.0
$450,000
🖨 Deal sheet 📄 Offer letter ✓ Due diligence
Listing remarks
Rare Offering in Riviera Beach! Proudly offered by the original family, this charming 4-bedroom Cape Cod is situated on a spacious . 21-acre lot and includes a detached 2-car garage. Filled with years of love, laughter, and cherished family memories, this home is ready for its next chapter. Featuring a traditional floor plan, the residence offers the perfect opportunity to move right in while adding your own personal touches and updates over time. Spacious rooms, classic Cape Cod character, and a generous yard provide the ideal foundation to create the home you've always envisioned. With thoughtful updates and modern finishes, this property has the potential to become one of the most desira
Key facts
- 9,375 sq ft lot
- 2 garage spots
- Built 1945
Property features AI
Finance
- Other: Fee simple ownership; Property listed as outside city limits; Ground rent payment frequency: annually
- HOA & community: Community amenities include beach, pier/dock, common grounds, jog/walk path, picnic area, playground/tot lots, baseball and soccer fields
Exterior
- Parking: Detached front-entry oversized garage with 2 garage spaces; Driveway with approximately 6 parking spaces; Total of about 8 parking spaces
- Utilities: Public water; Public sewer; Electric service available; Cable TV available; Phone service available; Propane available
- Home design: Detached single-family home; Traditional floor plan
- Construction: Vinyl siding; Shingle roof; Block foundation; Basement with interior access, poured concrete, unfinished space suitable for rooms, sump pump (unfinished below-grade area)
- Exterior features: Private water access on Stoney Creek (creek); Pier/dock with one dock; Public beach access nearby; Water activities allowed: boating (powered), canoe/kayak, PWC, sailing, swimming, waterski/wakeboard; Navigable water; Municipal trash service
Interior
- Kitchen: Galley kitchen; Kitchenette
- Bedrooms: Two bedrooms on the main level; Two bedrooms on the upper level
- Flooring: Hardwood / wood floors
- Bathrooms: Three full bathrooms (one on main level, one on upper level, one on lower level)
- Heating & cooling: 90% forced air heating (oil fuel); Central air conditioning; Ceiling fans; Hot water available via electric, bottled gas, and oil
- Interior features: Bar; Stall shower and tub/shower combinations; Ceiling fans; Open combination dining and living area with a traditional floor plan; Galley kitchen layout; Kitchenette; Wood/hardwood floors
- Laundry & utility: Laundry located on lower floor
Neighborhood map
What this means for you Summary
Snapshot
- This is a 4-bed/3.0-bath single-family listed at $450k.
Deal economics
- At list price, monthly cash flow is $45 ($545/yr) — positive.
- The deal already cash-flows at list — no discount required.
- To meet the 1% rule (rent ≥ 1% of price), the offer needs to be $358k (20.4% below list).
- Recommended offer: $358k (20.4% below list) — sets the bar for 1% rule.
Location & tenants
- Location reads 64/100 on livability (#280 in MD) — a middle-class / working-renter tenant base. Strengths: employment A+, housing A+; Watch: crime D, cost of living D, amenities F.
- Anne Arundel County Public Schools (suburban): math 20% / reading 37% proficiency, ranked #10 of 24 in MD (top 42%) — low school quality limits family demand, transient renter base, plan for 1-2y turnover.
- Zoned schools: Riviera Beach Elementary (math 12% / reading 17%, grade F, #477 of 860 statewide, top 59%, 281 students, 50% FRL); Northeast Middle (math 6% / reading 32%, grade F, #155 of 225 statewide, top 70%, 882 students, 49% FRL); Northeast High (math 24% / reading 57%, grade F, #130 of 222 statewide, top 58%, 1,390 students, 44% FRL) — zoned schools average 48% FRL vs 25% district-wide (22 pts higher); higher-poverty schools than district average — tighter screening recommended.
- Market conditions: Rents flat; 254 active listings in the ZIP; 11 comparable units currently listed for rent nearby; rentals at typical pace (median 24d on market — plan ~3-4 weeks tenant-placement turnaround); high-income renter base; 1,303 units permitted in Anne Arundel County in 2024 (299 in 5+ unit buildings).
- This rent runs 34% of the median local income ($128k/yr) — at the standard rent-burdened threshold; future hikes will face affordability resistance.
Forward outlook
- Local home prices are declining (-3.0%/yr); year-one equity from $3k of loan paydown is wiped out by about $14k of value loss. Plan a longer hold.
- Anne Arundel County population projected at +17% by 2050 — long-run rental-demand tailwind backs the buy-and-hold thesis.
Negotiation context
- Only 4 days on market — expect competitive offers; lowballing is unlikely to land.
Risks & watch-outs
- Watch-outs: built in 1945 — expect roof / HVAC / electrical / plumbing capex.
- Climate carrying-cost: major wind risk, 63% chance of damaging wind over 30y; extreme-heat days projected 7→15/yr by 2055 (HVAC capex compounding) — expect insurance premiums to compound above CPI over the hold.
Questions for the listing agent
- Built in 1945 — when were the roof, HVAC, electrical panel, plumbing, and water heater last replaced?
- Is there a deadline driving the sale (1031 exchange, divorce, estate, relocation)? That informs how much negotiation room exists.
- Schools are D-rated, which usually means shorter tenancies and higher turnover. Who's the typical renter profile here, and what's been the actual vacancy rate?
- Crime grade is D in this area — have there been break-ins, vandalism, or insurance claims at this property in the last 3 years? What carrier currently insures it and at what premium?
- The area grade is low — what's the realistic commute time and amenity access for the typical tenant pool here? Any planned neighborhood developments (good or bad) we should know about?
- What's the average days-on-market for RENTAL listings here right now (not sales)? A rising rental-DOM trend means longer vacancies and softer asking-rent achievability than the comps imply.
- What's the recent tenant-quality profile in this submarket — average credit score on applications, eviction rate, late-payment / NSF rate, and stable-employment percentage? A property-management company in the area should have these aggregated.
- How much new for-sale + rental construction is in the pipeline within 1–3 miles? Heavy new supply typically softens prices + rents 12–24 months out; constrained supply supports both.
Investment metrics
- 1% rule
- 0.80% ✗
- Cap rate
- 6.41%
- Cash-on-cash
- 0.43%
- DSCR
- 1.02
- GRM
- 10.5
CMA / ARV
- ARV (on-the-fly)
- $412,160
- Comps found
- 12
Show comp detail 12 sales within ~0.75 mi
| Address | Dist | Beds/Ba | Sqft | Sold | Price | $/sf | Match |
|---|---|---|---|---|---|---|---|
| 8528 Main Ave | 0.32mi | 4/2.0 | 1,304 (+2%) | 10mo | $414,500 | $318 | 69 |
| 8504 Jenkins Rd | 0.50mi | 4/2.0 | 1,248 (-2%) | 1mo | $425,000 | $341 | 67 |
| 181 Roland Rd | 0.20mi | 4/2.0 | 1,424 (+11%) | 7mo | $435,000 | $305 | 62 |
| 210 Arundel Rd | 0.39mi | 3/3.0 (-1) | 1,392 (+9%) | 6mo | $459,900 | $330 | 57 |
| 214 Dale Rd | 0.11mi | 3/1.0 (-1) | 1,136 (-11%) | 10mo | $420,000 | $370 | 55 |
| 8437 Bedford Rd | 0.72mi | 3/2.5 (-1) | 1,240 (-3%) | 1mo | $337,300 | $272 | 54 |
| 267 Lake Riviera Rd | 0.42mi | 3/2.5 (-1) | 1,432 (+12%) | 3mo | $490,000 | $342 | 51 |
| 225 Asbury Rd | 0.52mi | 4/1.0 | 1,170 (-9%) | 6mo | $318,000 | $272 | 48 |
| 8435 Church Rd | 0.32mi | 3/1.5 (-1) | 1,104 (-14%) | 10mo | $355,000 | $322 | 42 |
| 8440 Spring Rd | 0.66mi | 3/2.0 (-1) | 1,368 (+7%) | 9mo | $470,000 | $344 | 42 |
| 103 Arundel Rd | 0.75mi | 3/2.0 (-1) | 1,392 (+9%) | 3mo | $379,900 | $273 | 39 |
| 240 Wanda Rd | 0.56mi | 3/2.0 (-1) | 1,122 (-12%) | 7mo | $360,000 | $321 | 38 |
Match score weights: distance 35% · size 25% · config 20% · recency 20%. Top-matched comps best support the ARV.
Projected returns pro-forma
-3.0% appreciation · 0.76% rent growth · sell at horizon
- IRR
- -17.9%
- Equity multiple
- 0.38×
- Total profit
- $-78,065
- Equity at exit
- $67,096
- IRR
- -14.6%
- Equity multiple
- 0.24×
- Total profit
- $-95,813
- Equity at exit
- $38,908
Cash invested: $126,000 (down + closing). Projections, not guarantees.
Landlord ↔ Tenant lean methodology
- Overall (STATE)
- 27 Tenant-Leaning
- State Maryland
- 27 Tenant-Leaning · D+14
- County
- — inherits STATE
- City
- — inherits STATE
ZIP-level market 21122
- Rents YoY
- 0.8%
- Active inventory
- 254
- Price-to-rent
- 10.5×
Monthly cashflow live
- Estimated rent
- $3,580 high interval (Pro) →
- Mortgage (P&I)
- −$2,360
- Tax from tax record
- −$236 /mo · $2,829/yr
- Insurance
- −$188
- HOA
- −$0
- Vacancy / Maint / Mgmt
- −$752
- Net cashflow
- $45
Break-even live
UW: 25.0% down · 7.5% · 30yr · 1.5% tax · 5.0% vac · 8.0% maint · 8.0% mgmt
Financing live
Cash to close
- Down payment
- $112,500
- Closing costs
- $13,500
- Reserves months
- —
- Total cash needed
- —
Loan-product check · same deal, 3 products live
Conventional
25% down · 7.5% · 30yr
- Down + closing
- —
- Monthly P&I
- —
- Monthly cashflow
- —
- DSCR
- —
- Eligible?
- —
Personal DTI + credit; lowest rate.
DSCR
20% down · 8.5% · 30yr
- Down + closing
- —
- Monthly P&I
- —
- Monthly cashflow
- —
- DSCR
- —
- Eligible?
- —
No personal income docs; deal must DSCR.
Hard money
10% down · 12.0% · 12mo
- Down + closing
- —
- Monthly P&I
- —
- Monthly cashflow
- —
- DSCR
- —
- Eligible?
- —
Short-term bridge; refi at stabilization.
Rent comps 11 comps
| Address | Beds | Baths | Sqft | Rent | $/sqft | DOM | Units | Dist |
|---|---|---|---|---|---|---|---|---|
| 8436 Bay Dr Pasadena, MD | 4.0 | 3.0 | 1004 | $3,200 | $3.19 | 23d | 1 | 0.11mi |
| 202 Glen Rd Pasadena, MD | 5.0 | 3.0 | 1510 | $4,999 | $3.31 | 43d | 1 | 0.16mi |
| 216 Dunlap Rd Pasadena, MD | 4.0 | 2.0 | 1110 | $3,000 | $2.70 | 43d | 1 | 0.61mi |
| 8582 Beacon Point Rd Pasadena, MD | 3.0 | 1.5 | 1159 | $2,650 | $2.29 | 2d | 1 | 0.62mi |
| 1346 Riverwood Way Stoney Beach, MD | 3.0 | 2.5 | 1500 | $2,700 | $1.80 | 2d | 1 | 0.79mi |
| 1346 Riverwood Way Stoney Beach, MD | 3.0 | 2.5 | 1500 | $2,700 | $1.80 | 3d | 1 | 0.79mi |
| 1122 Hilltop Rd Orchard Beach, MD | 3.0 | 2.0 | 1041 | $2,399 | $2.30 | 23d | 1 | 0.82mi |
| 8561 Skipjack Pl Pasadena, MD | 3.0 | 2.5 | 1670 | $2,900 | $1.74 | 3d | 1 | 0.97mi |
| 8561 Skipjack Pl Pasadena, MD | 3.0 | 2.5 | 1670 | $2,900 | $1.74 | 4d | 1 | 0.97mi |
| 959 Mount Desert Harbour Pasadena, MD | 3.0 | 1.5 | 1400 | $2,600 | $1.86 | 23d | 1 | 1.14mi |
| 950 Nabbs Creek Rd Glen Burnie, MD | 4.0 | 3.5 | 1752 | $6,500 | $3.71 | 23d | 1 | 1.49mi |
Listing history 11 events
-
2026-06-18days on market $450,000 Active 4 DOM
-
2026-06-17days on market $450,000 Active 3 DOM
-
2026-06-16days on market $450,000 Active 2 DOM
-
2026-06-15statusdays on market $450,000 Active 1 DOM
-
2026-06-13days on market $450,000 Coming Soon 11 DOM
-
2026-06-09days on market $450,000 Coming Soon 7 DOM
-
2026-06-08days on market $450,000 Coming Soon 6 DOM
-
2026-06-07days on market $450,000 Coming Soon 5 DOM
-
2026-06-04days on market $450,000 Coming Soon 2 DOM
-
2026-06-02remarks 699-char remark
-
2026-06-02$450,000 Coming Soon 1 DOM
ⓘ Source: listings_history table (triggers on properties + properties_extension) + one-shot
backfill from property_details.listing_events for pre-trigger history.
Tax reassessment forecast MD · Partial reset (capped growth)
- Current annual tax
- $2,829 · $236/mo
- Projected year-2 tax
- $3,867 · $322/mo
- Expected delta
- +$1,038/yr (+$86/mo · 36.7%)
ⓘ Screening estimate from a state-policy table — verify with the county assessor before closing.
Climate risk First Street
- Flood 1/10 Low FEMA zone X (unshaded) · 0% chance over 30 yrs
- Wildfire 1/10 Low
- Heat 8/10 Severe 7 d/yr ≥104°F today · 15 d/yr by 30 yrs out
- Wind 6/10 Major 63% chance of damaging wind over 30 yrs
- Air quality 5/10 Major 6 unhealthy d/yr today · 8 by 30 yrs out
Nearby sold comps map
Loading sold comps map…
Walkable amenities ~0.75 mi
Loading nearby amenities…
Taxation est. · year 1
- Rental income
- $42,966
- − Mortgage interest
- −$25,207
- − Property taxes
- −$2,829
- − Insurance
- −$2,250
- − Repairs & maintenance
- −$3,437
- − Management
- −$3,437
- − Depreciation
- −$13,091
- Taxable loss
- −$7,286
- Est. tax savings @ 24.0%
- +$1,749
- After-tax cash flow
- $2,294/yr
For passive investors: Depreciation is non-cash, so a rental often shows a tax loss while cash-flowing — sheltering income. Rental losses are passive: they offset passive income freely, and up to $25,000/yr can offset ordinary (W-2) income if you actively participate and your MAGI is under $100k (phasing out to $0 by $150k); unused losses carry forward. On sale, claimed depreciation is recaptured at up to 25%, and gains may owe capital-gains tax (a 1031 exchange can defer both). Figures are a year-1 estimate at your 24.0% rate — not tax advice; consult a CPA.
Schools (NCES district)
- District
- Anne Arundel County Public Schools
- NCES district ID
- 2400060
- Math proficiency
- 20% ▼ -21.00%
- Reading proficiency
- 37% ▼ -13.00%
- Median HH income
- $87,880
- Composite
- 28.52/100
- National rank
- #6733
- State rank
- #10 of 24 in MD
Livability — Riviera Beach
- Score
- 64/100
- State rank
- #280
- US rank
- #14429
Category grades
Schools grade is shown separately in the Schools card above.
Census & demographics
- Census place
- Riviera Beach, MD
- County
- Anne Arundel County · 535,653 people
- Metro
- Baltimore-Columbia-Towson, MD
- Population (ZIP)
- 61,566
- Household income
- $127,587
- Rent vs Own
- Severe rent burden
- 791.0
Population outlook (Anne Arundel County) Hauer SSP2
- Today (2025)
- 617,384 people
- By 2030
- 642,094 · +4.0%
- By 2040
- 686,621 · +11.2%
- By 2050
- 723,031 · +17.1%
- By 2075
- 809,346 · +31.1%
- By 2100
- 837,658 · +35.7%
Race, ethnicity, and origin ACS 2023
- Neighborhood character
- Predominantly White (80%)
- Race & ethnicity
- White 80% Two or more races 7% Black 7% Hispanic / Latino 5% Asian 2%
- Common ancestry
- Romanian 4% Lithuanian 2% Slovak 2%
- Foreign-born
- 4% · Canada, China
- Languages at home
- 93% English-only · Spanish 3% Other Indo-European 1% Chinese 0%
Political lean MEDSL · Anne Arundel
- 2024 margin
- D (+13.9) · D 55.7% · R 41.7% · Other 2.6%
- 2008→2024 swing
- +15.7pp toward D · 2008: -1.8pp · 2024: 13.9pp
- All cycles
- 2024: D+13.9 2020: D+14.5 2016: D+0.7 2012: R+0.9 2008: R+1.8
Not yet ingested
- Civics
- —
Market trends
- HPI YoY
- ▼ -401.00%
- Current HPI
- 283.1566
- Rent YoY
- ▲ 0.76%
- Metro
- Baltimore-Columbia-Towson, MD
- State GDP YoY
- ▲ 2.97%
- F500 in state
- 12
Industry mix (Fortune 500 HQ in MD)
| Industry | F500 HQs | Revenue |
|---|---|---|
| Aerospace / Defense | 1 | $71B |
|
||
| Utilities | 1 | $25B |
|
||
| Hotels | 1 | $24B |
|
||
| Consumer Goods | 1 | $7B |
|
||
| Real Estate | 1 | $6B |
|
||
| Chemicals | 1 | $2B |
|
||
Price history
1 event — show timeline
- 2026-06-02 Coming Soon $450,000 BRIGHT MLS
Property tax history
+4.3%/yrLatest (2025): $2,829 · +256.9% YoY. Source: county tax records.
Cash-flow waterfall
monthlySold comps — $/sqft
last 12 mo · ≤1 miLoading sold comps…