 Multi-family
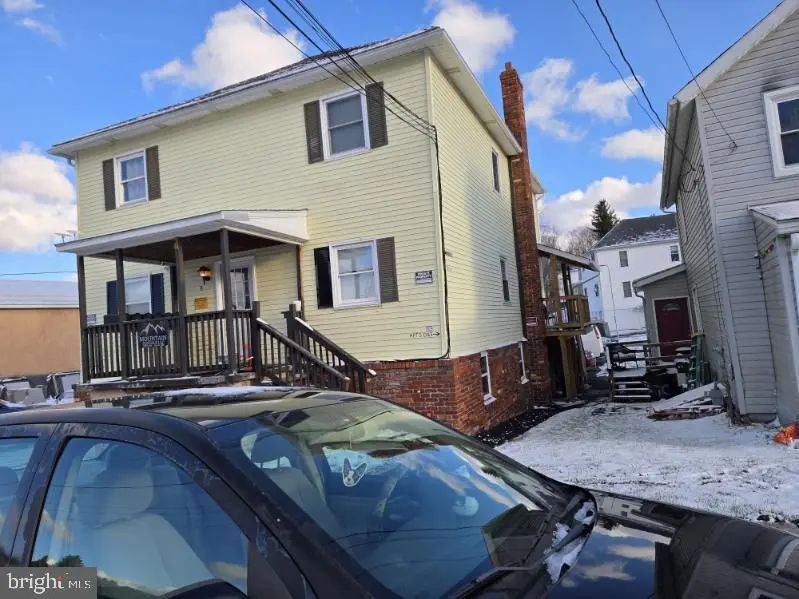
8 Hill St · Frostburg, MD
Flood risk 7/10 · Major
- FEMA flood zone
- X (unshaded)
- Chance of flooding over 30 yrs
- 0.76%
- Est. flood insurance / yr
- $473 – $860
Fire risk 1/10 · Minimal
- Est. fire insurance / yr
- $755 – $1,403
Heat risk 3/10 · Minor
- Hot days now (above 91°F)
- 8 days/yr
- Hot days in 30 yrs
- 19 days/yr
Wind risk 2/10 · Minimal
- Chance of severe wind over 30 yrs
- —
Air-quality risk 2/10 · Minimal
- Unhealthy air days now
- 0 days/yr
- Unhealthy air days in 30 yrs
- 1 days/yr
Risk factors via First Street. Map © Google.
Why this score? — see what drove the B- grade
The composite is a weighted blend of 9 inputs, each scored 0–100. Each bar is that input's sub-score; the figure is the points it added to the 100-point composite (weight × sub-score).
- Cash flow +30.0/30.0
- 1% rule +10.0/10.0
- DSCR +10.0/10.0
- ARV discount +8.5/15.0
- Livability +4.4/5.0
- Rent growth +2.5/5.0
- Condition / age +2.5/5.0
- Schools +1.9/10.0
- Appreciation +0.0/10.0
$245,000
🖨 Deal sheet 📄 Offer letter ✓ Due diligence
Multi-family units
County records classify this as Multi-Family (5+ Unit). Listing-text estimate: 1 unit. estimate disagrees with records
5+ unit building — per-unit beds/baths from public records are typically unavailable; the breakdown below (if shown) is an estimate from the listing text.
Listing remarks MLS
6-unit multifamily investment property offering immediate cash flow and strong upside potential. All units are 2 bedrooms and 1 bathroom. Five of six units are currently occupied. All leases are month to month, providing a new owner with full flexibility to reposition rents or renovate at turnover. Current rents are below market rate with potential to achieve a double-digit cap rate through modest rent increases in line with current market conditions. Located in Frostburg, home to Frostburg State University, supporting consistent rental demand. Ideal for investors seeking a value-add multifamily asset with stabilized occupancy and room to grow. Do not disturb tenants. All showings by appointment only.
Key facts
- Occupied units
- Stabilized occupancy
- 6,144 sq ft lot
Tags
Neighborhood map
What this means for you Summary
Snapshot
- This is a 12-bed/6.0-bath multifamily listed at $245k.
Deal economics
- At list price, monthly cash flow is $3k ($35k/yr) — positive.
- The deal already cash-flows at list — no discount required.
- Meets the 1% rule at list price ($6k rent vs $245k).
- Recommended offer: $230k (6.0% below list) — sets the bar for market timing.
- Cap rate 20.8% vs local median 4.2% in Frostburg — top-decile yield for the area; either an underpriced asset or a hidden risk that comps aren't pricing in. Stress-test before assuming the spread holds.
Location & tenants
- Location reads 87/100 on livability (#7 in MD, #287 nationally) — a professional / high-income tenant draw. Strengths: crime A+, amenities A+, cost of living A+; Watch: employment F.
- Allegany County Public Schools (other): math 15% / reading 30% proficiency, ranked #18 of 24 in MD (top 75%) — low school quality limits family demand, transient renter base, plan for 1-2y turnover.
- Market conditions: 102 active listings in the ZIP; 24 units permitted in Allegany County in 2024 (0 in 5+ unit buildings).
Forward outlook
- Local home prices are declining (-3.0%/yr); year-one equity from $2k of loan paydown is wiped out by about $7k of value loss. Plan a longer hold.
- Allegany County population projected at -14% by 2050 — secular population decline; favor cash flow + early exit over multi-decade hold.
- At projected returns (-3.0% appreciation + 3.0% rent growth), your $69k cash investment doubles in ~3 years — after that, you're playing with house money.
Negotiation context
- It's been on market 84 days — a 6% lower offer ($230k) is reasonable based on typical stale-listing flexibility.
- 3 sale attempts since 18y ago; this cycle's ask has dropped $30k (11%) from the opening price — seller is motivated, your offer sets the floor, not the list.
- Current owner paid $185k; 32% above their basis — modest negotiation headroom, anchor on the comps not their cost.
Risks & watch-outs
- Watch-outs: flood insurance adds $56/mo; built in 1935 — expect roof / HVAC / electrical / plumbing capex.
- Climate carrying-cost: major flood risk — expect insurance premiums to compound above CPI over the hold.
Questions for the listing agent
- It's been on market 84 days. Have you received any prior offers? Is the seller open to a 6% concession, seller financing, or rate buy-down credit?
- Built in 1935 — when were the roof, HVAC, electrical panel, plumbing, and water heater last replaced?
- What's the actual annual flood-insurance premium (NFIP or private), and is the property in a SFHA with mandatory coverage?
- Why hasn't it sold? Are there any deal-killer items the seller is aware of (foundation, flood, title, zoning, code violations)?
- Is there a deadline driving the sale (1031 exchange, divorce, estate, relocation)? That informs how much negotiation room exists.
- What's the average days-on-market for RENTAL listings here right now (not sales)? A rising rental-DOM trend means longer vacancies and softer asking-rent achievability than the comps imply.
- What's the recent tenant-quality profile in this submarket — average credit score on applications, eviction rate, late-payment / NSF rate, and stable-employment percentage? A property-management company in the area should have these aggregated.
- How much new apartment / multifamily construction is in the pipeline within 1–3 miles? Heavy new supply (>2% of stock underway) typically softens rents 12–24 months out; light construction supports rent growth.
Investment metrics
- 1% rule
- 2.33% ✓
- Cap rate
- 20.83%
- Cash-on-cash
- 51.91%
- DSCR
- 3.31
- GRM
- 3.6
CMA / ARV
- ARV (median comp)
- $250,784
- List price
- $245,000
- Delta
- -2.31%
- Verdict
- FAIR
- Comps
- 18 within 1.0 mi
Projected returns pro-forma
-3.0% appreciation · 3.0% rent growth · sell at horizon
- IRR
- 48.8%
- Equity multiple
- 3.13×
- Total profit
- $145,805
- Equity at exit
- $36,530
- IRR
- 54.3%
- Equity multiple
- 6.33×
- Total profit
- $365,921
- Equity at exit
- $21,183
Cash invested: $68,600 (down + closing). Projections, not guarantees.
Landlord ↔ Tenant lean methodology
- Overall (STATE)
- 27 Tenant-Leaning
- State Maryland
- 27 Tenant-Leaning · D+14
- County
- — inherits STATE
- City
- — inherits STATE
ZIP-level market 21532
- Home prices YoY
- -24.2%
- Active inventory
- 102
- Price-to-rent
- 21.4×
Monthly cashflow live
- Estimated rent
- $5,718 high interval (Pro) →
- Mortgage (P&I)
- −$1,285
- Tax from tax record
- −$163 /mo · $1,952/yr
- Insurance
- −$102
- Flood insurance flood zone
- −$56 /mo · $666/yr
- HOA
- −$0
- Vacancy / Maint / Mgmt
- −$1,201
- Net cashflow
- $2,912
Break-even live
6-unit breakdown (identical units grouped — click to expand)
| Units | Beds | Baths | Est. rent |
|---|---|---|---|
| 6× units | 2 | 1 | $5,718 |
| #1 | 2 | 1 | $953 |
| #2 | 2 | 1 | $953 |
| #3 | 2 | 1 | $953 |
| #4 | 2 | 1 | $953 |
| #5 | 2 | 1 | $953 |
| #6 | 2 | 1 | $953 |
| Total (6 units) | $5,718 | ||
UW: 25.0% down · 7.5% · 30yr · 1.5% tax · 5.0% vac · 8.0% maint · 8.0% mgmt
Financing live
Cash to close
- Down payment
- $61,250
- Closing costs
- $7,350
- Reserves months
- —
- Total cash needed
- —
Loan-product check · same deal, 3 products live
Conventional
25% down · 7.5% · 30yr
- Down + closing
- —
- Monthly P&I
- —
- Monthly cashflow
- —
- DSCR
- —
- Eligible?
- —
Personal DTI + credit; lowest rate.
DSCR
20% down · 8.5% · 30yr
- Down + closing
- —
- Monthly P&I
- —
- Monthly cashflow
- —
- DSCR
- —
- Eligible?
- —
No personal income docs; deal must DSCR.
Hard money
10% down · 12.0% · 12mo
- Down + closing
- —
- Monthly P&I
- —
- Monthly cashflow
- —
- DSCR
- —
- Eligible?
- —
Short-term bridge; refi at stabilization.
Listing history 22 events
-
2026-06-19days on market $245,000 Active 84 DOM
-
2026-06-18days on market $245,000 Active 83 DOM
-
2026-06-17days on market $245,000 Active 82 DOM
-
2026-06-16days on market $245,000 Active 81 DOM
-
2026-06-15days on market $245,000 Active 80 DOM
-
2026-06-14days on market $245,000 Active 78 DOM
-
2026-06-12days on market $245,000 Active 77 DOM
-
2026-06-09days on market $245,000 Active 74 DOM
-
2026-06-08days on market $245,000 Active 73 DOM
-
2026-06-07days on market $245,000 Active 72 DOM
-
2026-06-02days on market $245,000 Active 67 DOM
-
2026-06-01days on market $245,000 Active 66 DOM
-
2026-05-31days on market $245,000 Active 65 DOM
-
2026-05-30days on market $245,000 Active 64 DOM
-
2026-04-28price $255,000 710-char remark
Show marketing remark (710 chars)
6-unit multifamily investment property offering immediate cash flow and strong upside potential. All units are 2 bedrooms and 1 bathroom. Five of six units are currently occupied. All leases are month to month, providing a new owner with full flexibility to reposition rents or renovate at turnover. Current rents are below market rate with potential to achieve a double-digit cap rate through modest rent increases in line with current market conditions. Located in Frostburg, home to Frostburg State University, supporting consistent rental demand. Ideal for investors seeking a value-add multifamily asset with stabilized occupancy and room to grow. Do not disturb tenants. All showings by appointment only.
-
2026-04-07price $265,000 710-char remark
Show marketing remark (710 chars)
6-unit multifamily investment property offering immediate cash flow and strong upside potential. All units are 2 bedrooms and 1 bathroom. Five of six units are currently occupied. All leases are month to month, providing a new owner with full flexibility to reposition rents or renovate at turnover. Current rents are below market rate with potential to achieve a double-digit cap rate through modest rent increases in line with current market conditions. Located in Frostburg, home to Frostburg State University, supporting consistent rental demand. Ideal for investors seeking a value-add multifamily asset with stabilized occupancy and room to grow. Do not disturb tenants. All showings by appointment only.
-
2026-03-27$275,000 Active 710-char remark
Show marketing remark (710 chars)
6-unit multifamily investment property offering immediate cash flow and strong upside potential. All units are 2 bedrooms and 1 bathroom. Five of six units are currently occupied. All leases are month to month, providing a new owner with full flexibility to reposition rents or renovate at turnover. Current rents are below market rate with potential to achieve a double-digit cap rate through modest rent increases in line with current market conditions. Located in Frostburg, home to Frostburg State University, supporting consistent rental demand. Ideal for investors seeking a value-add multifamily asset with stabilized occupancy and room to grow. Do not disturb tenants. All showings by appointment only.
-
2018-10-17historical
-
2018-04-24$225,000 Active
-
2008-07-21soldstatus $185,000
-
2008-07-03historical
-
2008-06-27$200,000
ⓘ Source: listings_history table (triggers on properties + properties_extension) + one-shot
backfill from property_details.listing_events for pre-trigger history.
Tax reassessment forecast MD · Partial reset (capped growth)
- Current annual tax
- $1,952 · $163/mo
- Projected year-2 tax
- $2,311 · $193/mo
- Expected delta
- +$359/yr (+$30/mo · 18.4%)
ⓘ Screening estimate from a state-policy table — verify with the county assessor before closing.
Climate risk First Street
- Flood 7/10 Severe FEMA zone X (unshaded) · 76% chance over 30 yrs
- Wildfire 1/10 Low
- Heat 3/10 Moderate 8 d/yr ≥91°F today · 19 d/yr by 30 yrs out
- Wind 2/10 Low
- Air quality 2/10 Low 0 unhealthy d/yr today · 1 by 30 yrs out
Nearby sold comps map
Loading sold comps map…
Walkable amenities ~0.75 mi
Loading nearby amenities…
Taxation est. · year 1
- Rental income
- $68,616
- − Mortgage interest
- −$13,724
- − Property taxes
- −$1,952
- − Insurance
- −$1,892
- − Repairs & maintenance
- −$5,489
- − Management
- −$5,489
- − Depreciation
- −$7,127
- Taxable income
- $32,943
- Est. tax owed @ 24.0%
- −$7,906
- After-tax cash flow
- $27,039/yr
For passive investors: Depreciation is non-cash, so a rental often shows a tax loss while cash-flowing — sheltering income. Rental losses are passive: they offset passive income freely, and up to $25,000/yr can offset ordinary (W-2) income if you actively participate and your MAGI is under $100k (phasing out to $0 by $150k); unused losses carry forward. On sale, claimed depreciation is recaptured at up to 25%, and gains may owe capital-gains tax (a 1031 exchange can defer both). Figures are a year-1 estimate at your 24.0% rate — not tax advice; consult a CPA.
Schools (NCES district)
- District
- Allegany County Public Schools
- NCES district ID
- 2400030
- Math proficiency
- 15% ▼ -26.00%
- Reading proficiency
- 30% ▼ -20.00%
- Median HH income
- $39,760
- Composite
- 18.95/100
- National rank
- #8854
- State rank
- #18 of 24 in MD
Livability — Frostburg
- Score
- 87/100
- State rank
- #7
- US rank
- #287
Category grades
Schools grade is shown separately in the Schools card above.
Census & demographics
- Census place
- Frostburg, MD
- Population (ZIP)
- 13,123
Population outlook (Allegany County) Hauer SSP2
- Today (2025)
- 68,778 people
- By 2030
- 66,766 · -2.9%
- By 2040
- 62,784 · -8.7%
- By 2050
- 59,179 · -14.0%
- By 2075
- 50,732 · -26.2%
- By 2100
- 40,837 · -40.6%
Race, ethnicity, and origin ACS 2023
- Neighborhood character
- Predominantly White (89%)
- Race & ethnicity
- White 89% Black 6% Two or more races 2% Hispanic / Latino 2% Asian 2%
- Common ancestry
- Slovak 5% Romanian 2% Italian 1%
- Foreign-born
- 3% · Canada, China
- Languages at home
- 96% English-only · Spanish 2% Chinese 1%
Political lean MEDSL · Allegany
- 2024 margin
- Solid R (+40.3) · D 28.9% · R 69.2% · Other 2.0%
- 2008→2024 swing
- -14.4pp toward R · 2008: -25.9pp · 2024: -40.3pp
- All cycles
- 2024: R+40.3 2020: R+38.3 2016: R+48.0 2012: R+32.9 2008: R+25.9
Not yet ingested
- Civics
- —
Market trends
- HPI YoY
- ▼ -78.31%
- Current HPI
- 244.5937
- Rent YoY
- —
- Metro
- —
- State GDP YoY
- ▲ 2.97%
- F500 in state
- 12
Industry mix (Fortune 500 HQ in MD)
| Industry | F500 HQs | Revenue |
|---|---|---|
| Aerospace / Defense | 1 | $71B |
|
||
| Utilities | 1 | $25B |
|
||
| Hotels | 1 | $24B |
|
||
| Consumer Goods | 1 | $7B |
|
||
| Real Estate | 1 | $6B |
|
||
| Chemicals | 1 | $2B |
|
||
Price history
+27.5% since first listed8 events — show timeline
- 2026-04-28 Price Changed $255,000 BRIGHT MLS
- 2026-04-07 Price Changed $265,000 BRIGHT MLS
- 2026-03-27 Listed $275,000 BRIGHT MLS
- 2018-10-17 Listing Removed — BRIGHT MLS
- 2018-04-24 Listed $225,000 BRIGHT MLS
- 2008-07-21 Sold (MLS) $185,000 MRIS
- 2008-07-03 Delisted — MRIS
- 2008-06-27 Listed $200,000 MRIS
Property tax history
+0.7%/yrLatest (2025): $1,952 · -0.9% YoY. Source: county tax records.
Cash-flow waterfall
monthlySold comps — $/sqft
last 12 mo · ≤1 miLoading sold comps…