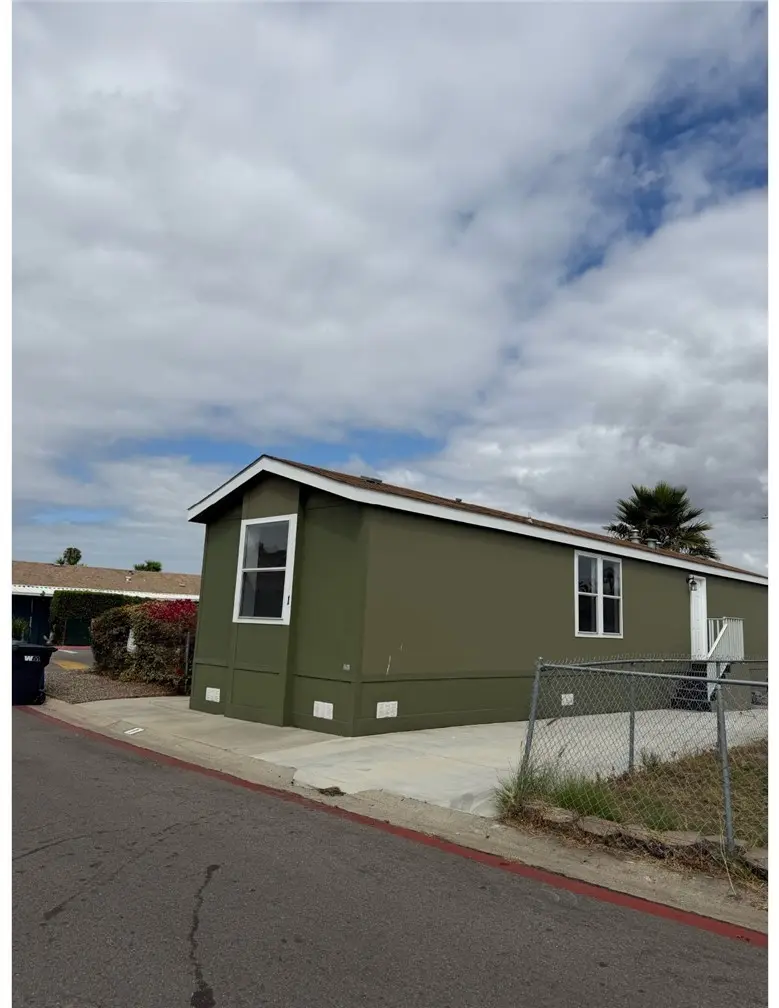
10767 Jamacha Blvd #1 · Spring Valley, CA
Flood risk 1/10 · Minimal
- FEMA flood zone
- X (unshaded)
- Chance of flooding over 30 yrs
- 0.0%
- Est. flood insurance / yr
- $507 – $1,088
Fire risk 7/10 · Major
- Est. fire insurance / yr
- $659 – $1,223
Heat risk 4/10 · Minor
- Hot days now (above 96°F)
- 7 days/yr
- Hot days in 30 yrs
- 19 days/yr
Wind risk 1/10 · Minimal
- Chance of severe wind over 30 yrs
- —
Air-quality risk 3/10 · Minor
- Unhealthy air days now
- 3 days/yr
- Unhealthy air days in 30 yrs
- 3 days/yr
Risk factors via First Street. Map © Google.
Why this score? — see what drove the C+ grade
The composite is a weighted blend of 9 inputs, each scored 0–100. Each bar is that input's sub-score; the figure is the points it added to the 100-point composite (weight × sub-score).
- Cash flow +30.0/30.0
- 1% rule +10.0/10.0
- DSCR +10.0/10.0
- Schools +4.0/10.0
- Livability +3.0/5.0
- Rent growth +2.5/5.0
- Condition / age +2.5/5.0
- ARV discount +0.0/15.0
- Appreciation +0.0/10.0
$149,900
🖨 Deal sheet 📄 Offer letter ✓ Due diligence
Listing remarks MLS
'BANK OWNED' 2000 3bd 2ba Spacious for Single Wide. Split floor plan, drywall, vaulted ceilings, new carpet & paint. New Stove & dishwasher stay! Laminate kitchen counters & island. Inside Laundry room. Forced AC/Heat. Corner lot with big shade trees, tall bushes in front yard for privacy. Shed & wide carport.
Key facts
- Covered parking
- Outdoor space
- Open-concept layout
Tags
Property features AI
Finance
- Other: Lot density approximately 6–10 units per acre; Elevation measured in feet
- HOA & community: Land lease: $1,750
Exterior
- Parking: Located in Lamplight Village (park name)
- Utilities: Public sewer; District/public water
- Home design: Single-story; Entry level: 1; Model: ELS-5614A; Mobile home remains on site
- Construction: Mobile home 14 ft by 56 ft; Living area source: public records; Year built source: public records
- Exterior features: Community pool; Dog park and community park nearby; Located in a community (Lamplight Village)
Interior
- Bathrooms: 2 full bathrooms
- Interior features: Ceiling fan; Main street entry
- Laundry & utility: Laundry in closet; Community laundry
Neighborhood map
What this means for you Summary
Snapshot
- This is a 2-bed/2.0-bath manufactured listed at $150k.
Deal economics
- At list price, monthly cash flow is $912 ($11k/yr) — positive.
- The deal already cash-flows at list — no discount required.
- Meets the 1% rule at list price ($2k rent vs $150k).
- Recommended offer: $148k (1.5% below list) — sets the bar for market timing.
- Cap rate 13.6% vs local median 2.9% in Spring Valley — top-decile yield for the area; either an underpriced asset or a hidden risk that comps aren't pricing in. Stress-test before assuming the spread holds.
Location & tenants
- Location reads 59/100 on livability (#627 in CA) — a working-class tenant base; expect higher turnover. Strengths: commute A+, employment A, housing B+; Watch: schools D+, crime F, amenities F.
- Grossmont Union High (suburban): math 31% / reading 60% proficiency, ranked #173 of 517 in CA (top 34%) — families likely to look elsewhere, expect single-tenant / working-renter base with shorter leases; only 17% free/reduced lunch — higher-income household profile.
- Market conditions: 20 active listings in the ZIP; 3 comparable units currently listed for rent nearby; rentals leasing fast (median 2d on market — plan ~1-2 weeks tenant-placement turnaround); 11,759 units permitted in San Diego County in 2024 (7,244 in 5+ unit buildings).
Forward outlook
- Local home prices are declining (-3.0%/yr); year-one equity from $1k of loan paydown is wiped out by about $4k of value loss. Plan a longer hold.
- San Diego County population projected at +20% by 2050 — long-run rental-demand tailwind backs the buy-and-hold thesis.
- At projected returns (-3.0% appreciation + 3.0% rent growth), your $42k cash investment doubles in ~5 years — after that, you're playing with house money.
Negotiation context
- It's been on market 22 days — a 2% lower offer ($148k) is reasonable based on typical stale-listing flexibility.
- 5 sale attempts since 19y ago with the ask held roughly flat each time — persistent listings suggest the price (not the market) is what's stuck; bring a comps-based counter.
- Current owner paid $28k; list at $150k implies a 435% gain — meaningful room to come down on a strong offer.
Risks & watch-outs
- Climate carrying-cost: major wildfire risk — expect insurance premiums to compound above CPI over the hold.
Questions for the listing agent
- Is there a deadline driving the sale (1031 exchange, divorce, estate, relocation)? That informs how much negotiation room exists.
- Schools are D-rated, which usually means shorter tenancies and higher turnover. Who's the typical renter profile here, and what's been the actual vacancy rate?
- Crime grade is F in this area — have there been break-ins, vandalism, or insurance claims at this property in the last 3 years? What carrier currently insures it and at what premium?
- What's the average days-on-market for RENTAL listings here right now (not sales)? A rising rental-DOM trend means longer vacancies and softer asking-rent achievability than the comps imply.
- What's the recent tenant-quality profile in this submarket — average credit score on applications, eviction rate, late-payment / NSF rate, and stable-employment percentage? A property-management company in the area should have these aggregated.
- How much new for-sale + rental construction is in the pipeline within 1–3 miles? Heavy new supply typically softens prices + rents 12–24 months out; constrained supply supports both.
Investment metrics
- 1% rule
- 1.51% ✓
- Cap rate
- 13.60%
- Cash-on-cash
- 26.08%
- DSCR
- 2.16
- GRM
- 5.5
CMA / ARV
- ARV (on-the-fly)
- $126,243
- Comps found
- 3
Show comp detail 3 sales within ~0.75 mi
| Address | Dist | Beds/Ba | Sqft | Sold | Price | $/sf | Match |
|---|---|---|---|---|---|---|---|
| 10767 Jamacha Blvd #217 | 0.00mi | 2/1.0 | 800 (+7%) | 2mo | $135,000 | $169 | 82 |
| 10707 Jamacha Blvd #72 | 0.20mi | 3/1.0 (+1) | 792 (+6%) | 4mo | $125,000 | $158 | 68 |
| 10707 Jamacha Blvd Spc 55 | 0.12mi | 2/1.0 | 784 (+5%) | 22mo | $172,500 | $220 | 64 |
Match score weights: distance 35% · size 25% · config 20% · recency 20%. Top-matched comps best support the ARV.
Projected returns pro-forma
-3.0% appreciation · 3.0% rent growth · sell at horizon
- IRR
- 19.8%
- Equity multiple
- 1.80×
- Total profit
- $33,745
- Equity at exit
- $22,351
- IRR
- 28.0%
- Equity multiple
- 3.48×
- Total profit
- $103,943
- Equity at exit
- $12,961
Cash invested: $41,972 (down + closing). Projections, not guarantees.
Landlord ↔ Tenant lean methodology
- Overall (STATE)
- 18 Strongly Tenant-Friendly
- State California
- 18 Strongly Tenant-Friendly · D+13
- County
- — inherits STATE
- City
- — inherits STATE
ZIP-level market 91978
- Active inventory
- 20
- Price-to-rent
- 5.5×
Monthly cashflow live
- Estimated rent
- $2,268 medium interval (Pro) →
- Mortgage (P&I)
- −$786
- Tax from tax record
- −$31 /mo · $375/yr
- Insurance
- −$62
- HOA
- −$0
- Vacancy / Maint / Mgmt
- −$476
- Net cashflow
- $912
Break-even live
UW: 25.0% down · 7.5% · 30yr · 1.5% tax · 5.0% vac · 8.0% maint · 8.0% mgmt
Financing live
Cash to close
- Down payment
- $37,475
- Closing costs
- $4,497
- Reserves months
- —
- Total cash needed
- —
Loan-product check · same deal, 3 products live
Conventional
25% down · 7.5% · 30yr
- Down + closing
- —
- Monthly P&I
- —
- Monthly cashflow
- —
- DSCR
- —
- Eligible?
- —
Personal DTI + credit; lowest rate.
DSCR
20% down · 8.5% · 30yr
- Down + closing
- —
- Monthly P&I
- —
- Monthly cashflow
- —
- DSCR
- —
- Eligible?
- —
No personal income docs; deal must DSCR.
Hard money
10% down · 12.0% · 12mo
- Down + closing
- —
- Monthly P&I
- —
- Monthly cashflow
- —
- DSCR
- —
- Eligible?
- —
Short-term bridge; refi at stabilization.
Rent comps 3 comps
| Address | Beds | Baths | Sqft | Rent | $/sqft | DOM | Units | Dist |
|---|---|---|---|---|---|---|---|---|
| 10850 Jamacha Blvd Spring Valley, CA | 1.0–2.0 | 1.0–2.0 | 865 | $2,510 | $2.90 | 2d | 8 | 0.26mi |
| 2956 Elm Tree Ct Spring Valley, CA | 1.0 | 1.0 | 700 | $2,045 | $2.92 | 2d | 1 | 0.27mi |
| 2904 Anawood Way Spring Valley, CA | 1.0 | 1.0 | 700 | $2,250 | $3.21 | 3d | 1 | 0.41mi |
Listing history 25 events
-
2026-06-18days on market $149,900 Active 22 DOM
-
2026-06-17days on market $149,900 Active 21 DOM
-
2026-06-16days on market $149,900 Active 20 DOM
-
2026-06-15days on market $149,900 Active 19 DOM
-
2026-06-13days on market $149,900 Active 17 DOM
-
2026-06-13days on market $149,900 Active 16 DOM
-
2026-06-09days on market $149,900 Active 13 DOM
-
2026-06-08days on market $149,900 Active 12 DOM
-
2026-06-07days on market $149,900 Active 11 DOM
-
2026-06-04days on market $149,900 Active 8 DOM
-
2026-06-03days on market $149,900 Active 7 DOM
-
2026-06-02days on market $149,900 Active 6 DOM
-
2026-06-01days on market $149,900 Active 5 DOM
-
2026-05-31days on market $149,900 Active 4 DOM
-
2026-05-27$149,900 Active
-
2025-02-01historical
-
2025-01-04price $150,000
-
2025-01-04status Active
-
2025-01-02status Pending Sale
-
2024-12-13price $148,000
-
2024-11-05status Active
-
2024-09-25status Pending Sale
-
2024-08-27$150,000 Active
-
2008-02-27soldstatus $28,000 335-char remark
Show marketing remark (335 chars)
'BANK OWNED' 2000 3bd 2ba Spacious for Single Wide. Split floor plan, drywall, vaulted ceilings, new carpet & paint. New Stove & dishwasher stay! Laminate kitchen counters & island. Inside Laundry room. Forced AC/Heat. Corner lot with big shade trees, tall bushes in front yard for privacy. Shed & wide carport.
-
2007-08-02$35,000 335-char remark
Show marketing remark (335 chars)
'BANK OWNED' 2000 3bd 2ba Spacious for Single Wide. Split floor plan, drywall, vaulted ceilings, new carpet & paint. New Stove & dishwasher stay! Laminate kitchen counters & island. Inside Laundry room. Forced AC/Heat. Corner lot with big shade trees, tall bushes in front yard for privacy. Shed & wide carport.
ⓘ Source: listings_history table (triggers on properties + properties_extension) + one-shot
backfill from property_details.listing_events for pre-trigger history.
Tax reassessment forecast CA · Resets to sale price
- Current annual tax
- $375 · $31/mo
- Projected year-2 tax
- $1,139 · $95/mo
- Expected delta
- +$764/yr (+$64/mo · 203.8%)
ⓘ Screening estimate from a state-policy table — verify with the county assessor before closing.
Climate risk First Street
- Flood 1/10 Low FEMA zone X (unshaded) · 0% chance over 30 yrs
- Wildfire 7/10 Severe
- Heat 4/10 Moderate 7 d/yr ≥96°F today · 19 d/yr by 30 yrs out
- Wind 1/10 Low
- Air quality 3/10 Moderate 3 unhealthy d/yr today · 3 by 30 yrs out
Nearby sold comps map
Loading sold comps map…
Walkable amenities ~0.75 mi
Loading nearby amenities…
Taxation est. · year 1
- Rental income
- $27,220
- − Mortgage interest
- −$8,397
- − Property taxes
- −$375
- − Insurance
- −$750
- − Repairs & maintenance
- −$2,178
- − Management
- −$2,178
- − Depreciation
- −$4,361
- Taxable income
- $8,983
- Est. tax owed @ 24.0%
- −$2,156
- After-tax cash flow
- $8,790/yr
For passive investors: Depreciation is non-cash, so a rental often shows a tax loss while cash-flowing — sheltering income. Rental losses are passive: they offset passive income freely, and up to $25,000/yr can offset ordinary (W-2) income if you actively participate and your MAGI is under $100k (phasing out to $0 by $150k); unused losses carry forward. On sale, claimed depreciation is recaptured at up to 25%, and gains may owe capital-gains tax (a 1031 exchange can defer both). Figures are a year-1 estimate at your 24.0% rate — not tax advice; consult a CPA.
Schools (NCES district)
- District
- Grossmont Union High
- NCES district ID
- 0616230
- Math proficiency
- 31% ▼ -1.00%
- Reading proficiency
- 60% ▲ 5.00%
- Median HH income
- $61,801
- Composite
- 40.07/100
- National rank
- #3810
- State rank
- #173 of 517 in CA
Livability — Spring Valley
- Score
- 59/100
- State rank
- #627
- US rank
- #19882
Category grades
Schools grade is shown separately in the Schools card above.
Census & demographics
- Census place
- Spring Valley, CA
- City population
- 61,064
- Population (ZIP)
- 10,511
Population outlook (San Diego County) Hauer SSP2
- Today (2025)
- 3,678,185 people
- By 2030
- 3,856,546 · +4.8%
- By 2040
- 4,171,407 · +13.4%
- By 2050
- 4,421,607 · +20.2%
- By 2075
- 4,831,599 · +31.4%
- By 2100
- 4,832,502 · +31.4%
Race, ethnicity, and origin ACS 2023
- Neighborhood character
- Diverse neighborhood (Simpson 0.70)
- Race & ethnicity
- White 39% Hispanic / Latino 37% Two or more races 19% Black 11% Asian 6%
- Hispanic origin (detail)
- Mexican 28% Dominican 4%
- Common ancestry
- Arab 4% Romanian 1% Portuguese 1%
- Foreign-born
- 22% · Canada, South Korea
- Languages at home
- 57% English-only · Spanish 30% Arabic 3% Other Asian/Pacific 3%
Political lean MEDSL · San Diego
- 2024 margin
- D (+16.8) · D 56.9% · R 40.1% · Other 2.9%
- 2008→2024 swing
- +6.6pp toward D · 2008: 10.2pp · 2024: 16.8pp
- All cycles
- 2024: D+16.8 2020: D+22.8 2016: D+17.8 2012: D+5.1 2008: D+10.2
Not yet ingested
- Civics
- —
Market trends
- HPI YoY
- ▼ -341.95%
- Current HPI
- 330.6808
- Rent YoY
- —
- Metro
- —
- State GDP YoY
- ▲ 3.21%
- F500 in state
- 116
Industry mix (Fortune 500 HQ in CA)
| Industry | F500 HQs | Revenue |
|---|---|---|
| Technology | 27 | $1,492B |
|
||
| Financial Services | 3 | $174B |
|
||
| Retail | 3 | $44B |
|
||
| Insurance | 3 | $26B |
|
||
| Media / Entertainment | 2 | $115B |
|
||
| Pharmaceuticals / Biotech | 2 | $62B |
|
||
Price history
+328.3% since first listed11 events — show timeline
- 2026-05-27 Listed $149,900 CRMLS
- 2025-02-01 Listing Removed — CRMLS
- 2025-01-04 Price Changed $150,000 CRMLS
- 2025-01-04 Relisted — CRMLS
- 2025-01-02 Pending — CRMLS
- 2024-12-13 Price Changed $148,000 CRMLS
- 2024-11-05 Relisted — CRMLS
- 2024-09-25 Pending — CRMLS
- 2024-08-27 Listed $150,000 CRMLS
- 2008-02-27 Sold (MLS) $28,000 CRMLS
- 2007-08-02 Listed $35,000 CRMLS
Property tax history
-8.2%/yrLatest (2013): $375 · +5.2% YoY. Source: county tax records.
Cash-flow waterfall
monthlySold comps — $/sqft
last 12 mo · ≤1 miLoading sold comps…