 Multi-family
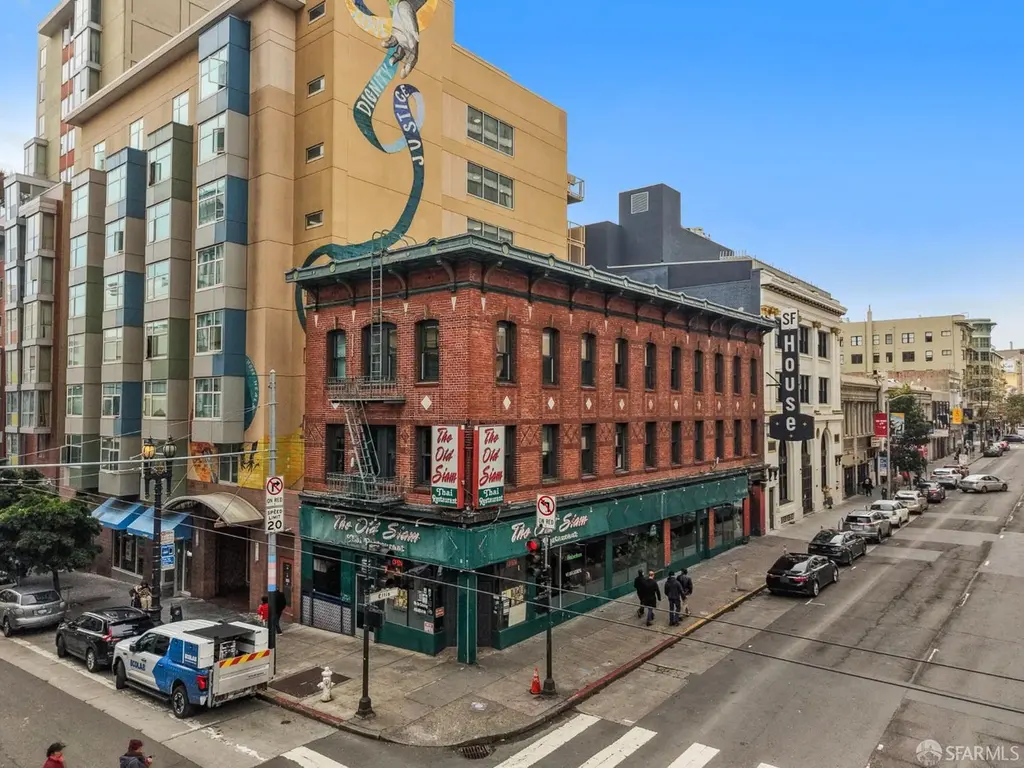
225 Ellis St · San Francisco, CA
Flood risk No data
- FEMA flood zone
- —
- Chance of flooding over 30 yrs
- —
- Est. flood insurance / yr
- —
Fire risk No data
- Est. fire insurance / yr
- —
Heat risk No data
- Hot days now (above threshold)
- —
- Hot days in 30 yrs
- —
Wind risk No data
- Chance of severe wind over 30 yrs
- —
Air-quality risk No data
- Unhealthy air days now
- —
- Unhealthy air days in 30 yrs
- —
Risk factors via First Street. Map © Google.
Why this score? — see what drove the A- grade
The composite is a weighted blend of 9 inputs, each scored 0–100. Each bar is that input's sub-score; the figure is the points it added to the 100-point composite (weight × sub-score).
- Cash flow +30.0/30.0
- DSCR +10.0/10.0
- 1% rule +9.1/10.0
- ARV discount +7.5/15.0
- Appreciation +7.4/10.0
- Rent growth +5.0/5.0
- Schools +5.0/10.0
- Livability +3.8/5.0
- Condition / age +3.8/5.0
$3,980,000
🖨 Deal sheet (PDF) 📄 Offer letter ✓ Due diligence
Multi-family units
County records classify this as Multi-Family (5+ Unit). Listing-text estimate: 1 unit. estimate disagrees with records
5+ unit building — per-unit beds/baths from public records are typically unavailable; the breakdown below (if shown) is an estimate from the listing text.
Listing remarks MLS
Marcus & Millichap is pleased to offer a unique multifamily investment opportunity in Downtown San Francisco, California - 225 Ellis. This 16 room SRO has undergone substantial remodeling and comes with a ground floor retail which is well positioned to benefit from San Francisco's gradual recovery in tourism and business travel. Just steps away from the city's primary business districts, 225 Ellis offers a compelling option for both business and leisure guests. Its central location provides easy access to public transit and top attractions, including Union Square, the Golden Gate Bridge and Fisherman's Wharf, as well as a wide range of dining, shopping and cultural experiences nearby. 225 Ellis is set to attract a diverse clientele in the heart of San Francisco just steps away from iconic Union Square
Key facts
- Central location
- Ground floor retail
- Top attractions
Tags
Neighborhood map
What this means for you Summary
Snapshot
- This is a multifamily listed at $3.98M. Condition is rated good.
Deal economics
- At list price, monthly cash flow is $17k ($201k/yr) — positive.
- The deal already cash-flows at list — no discount required.
- Meets the 1% rule at list price ($56k rent vs $3.98M).
- Recommended offer: $3.62M (9.0% below list) — sets the bar for market timing.
- Cap rate 11.3% vs local median 2.1% in San Francisco — top-decile yield for the area; either an underpriced asset or a hidden risk that comps aren't pricing in. Stress-test before assuming the spread holds.
Location & tenants
- Location reads 76/100 on livability (#90 in CA, #3,143 nationally) — a middle-class / working-renter tenant base. Strengths: amenities A+, commute A+, employment A+; Watch: crime F, cost of living F.
- San Francisco Unified (urban): math 50% / reading 56% proficiency, ranked #322 of 1,400 in CA (top 23%) — acceptable for families but not a draw, mixed tenant base, ~2y average lease.
- Market conditions: Rents rising fast (+10.1%/yr); 63 active listings in the ZIP; 1 comparable units currently listed for rent nearby; 750 units permitted in San Francisco County in 2024 (688 in 5+ unit buildings).
- At $56,019/mo this rent would consume 1112% of the median local household income ($60k/yr) (locally 3769% of renters already pay >50% of income on rent) — very limited rent-growth headroom before tenants either downsize or default.
Forward outlook
- In year one you build about $218k of equity ($28k loan paydown + $191k appreciation (4.8% local appreciation)).
- San Francisco County population projected at +39% by 2050 — long-run rental-demand tailwind backs the buy-and-hold thesis.
- At projected returns (4.8% appreciation + 8.0% rent growth), your $1.11M cash investment doubles in ~3 years — after that, you're playing with house money.
- By year 2, paydown + projected appreciation supports a ~$350k cash-out refi (75% LTV) — recoverable capital for the next deal without selling this one.
Negotiation context
- It's been on market 118 days — a 9% lower offer ($3.62M) is reasonable based on typical stale-listing flexibility.
- 2 sale attempts; this cycle's ask is 198900% above the opening price — seller raised mid-cycle; expect resistance to lowballs.
Risks & watch-outs
- Watch-outs: built in 1910 — expect roof / HVAC / electrical / plumbing capex.
Questions for the listing agent
- It's been on market 118 days. Have you received any prior offers? Is the seller open to a 9% concession, seller financing, or rate buy-down credit?
- Built in 1910 — when were the roof, HVAC, electrical panel, plumbing, and water heater last replaced?
- Why hasn't it sold? Are there any deal-killer items the seller is aware of (foundation, flood, title, zoning, code violations)?
- Is there a deadline driving the sale (1031 exchange, divorce, estate, relocation)? That informs how much negotiation room exists.
- Schools are B-rated — typically a magnet for longer-tenancy family renters. What's the average tenant stay here, and is there a school-zone premium baked into asking?
- Crime grade is F in this area — have there been break-ins, vandalism, or insurance claims at this property in the last 3 years? What carrier currently insures it and at what premium?
- What's the average days-on-market for RENTAL listings here right now (not sales)? A rising rental-DOM trend means longer vacancies and softer asking-rent achievability than the comps imply.
- What's the recent tenant-quality profile in this submarket — average credit score on applications, eviction rate, late-payment / NSF rate, and stable-employment percentage? A property-management company in the area should have these aggregated.
- How much new apartment / multifamily construction is in the pipeline within 1–3 miles? Heavy new supply (>2% of stock underway) typically softens rents 12–24 months out; light construction supports rent growth.
Investment metrics
- 1% rule
- 1.41% ✓
- Cap rate
- 11.34%
- Cash-on-cash
- 18.04%
- DSCR
- 1.80
- GRM
- 5.9
CMA / ARV
- ARV (median comp)
- $2,232,626
- List price
- $3,980,000
- Delta
- 78.27%
- Verdict
- OVERPRICED
- Comps
- 20 within 1.0 mi
Show comp detail 9 sales within ~0.75 mi
| Address | Dist | Beds/Ba | Sqft | Sold | Price | $/sf | Match |
|---|---|---|---|---|---|---|---|
| 974-980 Sutter St | 0.43mi | 6/— | 6,330 (-4%) | 1mo | $1,095,000 | $173 | 73 |
| 1441-1447 Sacramento St | 0.59mi | 14/4.0 | 6,747 (+3%) | 3mo | $3,625,000 | $537 | 65 |
| 417-419 Hyde St | 0.36mi | —/— | 6,252 (-5%) | 12mo | $1,103,000 | $176 | 65 |
| 1272-1276 California St | 0.53mi | 9/3.0 | 6,816 (+4%) | 8mo | $2,500,000 | $367 | 63 |
| 1645-1649 Sacramento St | 0.70mi | 12/3.0 | 6,386 (-3%) | 5mo | $2,125,500 | $333 | 58 |
| 1108-1112 Pine St | 0.45mi | 9/3.0 | 5,655 (-14%) | 6mo | $2,050,000 | $363 | 51 |
| 1075 Ofarrell St | 0.69mi | 1/— | 6,075 (-8%) | 7mo | $1,793,750 | $295 | 50 |
| 1424 Jones St | 0.70mi | 12/1.0 | 7,075 (+8%) | 12mo | $1,950,000 | $276 | 45 |
| 949-953 Leavenworth St | 0.47mi | 9/3.0 | 5,685 (-13%) | 17mo | $2,250,000 | $396 | 42 |
Match score weights: distance 35% · size 25% · config 20% · recency 20%. Top-matched comps best support the ARV.
Projected returns pro-forma
4.8% appreciation · 8.0% rent growth · sell at horizon
- IRR
- 31.4%
- Equity multiple
- 3.01×
- Total profit
- $2,235,094
- Equity at exit
- $2,206,525
- IRR
- 32.6%
- Equity multiple
- 6.89×
- Total profit
- $6,569,252
- Equity at exit
- $3,768,342
Cash invested: $1,114,400 (down + closing). Projections, not guarantees.
Landlord ↔ Tenant lean methodology
- Overall (CITY)
- 0 Strongly Tenant-Friendly
- State California
- 18 Strongly Tenant-Friendly · D+13
- County
- — inherits STATE
- City San Francisco
- 0 Strongly Tenant-Friendly · D+57
ZIP-level market 94102
- Home prices YoY
- 2.7%
- Rents YoY
- 10.1%
- Active inventory
- 63
- Price-to-rent
- 94.7×
Monthly cashflow live
- Estimated rent
- $56,019 high interval (Pro) →
- Mortgage (P&I)
- −$20,872
- Tax est. 1.5%
- −$4,975 /mo · $59,700/yr
- Insurance
- −$1,658
- HOA
- −$0
- Vacancy / Maint / Mgmt
- −$11,764
- Net cashflow
- $16,750
Break-even live
Sensitivity live
| Price | -10% $19,501 | -5% $18,125 | +0% $16,750 | +5% $15,375 | +10% $14,000 |
|---|---|---|---|---|---|
| Rent | -10% $12,325 | -5% $14,537 | +0% $16,750 | +5% $18,963 | +10% $21,176 |
| Rate | -1.0pp $18,754 | -0.5pp $17,762 | base $16,750 | +0.5pp $15,719 | +1.0pp $14,670 |
16-unit breakdown (identical units grouped — click to expand)
| Units | Beds | Baths | Est. rent |
|---|---|---|---|
| 16× units | 0 | 0 | $56,016 |
| #1 | 0 | 0 | $3,501 |
| #2 | 0 | 0 | $3,501 |
| #3 | 0 | 0 | $3,501 |
| #4 | 0 | 0 | $3,501 |
| #5 | 0 | 0 | $3,501 |
| #6 | 0 | 0 | $3,501 |
| #7 | 0 | 0 | $3,501 |
| #8 | 0 | 0 | $3,501 |
| #9 | 0 | 0 | $3,501 |
| #10 | 0 | 0 | $3,501 |
| #11 | 0 | 0 | $3,501 |
| #12 | 0 | 0 | $3,501 |
| #13 | 0 | 0 | $3,501 |
| #14 | 0 | 0 | $3,501 |
| #15 | 0 | 0 | $3,501 |
| #16 | 0 | 0 | $3,501 |
| Total (16 units) | $56,019 | ||
UW: 25.0% down · 7.5% · 30yr · 1.5% tax · 5.0% vac · 8.0% maint · 8.0% mgmt
Financing live
Cash to close
- Down payment
- $995,000
- Closing costs
- $119,400
- Reserves months
- —
- Total cash needed
- —
Loan-product check · same deal, 3 products live
Conventional
25% down · 7.5% · 30yr
- Down + closing
- —
- Monthly P&I
- —
- Monthly cashflow
- —
- DSCR
- —
- Eligible?
- —
Personal DTI + credit; lowest rate.
DSCR
20% down · 8.5% · 30yr
- Down + closing
- —
- Monthly P&I
- —
- Monthly cashflow
- —
- DSCR
- —
- Eligible?
- —
No personal income docs; deal must DSCR.
Hard money
10% down · 12.0% · 12mo
- Down + closing
- —
- Monthly P&I
- —
- Monthly cashflow
- —
- DSCR
- —
- Eligible?
- —
Short-term bridge; refi at stabilization.
Rent comps 1 comps
| Address | Beds | Baths | Sqft | Rent | $/sqft | DOM | Units | Dist |
|---|---|---|---|---|---|---|---|---|
| 14 Isis St Unit 4 San Francisco, CA | 1.0 | 1.0 | 5526 | $3,200 | $0.58 | 45d | 1 | 1.03mi |
Listing history 18 events
-
2026-06-21days on market $3,980,000 Active 118 DOM
-
2026-06-18days on market $3,980,000 Active 115 DOM
-
2026-06-17days on market $3,980,000 Active 114 DOM
-
2026-06-16days on market $3,980,000 Active 113 DOM
-
2026-06-15days on market $3,980,000 Active 112 DOM
-
2026-06-13days on market $3,980,000 Active 110 DOM
-
2026-06-13days on market $3,980,000 Active 109 DOM
-
2026-06-09days on market $3,980,000 Active 106 DOM
-
2026-06-08days on market $3,980,000 Active 105 DOM
-
2026-06-07days on market $3,980,000 Active 104 DOM
-
2026-06-04days on market $3,980,000 Active 101 DOM
-
2026-06-03days on market $3,980,000 Active 100 DOM
-
2026-06-02days on market $3,980,000 Active 99 DOM
-
2026-06-01days on market $3,980,000 Active 98 DOM
-
2026-05-31days on market $3,980,000 Active 97 DOM
-
2026-05-12$2,000
-
2026-03-02price $3,980,000 818-char remark
Show marketing remark (818 chars)
Marcus & Millichap is pleased to offer a unique multifamily investment opportunity in Downtown San Francisco, California - 225 Ellis. This 16 room SRO has undergone substantial remodeling and comes with a ground floor retail which is well positioned to benefit from San Francisco's gradual recovery in tourism and business travel. Just steps away from the city's primary business districts, 225 Ellis offers a compelling option for both business and leisure guests. Its central location provides easy access to public transit and top attractions, including Union Square, the Golden Gate Bridge and Fisherman's Wharf, as well as a wide range of dining, shopping and cultural experiences nearby. 225 Ellis is set to attract a diverse clientele in the heart of San Francisco just steps away from iconic Union Square
-
2026-02-23$4,200,000 Active 818-char remark
Show marketing remark (818 chars)
Marcus & Millichap is pleased to offer a unique multifamily investment opportunity in Downtown San Francisco, California - 225 Ellis. This 16 room SRO has undergone substantial remodeling and comes with a ground floor retail which is well positioned to benefit from San Francisco's gradual recovery in tourism and business travel. Just steps away from the city's primary business districts, 225 Ellis offers a compelling option for both business and leisure guests. Its central location provides easy access to public transit and top attractions, including Union Square, the Golden Gate Bridge and Fisherman's Wharf, as well as a wide range of dining, shopping and cultural experiences nearby. 225 Ellis is set to attract a diverse clientele in the heart of San Francisco just steps away from iconic Union Square
ⓘ Source: listings_history table (triggers on properties + properties_extension) + one-shot
backfill from property_details.listing_events for pre-trigger history.
Nearby sold comps map
Loading sold comps map…
Walkable amenities ~0.75 mi
Loading nearby amenities…
Taxation est. · year 1
- Rental income
- $672,228
- − Mortgage interest
- −$222,942
- − Property taxes
- −$59,700
- − Insurance
- −$19,900
- − Repairs & maintenance
- −$53,778
- − Management
- −$53,778
- − Depreciation
- −$115,782
- Taxable income
- $146,348
- Est. tax owed @ 24.0%
- −$35,123
- After-tax cash flow
- $165,878/yr
For passive investors: Depreciation is non-cash, so a rental often shows a tax loss while cash-flowing — sheltering income. Rental losses are passive: they offset passive income freely, and up to $25,000/yr can offset ordinary (W-2) income if you actively participate and your MAGI is under $100k (phasing out to $0 by $150k); unused losses carry forward. On sale, claimed depreciation is recaptured at up to 25%, and gains may owe capital-gains tax (a 1031 exchange can defer both). Figures are a year-1 estimate at your 24.0% rate — not tax advice; consult a CPA.
Condition & rehab AI · 11 photos
This multifamily property in San Francisco's downtown area is in good condition with a good rehab level. It offers a unique investment opportunity with a ground floor retail and easy access to top attractions. Consider landscaping and interior updates to further enhance its value.
Value-add opportunities
- Both Landscaping and curb appeal improvements — Enhances curb appeal and can attract more tenants.
- Resale Modernize kitchen appliances — Upgrades can increase the home's appeal to potential buyers.
- Resale Paint interior walls — Fresh paint can make the home more appealing to buyers.
- Resale Upgrade lighting fixtures — Modern lighting can enhance the home's appeal and energy efficiency.
- Rental Install smart home technology — Can attract tech-savvy tenants and improve energy efficiency.
Renovation cost estimate screening
Value-add ROI direction
- Both Landscaping and curb appeal improvements — Enhances curb appeal and can attract more tenants. ↑
- Resale Modernize kitchen appliances — Upgrades can increase the home's appeal to potential buyers. ↑
- Resale Paint interior walls — Fresh paint can make the home more appealing to buyers. ↑
- Resale Upgrade lighting fixtures — Modern lighting can enhance the home's appeal and energy efficiency. ↑
- Rental Install smart home technology — Can attract tech-savvy tenants and improve energy efficiency. ↑
ⓘ Cost ranges are severity-bucket heuristics (US national rule-of-thumb). Get contractor quotes + a written scope before underwriting a rehab budget.
Schools (NCES district)
- District
- San Francisco Unified
- NCES district ID
- 0634410
- Math proficiency
- 50% ▬ 0.00%
- Reading proficiency
- 56% ▲ 1.00%
- Median HH income
- $81,249
- Composite
- 50.14/100
- National rank
- #4088
- State rank
- #322 of 1400 in CA
Livability — San Francisco
- Score
- 76/100
- State rank
- #90
- US rank
- #3143
Category grades
Schools grade is shown separately in the Schools card above.
Census & demographics
- Census place
- San Francisco, CA
- County
- San Francisco County · 827,552 people
- City population
- 827,552
- Metro
- San Francisco-Oakland-Berkeley, CA
- Population (ZIP)
- 35,976
- Household income
- $60,431
- Rent vs Own
- Severe rent burden
- 3769.0
Population outlook (San Francisco County) Hauer SSP2
- Today (2025)
- 1,030,936 people
- By 2030
- 1,110,409 · +7.7%
- By 2040
- 1,270,010 · +23.2%
- By 2050
- 1,435,001 · +39.2%
- By 2075
- 1,779,074 · +72.6%
- By 2100
- 1,966,767 · +90.8%
Race, ethnicity, and origin ACS 2023
- Neighborhood character
- Highly diverse neighborhood (Simpson 0.77)
- Race & ethnicity
- White 31% Asian 28% Hispanic / Latino 22% Two or more races 13% Black 9% Native American 2%
- Hispanic origin (detail)
- Mexican 15% Puerto Rican 1%
- Common ancestry
- Scotch-Irish 2% Romanian 2% Lithuanian 2%
- Foreign-born
- 41% · Canada, China, Vietnam
- Languages at home
- 52% English-only · Spanish 16% Chinese 10% Vietnamese 5%
Political lean MEDSL · San Francisco
- 2024 margin
- Solid D (+64.8) · D 80.3% · R 15.5% · Other 4.1%
- 2008→2024 swing
- -5.7pp toward R · 2008: 70.5pp · 2024: 64.8pp
- All cycles
- 2024: D+64.8 2020: D+72.5 2016: D+76.1 2012: D+70.2 2008: D+70.5
Not yet ingested
- Civics
- —
Market trends
- HPI YoY
- ▲ 4.80%
- Current HPI
- 184.4403
- Rent YoY
- ▲ 10.11%
- Metro
- San Francisco-Oakland-Berkeley, CA
- State GDP YoY
- ▲ 3.21%
- F500 in state
- 116
Industry mix (Fortune 500 HQ in CA)
| Industry | F500 HQs | Revenue |
|---|---|---|
| Technology | 27 | $1,492B |
|
||
| Financial Services | 3 | $174B |
|
||
| Retail | 3 | $44B |
|
||
| Insurance | 3 | $26B |
|
||
| Media / Entertainment | 2 | $115B |
|
||
| Pharmaceuticals / Biotech | 2 | $62B |
|
||
Price history
-100.0% since first listed3 events — show timeline
- 2026-05-12 Listed for Rent $2,000 SHOWMOJO
- 2026-03-02 Price Changed $3,980,000 San Francisco MLS
- 2026-02-23 Listed $4,200,000 San Francisco MLS
Cash-flow waterfall
monthlySold comps — $/sqft
last 12 mo · ≤1 miLoading sold comps…