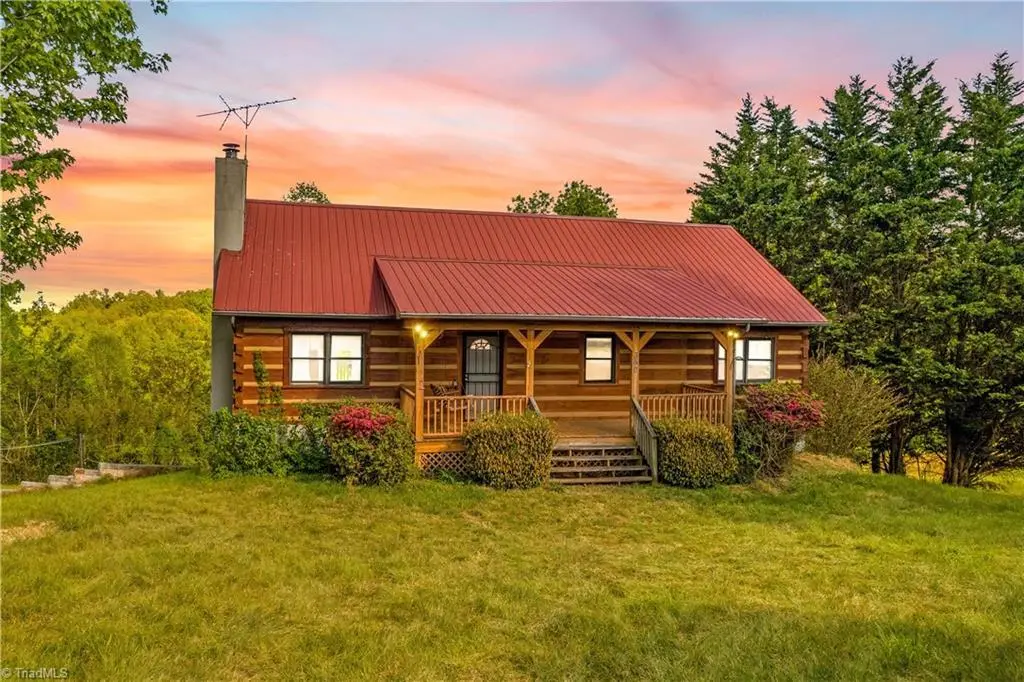
360 Orchard Rd · Moravian Falls, NC
Flood risk 1/10 · Minimal
- FEMA flood zone
- X (unshaded)
- Chance of flooding over 30 yrs
- 0.0%
- Est. flood insurance / yr
- $473 – $860
Fire risk 5/10 · Moderate
- Est. fire insurance / yr
- $906 – $1,684
Heat risk 3/10 · Minor
- Hot days now (above 94°F)
- 7 days/yr
- Hot days in 30 yrs
- 18 days/yr
Wind risk 2/10 · Minimal
- Chance of severe wind over 30 yrs
- 1.0%
Air-quality risk 1/10 · Minimal
- Unhealthy air days now
- 0 days/yr
- Unhealthy air days in 30 yrs
- 0 days/yr
Risk factors via First Street. Map © Google.
Why this score? — see what drove the D grade
The composite is a weighted blend of 9 inputs, each scored 0–100. Each bar is that input's sub-score; the figure is the points it added to the 100-point composite (weight × sub-score).
- Appreciation +10.0/10.0
- Cash flow +8.1/30.0
- ARV discount +7.5/15.0
- Schools +4.3/10.0
- Livability +3.2/5.0
- Rent growth +2.5/5.0
- Condition / age +2.5/5.0
- DSCR +2.2/10.0
- 1% rule +1.6/10.0
$190,000
🖨 Deal sheet (PDF) 📄 Offer letter ✓ Due diligence
Listing remarks
3BR/2.5BA home on 2.80 acres in Moravian Falls offering a 1 story layout w/ basement and attached 2 car garage. Built in 1994, this property features 1,344 sqft on main level with additional basement space providing expansion potential. Exterior showcases log and wood finishes in a private rural setting with well and septic in place. Home currently has no central HVAC, presenting an opportunity for renovation or customization to suit buyer needs. Interior includes primary bedroom on main level, functional floor plan, and multiple bath configurations including basement full bath. Located outside of a subdivision with no deed restrictions, this property offers flexibility for personal use or
Key facts
- 2.8 acre lot
- 2 garage spots
- Built 1994
Property features AI
Finance
- HOA & community: No homeowners association
Exterior
- Parking: Attached garage with 2 garage spaces
- Utilities: Well water source; Septic tank sewer; Electric water heater
- Home design: Residential stick/site-built house; One story
- Construction: Built in 1994; Log and wood siding construction
- Exterior features: Approximately 2.8-acre lot; Publicly maintained road access; Well water
Interior
- Kitchen: Electric water heater listed among appliances
- Bedrooms: Primary on main
- Bathrooms: 2 full bathrooms; 1 half bathroom
- Heating & cooling: Baseboard heating; Propane heating (Propane gas fuel); Attic fan; Window air conditioning units
- Interior features: Primary bedroom located on the main level; Unfinished basement
- Laundry & utility: Electric water heater
Neighborhood map
What this means for you Summary
Snapshot
- This is a 3-bed/2.5-bath single-family listed at $190k.
Deal economics
- At list price, monthly cash flow is $-182 ($-2k/yr) — negative.
- To cash-flow at today's rent, offer at most $158k (17.0% below list).
- To meet the 1% rule (rent ≥ 1% of price), the offer needs to be $126k (33.6% below list).
- Recommended offer: $126k (33.6% below list) — sets the bar for 1% rule.
- Cap rate 5.1% vs local median 2.1% in Moravian Falls — top-decile yield for the area; either an underpriced asset or a hidden risk that comps aren't pricing in. Stress-test before assuming the spread holds.
Location & tenants
- Location reads 64/100 on livability (#366 in NC) — a middle-class / working-renter tenant base. Strengths: crime A+, cost of living A+, housing A+; Watch: employment D, amenities F, commute F.
- Wilkes County Schools (rural): math 55% / reading 50% proficiency, ranked #59 of 178 in NC (top 33%) — acceptable for families but not a draw, mixed tenant base, ~2y average lease.
- Zoned schools: Wilkesboro Elementary School (math 57% / reading 42%, grade D, #417 of 1,410 statewide, top 32%, 370 students, 99% FRL); Central Wilkes Middle School (math 42% / reading 44%, grade D-, #191 of 475 statewide, top 41%, 576 students, 99% FRL); Wilkes Central High School (math 42% / reading 57%, grade D, #311 of 535 statewide, top 60%, 752 students, 54% FRL) — zoned schools average 84% FRL vs 56% district-wide (28 pts higher); higher-poverty schools than district average — tighter screening recommended.
- Market conditions: 51 active listings in the ZIP; 134 units permitted in Wilkes County in 2024 (0 in 5+ unit buildings).
Forward outlook
- In year one you build about $20k of equity ($1k loan paydown + $19k appreciation (10.0% local appreciation)).
- Wilkes County population projected at -18% by 2050 — secular population decline; favor cash flow + early exit over multi-decade hold.
- By year 2, paydown + projected appreciation supports a ~$33k cash-out refi (75% LTV) — recoverable capital for the next deal without selling this one.
Negotiation context
- It's been on market 15 days — a 2% lower offer ($187k) is reasonable based on typical stale-listing flexibility.
Risks & watch-outs
- Climate carrying-cost: moderate wildfire risk — expect insurance premiums to compound above CPI over the hold.
Questions for the listing agent
- What do current leases actually rent for vs. the listed asking? Can we see a recent rent roll and the last 12 months of T-12 income?
- Is there a deadline driving the sale (1031 exchange, divorce, estate, relocation)? That informs how much negotiation room exists.
- Schools are D-rated, which usually means shorter tenancies and higher turnover. Who's the typical renter profile here, and what's been the actual vacancy rate?
- The area grade is low — what's the realistic commute time and amenity access for the typical tenant pool here? Any planned neighborhood developments (good or bad) we should know about?
- What's the average days-on-market for RENTAL listings here right now (not sales)? A rising rental-DOM trend means longer vacancies and softer asking-rent achievability than the comps imply.
- What's the recent tenant-quality profile in this submarket — average credit score on applications, eviction rate, late-payment / NSF rate, and stable-employment percentage? A property-management company in the area should have these aggregated.
- How much new for-sale + rental construction is in the pipeline within 1–3 miles? Heavy new supply typically softens prices + rents 12–24 months out; constrained supply supports both.
Investment metrics
- 1% rule
- 0.66% ✗
- Cap rate
- 5.14%
- Cash-on-cash
- -4.11%
- DSCR
- 0.82
- GRM
- 12.5
CMA / ARV
No comps found within radius.
Projected returns pro-forma
10.0% appreciation · 3.0% rent growth · sell at horizon
- IRR
- 21.3%
- Equity multiple
- 2.73×
- Total profit
- $91,802
- Equity at exit
- $171,167
- IRR
- 19.3%
- Equity multiple
- 6.25×
- Total profit
- $279,349
- Equity at exit
- $369,128
Cash invested: $53,200 (down + closing). Projections, not guarantees.
Landlord ↔ Tenant lean methodology
- Overall (STATE)
- 85 Strongly Landlord-Friendly
- State North Carolina
- 85 Strongly Landlord-Friendly · R+3
- County
- — inherits STATE
- City
- — inherits STATE
ZIP-level market 28654
- Home prices YoY
- 13.3%
- Active inventory
- 51
- Price-to-rent
- 12.5×
Monthly cashflow live
- Estimated rent
- $1,262 medium interval (Pro) →
- Mortgage (P&I)
- −$996
- Tax from tax record
- −$104 /mo · $1,249/yr
- Insurance
- −$79
- HOA
- −$0
- Vacancy / Maint / Mgmt
- −$265
- Net cashflow
- $-182
Break-even live
Sensitivity live
| Price | -10% $-75 | -5% $-129 | +0% $-182 | +5% $-236 | +10% $-290 |
|---|---|---|---|---|---|
| Rent | -10% $-282 | -5% $-232 | +0% $-182 | +5% $-132 | +10% $-83 |
| Rate | -1.0pp $-87 | -0.5pp $-134 | base $-182 | +0.5pp $-232 | +1.0pp $-282 |
UW: 25.0% down · 7.5% · 30yr · 1.5% tax · 5.0% vac · 8.0% maint · 8.0% mgmt
Financing live
Cash to close
- Down payment
- $47,500
- Closing costs
- $5,700
- Reserves months
- —
- Total cash needed
- —
Loan-product check · same deal, 3 products live
Conventional
25% down · 7.5% · 30yr
- Down + closing
- —
- Monthly P&I
- —
- Monthly cashflow
- —
- DSCR
- —
- Eligible?
- —
Personal DTI + credit; lowest rate.
DSCR
20% down · 8.5% · 30yr
- Down + closing
- —
- Monthly P&I
- —
- Monthly cashflow
- —
- DSCR
- —
- Eligible?
- —
No personal income docs; deal must DSCR.
Hard money
10% down · 12.0% · 12mo
- Down + closing
- —
- Monthly P&I
- —
- Monthly cashflow
- —
- DSCR
- —
- Eligible?
- —
Short-term bridge; refi at stabilization.
Listing history 2 events
-
2026-05-07status Pending
-
2026-04-22$190,000 Active
ⓘ Source: listings_history table (triggers on properties + properties_extension) + one-shot
backfill from property_details.listing_events for pre-trigger history.
Tax reassessment forecast NC · Resets to sale price
- Current annual tax
- $1,249 · $104/mo
- Projected year-2 tax
- $1,558 · $130/mo
- Expected delta
- +$309/yr (+$26/mo · 24.8%)
ⓘ Screening estimate from a state-policy table — verify with the county assessor before closing.
Climate risk First Street
- Flood 1/10 Low FEMA zone X (unshaded) · 0% chance over 30 yrs
- Wildfire 5/10 Major
- Heat 3/10 Moderate 7 d/yr ≥94°F today · 18 d/yr by 30 yrs out
- Wind 2/10 Low 100% chance of damaging wind over 30 yrs
- Air quality 1/10 Low 0 unhealthy d/yr today · 0 by 30 yrs out
Nearby sold comps map
Loading sold comps map…
Walkable amenities ~0.75 mi
Loading nearby amenities…
Taxation est. · year 1
- Rental income
- $15,148
- − Mortgage interest
- −$10,643
- − Property taxes
- −$1,249
- − Insurance
- −$950
- − Repairs & maintenance
- −$1,212
- − Management
- −$1,212
- − Depreciation
- −$5,527
- Taxable loss
- −$5,645
- Est. tax savings @ 24.0%
- +$1,355
- After-tax cash flow
- $-834/yr
For passive investors: Depreciation is non-cash, so a rental often shows a tax loss while cash-flowing — sheltering income. Rental losses are passive: they offset passive income freely, and up to $25,000/yr can offset ordinary (W-2) income if you actively participate and your MAGI is under $100k (phasing out to $0 by $150k); unused losses carry forward. On sale, claimed depreciation is recaptured at up to 25%, and gains may owe capital-gains tax (a 1031 exchange can defer both). Figures are a year-1 estimate at your 24.0% rate — not tax advice; consult a CPA.
Schools (NCES district)
- District
- Wilkes County Schools
- NCES district ID
- 3704950
- Math proficiency
- 55% ▲ 13.00%
- Reading proficiency
- 50% ▲ 5.00%
- Median HH income
- $34,538
- Composite
- 43.41/100
- National rank
- #3017
- State rank
- #59 of 178 in NC
Livability — Moravian Falls
- Score
- 64/100
- State rank
- #366
- US rank
- #14562
Category grades
Schools grade is shown separately in the Schools card above.
Census & demographics
- Population (ZIP)
- 3,287
Population outlook (Wilkes County) Hauer SSP2
- Today (2025)
- 66,349 people
- By 2030
- 64,411 · -2.9%
- By 2040
- 59,800 · -9.9%
- By 2050
- 54,770 · -17.5%
- By 2075
- 45,211 · -31.9%
- By 2100
- 36,956 · -44.3%
Race, ethnicity, and origin ACS 2023
- Neighborhood character
- Predominantly White (90%)
- Race & ethnicity
- White 90% Asian 6% Hispanic / Latino 1% Pacific Islander 1%
- Common ancestry
- Slovak 2% Lithuanian 2% Serbian 2%
- Foreign-born
- 3% · South Korea
- Languages at home
- 95% English-only · Korean 3% French/Haitian/Cajun 2%
Political lean MEDSL · Wilkes
- 2024 margin
- Solid R (+59.6) · D 19.9% · R 79.5%
- 2008→2024 swing
- -21.5pp toward R · 2008: -38.2pp · 2024: -59.6pp
- All cycles
- 2024: R+59.6 2020: R+56.6 2016: R+55.2 2012: R+42.7 2008: R+38.2
Not yet ingested
- Civics
- —
Market trends
- HPI YoY
- ▲ 32.10%
- Current HPI
- 274.1944
- Rent YoY
- —
- Metro
- —
- State GDP YoY
- ▲ 3.28%
- F500 in state
- 26
Industry mix (Fortune 500 HQ in NC)
| Industry | F500 HQs | Revenue |
|---|---|---|
| Financial Services | 2 | $213B |
|
||
| Retail | 2 | $95B |
|
||
| Industrial Conglomerate | 1 | $38B |
|
||
| Metals / Steel | 1 | $35B |
|
||
| Utilities | 1 | $30B |
|
||
| Industrial Machinery | 1 | $19B |
|
||
Price history
2 events — show timeline
- 2026-05-07 Pending — Triad MLS
- 2026-04-22 Listed $190,000 Triad MLS
Property tax history
+1.6%/yrLatest (2025): $1,249 · +18.1% YoY. Source: county tax records.
Cash-flow waterfall
monthlySold comps — $/sqft
last 12 mo · ≤1 miLoading sold comps…