30 Canyon Crk · Junction City, CA
Flood risk 1/10 · Minimal
- FEMA flood zone
- X (unshaded)
- Chance of flooding over 30 yrs
- 0.0%
- Est. flood insurance / yr
- $507 – $1,088
Fire risk 9/10 · Severe
- Est. fire insurance / yr
- $659 – $1,223
Heat risk 8/10 · Major
- Hot days now (above 98°F)
- 8 days/yr
- Hot days in 30 yrs
- 18 days/yr
Wind risk 1/10 · Minimal
- Chance of severe wind over 30 yrs
- —
Air-quality risk 10/10 · Severe
- Unhealthy air days now
- 49 days/yr
- Unhealthy air days in 30 yrs
- 51 days/yr
Risk factors via First Street. Map © Google.
Why this score? — see what drove the C+ grade
The composite is a weighted blend of 9 inputs, each scored 0–100. Each bar is that input's sub-score; the figure is the points it added to the 100-point composite (weight × sub-score).
- Cash flow +22.9/30.0
- ARV discount +7.5/15.0
- DSCR +7.3/10.0
- Schools +5.6/10.0
- 1% rule +5.0/10.0
- Appreciation +5.0/10.0
- Livability +2.6/5.0
- Rent growth +2.5/5.0
- Condition / age +2.5/5.0
$85,000
🖨 Deal sheet (PDF) 📄 Offer letter ✓ Due diligence
Listing remarks
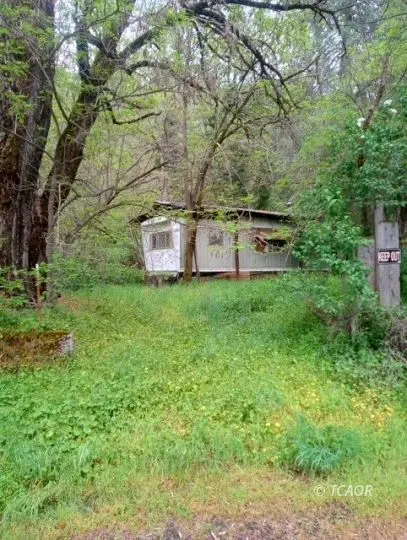
Here is a great opportunity to own a corner lot on Hwy 299 in Junction City. It has great commercial potential with plenty of parking for Equipment. Easy access to 299 and the Junction City store. The Mobile Home is a fixer!!! Could be a great project. A fountain is in the front yard. There is a 20 by 40 slab with a storage container with power also a small barn. Sewer is a septic tank and water is a well on adjoining lot. Property has not been occupied for many years and is very overgrown. Frontage on hwy 299 and canyon creek rd. Owner says bring all offers
Key facts
- Built 1975
- Listed 43 days
Property features AI
Finance
- Other: Zoning: U - Unclassified District
- Financial info: No financial details provided
- HOA & community: No HOA or community details provided
Exterior
- Parking: No parking details provided
- Security: No security details provided
- Utilities: Septic tank
- Home design: Manufactured home (not affixed); Residential property
- Construction: Aluminum siding; Metal siding; Metal roof
- Exterior features: Corner lot; Has view; Workshop on the property
Interior
- Kitchen: Cooktop
- Bedrooms: No bedroom-level details provided
- Flooring: Vinyl flooring
- Bathrooms: 1 full bathroom
- Heating & cooling: No heating or cooling details provided
- Interior features: Cooktop; Vinyl flooring; 4 total rooms
- Laundry & utility: No laundry/utility details provided
Neighborhood map
What this means for you Summary
Snapshot
- This is a 1-bed/1.0-bath manufactured listed at $85k.
Deal economics
- At list price, monthly cash flow is $149 ($2k/yr) — positive.
- The deal already cash-flows at list — no discount required.
- Meets the 1% rule at list price ($851 rent vs $85k).
- Recommended offer: $82k (3.0% below list) — sets the bar for market timing.
Location & tenants
- Location reads 52/100 on livability (#1,040 in CA) — a working-class tenant base; expect higher turnover. Watch: employment C-, crime F, amenities F.
- Junction City Elementary (rural): math 60% / reading 70% proficiency, ranked #201 of 1,400 in CA (top 14%) — acceptable for families but not a draw, mixed tenant base, ~2y average lease.
- Zoned schools: Junction City Elementary (math 64% / reading 74%, grade A-, #147 of 1,571 statewide, top 10%, 63 students, 59% FRL) — zoned schools at 59% FRL track the district average.
- Market conditions: 13 active listings in the ZIP; 21 units permitted in Trinity County in 2024 (0 in 5+ unit buildings).
Forward outlook
- In year one you build about $3k of equity ($588 loan paydown + $3k appreciation (3.0% local appreciation)).
- Trinity County population projected at -38% by 2050 — secular population decline; favor cash flow + early exit over multi-decade hold.
- At projected returns (3.0% appreciation + 3.0% rent growth), your $24k cash investment doubles in ~5 years — after that, you're playing with house money.
- By year 10, paydown + projected appreciation supports a ~$30k cash-out refi (75% LTV) — recoverable capital for the next deal without selling this one.
Negotiation context
- It's been on market 44 days — a 3% lower offer ($82k) is reasonable based on typical stale-listing flexibility.
Risks & watch-outs
- Climate carrying-cost: severe wildfire risk; extreme-heat days projected 8→18/yr by 2055 (HVAC capex compounding) — expect insurance premiums to compound above CPI over the hold.
Questions for the listing agent
- It's been on market 44 days. Have you received any prior offers? Is the seller open to a 3% concession, seller financing, or rate buy-down credit?
- Built in 1975 — when were the roof, HVAC, electrical panel, plumbing, and water heater last replaced?
- Is there a deadline driving the sale (1031 exchange, divorce, estate, relocation)? That informs how much negotiation room exists.
- Schools are A-rated — typically a magnet for longer-tenancy family renters. What's the average tenant stay here, and is there a school-zone premium baked into asking?
- Crime grade is F in this area — have there been break-ins, vandalism, or insurance claims at this property in the last 3 years? What carrier currently insures it and at what premium?
- What's the average days-on-market for RENTAL listings here right now (not sales)? A rising rental-DOM trend means longer vacancies and softer asking-rent achievability than the comps imply.
- What's the recent tenant-quality profile in this submarket — average credit score on applications, eviction rate, late-payment / NSF rate, and stable-employment percentage? A property-management company in the area should have these aggregated.
- How much new for-sale + rental construction is in the pipeline within 1–3 miles? Heavy new supply typically softens prices + rents 12–24 months out; constrained supply supports both.
Investment metrics
- 1% rule
- 1.00% ✓
- Cap rate
- 8.39%
- Cash-on-cash
- 7.50%
- DSCR
- 1.33
- GRM
- 8.3
CMA / ARV
No comps found within radius.
Projected returns pro-forma
3.0% appreciation · 3.0% rent growth · sell at horizon
- IRR
- 14.5%
- Equity multiple
- 1.83×
- Total profit
- $19,686
- Equity at exit
- $38,220
- IRR
- 16.3%
- Equity multiple
- 3.39×
- Total profit
- $56,781
- Equity at exit
- $58,901
Cash invested: $23,800 (down + closing). Projections, not guarantees.
Landlord ↔ Tenant lean methodology
- Overall (STATE)
- 18 Strongly Tenant-Friendly
- State California
- 18 Strongly Tenant-Friendly · D+13
- County
- — inherits STATE
- City
- — inherits STATE
ZIP-level market 96046
- Active inventory
- 13
- Price-to-rent
- 8.3×
Monthly cashflow live
- Estimated rent
- $851 medium interval (Pro) →
- Mortgage (P&I)
- −$446
- Tax from tax record
- −$43 /mo · $510/yr
- Insurance
- −$35
- HOA
- −$0
- Vacancy / Maint / Mgmt
- −$179
- Net cashflow
- $149
Break-even live
Sensitivity live
| Price | -10% $197 | -5% $173 | +0% $149 | +5% $125 | +10% $101 |
|---|---|---|---|---|---|
| Rent | -10% $81 | -5% $115 | +0% $149 | +5% $182 | +10% $216 |
| Rate | -1.0pp $192 | -0.5pp $170 | base $149 | +0.5pp $127 | +1.0pp $104 |
UW: 25.0% down · 7.5% · 30yr · 1.5% tax · 5.0% vac · 8.0% maint · 8.0% mgmt
Financing live
Cash to close
- Down payment
- $21,250
- Closing costs
- $2,550
- Reserves months
- —
- Total cash needed
- —
Loan-product check · same deal, 3 products live
Conventional
25% down · 7.5% · 30yr
- Down + closing
- —
- Monthly P&I
- —
- Monthly cashflow
- —
- DSCR
- —
- Eligible?
- —
Personal DTI + credit; lowest rate.
DSCR
20% down · 8.5% · 30yr
- Down + closing
- —
- Monthly P&I
- —
- Monthly cashflow
- —
- DSCR
- —
- Eligible?
- —
No personal income docs; deal must DSCR.
Hard money
10% down · 12.0% · 12mo
- Down + closing
- —
- Monthly P&I
- —
- Monthly cashflow
- —
- DSCR
- —
- Eligible?
- —
Short-term bridge; refi at stabilization.
Listing history 15 events
-
2026-06-19days on market $85,000 Active 44 DOM
-
2026-06-18days on market $85,000 Active 43 DOM
-
2026-06-17days on market $85,000 Active 42 DOM
-
2026-06-16days on market $85,000 Active 41 DOM
-
2026-06-15days on market $85,000 Active 40 DOM
-
2026-06-14days on market $85,000 Active 38 DOM
-
2026-06-12days on market $85,000 Active 37 DOM
-
2026-06-09days on market $85,000 Active 34 DOM
-
2026-06-08days on market $85,000 Active 33 DOM
-
2026-06-07days on market $85,000 Active 32 DOM
-
2026-06-05days on market $85,000 Active 30 DOM
-
2026-06-04days on market $85,000 Active 28 DOM
-
2026-06-03status $85,000 Active 27 DOM
-
2026-05-07status Pending
-
2026-04-10$85,000 Active
ⓘ Source: listings_history table (triggers on properties + properties_extension) + one-shot
backfill from property_details.listing_events for pre-trigger history.
Tax reassessment forecast CA · Resets to sale price
- Current annual tax
- $510 · $43/mo
- Projected year-2 tax
- $646 · $54/mo
- Expected delta
- +$136/yr (+$11/mo · 26.6%)
ⓘ Screening estimate from a state-policy table — verify with the county assessor before closing.
Climate risk First Street
- Flood 1/10 Low FEMA zone X (unshaded) · 0% chance over 30 yrs
- Wildfire 9/10 Extreme
- Heat 8/10 Severe 8 d/yr ≥98°F today · 18 d/yr by 30 yrs out
- Wind 1/10 Low
- Air quality 10/10 Extreme 49 unhealthy d/yr today · 51 by 30 yrs out
Nearby sold comps map
Loading sold comps map…
Walkable amenities ~0.75 mi
Loading nearby amenities…
Taxation est. · year 1
- Rental income
- $10,214
- − Mortgage interest
- −$4,761
- − Property taxes
- −$510
- − Insurance
- −$425
- − Repairs & maintenance
- −$817
- − Management
- −$817
- − Depreciation
- −$2,473
- Taxable income
- $410
- Est. tax owed @ 24.0%
- −$98
- After-tax cash flow
- $1,686/yr
For passive investors: Depreciation is non-cash, so a rental often shows a tax loss while cash-flowing — sheltering income. Rental losses are passive: they offset passive income freely, and up to $25,000/yr can offset ordinary (W-2) income if you actively participate and your MAGI is under $100k (phasing out to $0 by $150k); unused losses carry forward. On sale, claimed depreciation is recaptured at up to 25%, and gains may owe capital-gains tax (a 1031 exchange can defer both). Figures are a year-1 estimate at your 24.0% rate — not tax advice; consult a CPA.
Schools (NCES district)
- District
- Junction City Elementary
- NCES district ID
- 0619170
- Math proficiency
- 60% ▲ 10.00%
- Reading proficiency
- 70% ▲ 10.00%
- Median HH income
- $44,644
- Composite
- 56.1/100
- National rank
- #2539
- State rank
- #201 of 1400 in CA
Livability — Junction City
- Score
- 52/100
- State rank
- #1040
- US rank
- #25105
Category grades
Schools grade is shown separately in the Schools card above.
Census & demographics
- Census place
- Junction City, CA
- Population (ZIP)
- 410
Population outlook (Trinity County) Hauer SSP2
- Today (2025)
- 11,337 people
- By 2030
- 10,349 · -8.7%
- By 2040
- 8,518 · -24.9%
- By 2050
- 7,084 · -37.5%
- By 2075
- 4,693 · -58.6%
- By 2100
- 2,894 · -74.5%
Race, ethnicity, and origin ACS 2023
- Neighborhood character
- Highly diverse neighborhood (Simpson 0.99)
- Race & ethnicity
- Two or more races 46% Native American 42% White 12%
Political lean MEDSL · Trinity
- 2024 margin
- Lean R (+9.4) · D 43.4% · R 52.8% · Other 3.8%
- 2008→2024 swing
- -14.0pp toward R · 2008: 4.6pp · 2024: -9.4pp
- All cycles
- 2024: R+9.4 2020: R+5.4 2016: R+11.3 2012: R+1.1 2008: D+4.6
Not yet ingested
- Civics
- —
Market trends
- HPI YoY
- —
- Current HPI
- —
- Rent YoY
- —
- Metro
- —
- State GDP YoY
- ▲ 3.21%
- F500 in state
- 116
Industry mix (Fortune 500 HQ in CA)
| Industry | F500 HQs | Revenue |
|---|---|---|
| Technology | 27 | $1,492B |
|
||
| Financial Services | 3 | $174B |
|
||
| Retail | 3 | $44B |
|
||
| Insurance | 3 | $26B |
|
||
| Media / Entertainment | 2 | $115B |
|
||
| Pharmaceuticals / Biotech | 2 | $62B |
|
||
Price history
2 events — show timeline
- 2026-05-07 Pending — Trinity AOR
- 2026-04-10 Listed $85,000 Trinity AOR
Property tax history
+4.6%/yrLatest (2025): $510 · +1.7% YoY. Source: county tax records.
Cash-flow waterfall
monthlySold comps — $/sqft
last 12 mo · ≤1 miLoading sold comps…