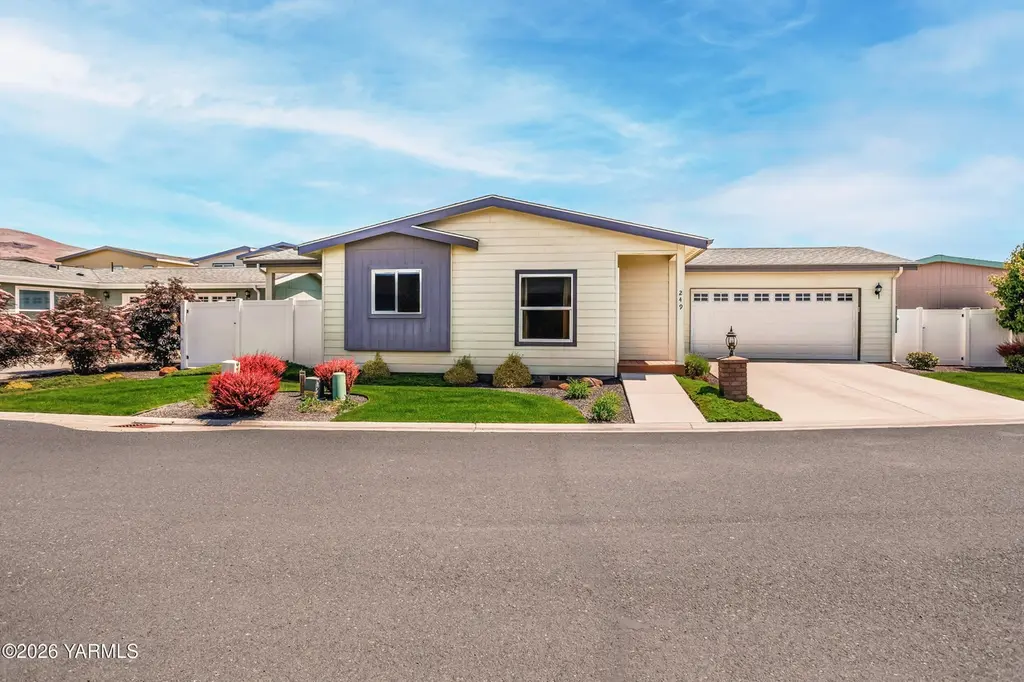
200 Bridle Way #249 · Terrace Heights, WA
Flood risk No data
- FEMA flood zone
- —
- Chance of flooding over 30 yrs
- —
- Est. flood insurance / yr
- —
Fire risk No data
- Est. fire insurance / yr
- —
Heat risk No data
- Hot days now (above threshold)
- —
- Hot days in 30 yrs
- —
Wind risk No data
- Chance of severe wind over 30 yrs
- —
Air-quality risk No data
- Unhealthy air days now
- —
- Unhealthy air days in 30 yrs
- —
Risk factors via First Street. Map © Google.
Why this score? — see what drove the F grade
The composite is a weighted blend of 9 inputs, each scored 0–100. Each bar is that input's sub-score; the figure is the points it added to the 100-point composite (weight × sub-score).
- ARV discount +9.2/15.0
- Cash flow +6.8/30.0
- Schools +5.1/10.0
- Rent growth +4.8/5.0
- Livability +3.6/5.0
- Condition / age +2.5/5.0
- 1% rule +1.2/10.0
- DSCR +1.0/10.0
- Appreciation +0.0/10.0
$234,000
🖨 Deal sheet (PDF) 📄 Offer letter ✓ Due diligence
Listing remarks
Welcome to Quail Run, Terrace Heights' Premier 55+ Gated Community! This charming single-level home offers approximately 1,271 sq. ft. of comfortable living space with 2 bedrooms, 2 full bathrooms, and an office/den. The open-concept kitchen features abundant cabinetry and generous counter space--perfect for both everyday living and entertaining. The primary suite includes a spacious en-suite bathroom with dual sinks and a walk-in shower. Enjoy the convenience of a dedicated laundry room, a two-car garage, and a fully fenced private yard with automatic sprinklers. Relax on the covered back patio and take in the peace and privacy. Residents of Quail Run enjoy access to a well-maintained club
Key facts
- Gated community
- Open-concept kitchen
- Covered back patio
Tags
Property features AI
Finance
- HOA & community: Community pool; Senior community
Exterior
- Parking: Attached garage with 2 spaces; Garage door opener
- Security: Gated community
- Utilities: Public water; Sewer connected; Cable available
- Home design: Manufactured home; Single-story
- Construction: Composition roof
- Exterior features: Garden; Level lot
Interior
- Kitchen: Dishwasher; Microwave; Range; Refrigerator; Oven
- Flooring: Carpet; Vinyl
- Bathrooms: 2 full bathrooms
- Heating & cooling: Central air conditioning; Electric forced-air heating
- Interior features: Garden (exterior-accessible landscaping mentioned in exterior features)
Neighborhood map
What this means for you Summary
Snapshot
- This is a 2-bed/2.0-bath single-family listed at $234k.
Deal economics
- At list price, monthly cash flow is $-363 ($-4k/yr) — negative.
- To cash-flow at today's rent, offer at most $170k (27.4% below list).
- To meet the 1% rule (rent ≥ 1% of price), the offer needs to be $145k (38.1% below list).
- Recommended offer: $145k (38.1% below list) — sets the bar for 1% rule.
- Cap rate 4.4% vs local median 2.8% in Terrace Heights — top-decile yield for the area; either an underpriced asset or a hidden risk that comps aren't pricing in. Stress-test before assuming the spread holds.
Location & tenants
- Location reads 72/100 on livability (#210 in WA) — a middle-class / working-renter tenant base. Strengths: housing A+, health & safety A+, employment A; Watch: amenities F, commute F.
- East Valley School District (Yakima) (suburban): math 54% / reading 61% proficiency, ranked #76 of 291 in WA (top 26%) — acceptable for families but not a draw, mixed tenant base, ~2y average lease.
- Zoned schools: Terrace Heights Elementary (473 students, 73% FRL); East Valley Central Middle School (801 students, 71% FRL); East Valley High School (1,036 students, 65% FRL) — zoned schools average 70% FRL vs 45% district-wide (25 pts higher); higher-poverty schools than district average — tighter screening recommended.
- Market conditions: Rents rising fast (+9.3%/yr); 171 active listings in the ZIP; 1 comparable units currently listed for rent nearby; 468 units permitted in Yakima County in 2024 (23 in 5+ unit buildings).
- This rent runs 30% of the median local income ($57k/yr) — at the standard rent-burdened threshold; future hikes will face affordability resistance.
Forward outlook
- Local home prices are declining (-3.0%/yr); year-one equity from $2k of loan paydown is wiped out by about $7k of value loss. Plan a longer hold.
- Yakima County population projected at +6% by 2050 — modest demand growth; plan on rents tracking national, not racing it.
Negotiation context
- It's been on market 51 days — a 3% lower offer ($227k) is reasonable based on typical stale-listing flexibility.
- 2 sale attempts with the ask held roughly flat each time — persistent listings suggest the price (not the market) is what's stuck; bring a comps-based counter.
Questions for the listing agent
- What do current leases actually rent for vs. the listed asking? Can we see a recent rent roll and the last 12 months of T-12 income?
- It's been on market 51 days. Have you received any prior offers? Is the seller open to a 38% concession, seller financing, or rate buy-down credit?
- Is there a deadline driving the sale (1031 exchange, divorce, estate, relocation)? That informs how much negotiation room exists.
- Schools are D-rated, which usually means shorter tenancies and higher turnover. Who's the typical renter profile here, and what's been the actual vacancy rate?
- The area grade is low — what's the realistic commute time and amenity access for the typical tenant pool here? Any planned neighborhood developments (good or bad) we should know about?
- What's the average days-on-market for RENTAL listings here right now (not sales)? A rising rental-DOM trend means longer vacancies and softer asking-rent achievability than the comps imply.
- What's the recent tenant-quality profile in this submarket — average credit score on applications, eviction rate, late-payment / NSF rate, and stable-employment percentage? A property-management company in the area should have these aggregated.
- How much new for-sale + rental construction is in the pipeline within 1–3 miles? Heavy new supply typically softens prices + rents 12–24 months out; constrained supply supports both.
Investment metrics
- 1% rule
- 0.62% ✗
- Cap rate
- 4.43%
- Cash-on-cash
- -6.65%
- DSCR
- 0.70
- GRM
- 13.5
CMA / ARV
- ARV (median comp)
- $243,000
- List price
- $234,000
- Delta
- -3.70%
- Verdict
- FAIR
- Comps
- 6 within 1.0 mi
Show comp detail 8 sales within ~0.75 mi
| Address | Dist | Beds/Ba | Sqft | Sold | Price | $/sf | Match |
|---|---|---|---|---|---|---|---|
| 107 N 57th St | 0.39mi | 3/2.0 (+1) | 1,219 (-4%) | 0mo | $360,000 | $295 | 70 |
| 206 S 58th St | 0.30mi | 3/2.0 (+1) | 1,248 (-2%) | 14mo | $350,000 | $280 | 66 |
| 109 S 58th St | 0.24mi | 3/2.0 (+1) | 1,178 (-7%) | 11mo | $350,000 | $297 | 62 |
| 5503 Mount Aix Way | 0.54mi | 3/2.0 (+1) | 1,232 (-3%) | 6mo | $327,000 | $265 | 60 |
| 604 Locust Dr | 0.57mi | 2/1.0 | 1,224 (-4%) | 14mo | $260,000 | $212 | 52 |
| 5505 Morningside Dr | 0.42mi | 3/1.5 (+1) | 1,344 (+6%) | 16mo | $358,000 | $266 | 51 |
| 5503 Morningside Dr | 0.43mi | 3/1.0 (+1) | 1,344 (+6%) | 20mo | $329,000 | $245 | 45 |
| 5008 Manor Dr | 0.70mi | 2/2.0 | 1,376 (+8%) | 24mo | $375,000 | $273 | 34 |
Match score weights: distance 35% · size 25% · config 20% · recency 20%. Top-matched comps best support the ARV.
Projected returns pro-forma
-3.0% appreciation · 8.0% rent growth · sell at horizon
- IRR
- -22.9%
- Equity multiple
- 0.18×
- Total profit
- $-53,422
- Equity at exit
- $34,890
- IRR
- -8.5%
- Equity multiple
- 0.36×
- Total profit
- $-41,619
- Equity at exit
- $20,232
Cash invested: $65,520 (down + closing). Projections, not guarantees.
Landlord ↔ Tenant lean methodology
- Overall (STATE)
- 28 Tenant-Leaning
- State Washington
- 28 Tenant-Leaning · D+8
- County
- — inherits STATE
- City
- — inherits STATE
ZIP-level market 98901
- Home prices YoY
- -33.4%
- Rents YoY
- 9.3%
- Active inventory
- 171
- Price-to-rent
- 13.5×
Monthly cashflow live
- Estimated rent
- $1,449 medium interval (Pro) →
- Mortgage (P&I)
- −$1,227
- Tax from tax record
- −$183 /mo · $2,195/yr
- Insurance
- −$98
- HOA
- −$0
- Vacancy / Maint / Mgmt
- −$304
- Net cashflow
- $-363
Break-even live
Sensitivity live
| Price | -10% $-230 | -5% $-297 | +0% $-363 | +5% $-429 | +10% $-495 |
|---|---|---|---|---|---|
| Rent | -10% $-477 | -5% $-420 | +0% $-363 | +5% $-306 | +10% $-248 |
| Rate | -1.0pp $-245 | -0.5pp $-303 | base $-363 | +0.5pp $-424 | +1.0pp $-485 |
UW: 25.0% down · 7.5% · 30yr · 1.5% tax · 5.0% vac · 8.0% maint · 8.0% mgmt
Financing live
Cash to close
- Down payment
- $58,500
- Closing costs
- $7,020
- Reserves months
- —
- Total cash needed
- —
Loan-product check · same deal, 3 products live
Conventional
25% down · 7.5% · 30yr
- Down + closing
- —
- Monthly P&I
- —
- Monthly cashflow
- —
- DSCR
- —
- Eligible?
- —
Personal DTI + credit; lowest rate.
DSCR
20% down · 8.5% · 30yr
- Down + closing
- —
- Monthly P&I
- —
- Monthly cashflow
- —
- DSCR
- —
- Eligible?
- —
No personal income docs; deal must DSCR.
Hard money
10% down · 12.0% · 12mo
- Down + closing
- —
- Monthly P&I
- —
- Monthly cashflow
- —
- DSCR
- —
- Eligible?
- —
Short-term bridge; refi at stabilization.
Rent comps 1 comps
| Address | Beds | Baths | Sqft | Rent | $/sqft | DOM | Units | Dist |
|---|---|---|---|---|---|---|---|---|
| 5303 N Sky Vista Ave Yakima, WA | 3.0 | 2.0 | 1512 | $2,150 | $1.42 | 15d | 1 | 0.59mi |
Listing history 19 events
-
2026-06-22days on market $234,000 Active 51 DOM
-
2026-06-19days on market $234,000 Active 49 DOM
-
2026-06-18days on market $234,000 Active 48 DOM
-
2026-06-17days on market $234,000 Active 47 DOM
-
2026-06-16days on market $234,000 Active 46 DOM
-
2026-06-15days on market $234,000 Active 45 DOM
-
2026-06-14days on market $234,000 Active 43 DOM
-
2026-06-13days on market $234,000 Active 42 DOM
-
2026-06-10days on market $234,000 Active 40 DOM
-
2026-06-09days on market $234,000 Active 39 DOM
-
2026-06-08days on market $234,000 Active 38 DOM
-
2026-06-07days on market $234,000 Active 37 DOM
-
2026-06-03days on market $234,000 Active 33 DOM
-
2026-06-02days on market $234,000 Active 32 DOM
-
2026-06-01days on market $234,000 Active 31 DOM
-
2026-05-31days on market $234,000 Active 30 DOM
-
2026-05-30days on market $234,000 Active 29 DOM
-
2026-05-01$234,000 Active 1082-char remark
-
2025-05-30$275,000 Active
ⓘ Source: listings_history table (triggers on properties + properties_extension) + one-shot
backfill from property_details.listing_events for pre-trigger history.
Tax reassessment forecast WA · Resets to sale price
- Current annual tax
- $2,195 · $183/mo
- Projected year-2 tax
- $2,293 · $191/mo
- Expected delta
- +$99/yr (+$8/mo · 4.5%)
ⓘ Screening estimate from a state-policy table — verify with the county assessor before closing.
Nearby sold comps map
Loading sold comps map…
Walkable amenities ~0.75 mi
Loading nearby amenities…
Taxation est. · year 1
- Rental income
- $17,386
- − Mortgage interest
- −$13,108
- − Property taxes
- −$2,195
- − Insurance
- −$1,170
- − Repairs & maintenance
- −$1,391
- − Management
- −$1,391
- − Depreciation
- −$6,807
- Taxable loss
- −$8,675
- Est. tax savings @ 24.0%
- +$2,082
- After-tax cash flow
- $-2,273/yr
For passive investors: Depreciation is non-cash, so a rental often shows a tax loss while cash-flowing — sheltering income. Rental losses are passive: they offset passive income freely, and up to $25,000/yr can offset ordinary (W-2) income if you actively participate and your MAGI is under $100k (phasing out to $0 by $150k); unused losses carry forward. On sale, claimed depreciation is recaptured at up to 25%, and gains may owe capital-gains tax (a 1031 exchange can defer both). Figures are a year-1 estimate at your 24.0% rate — not tax advice; consult a CPA.
Schools (NCES district)
- District
- East Valley School District (Yakima)
- NCES district ID
- 5305370
- Math proficiency
- 54% ▲ 1.00%
- Reading proficiency
- 61% ▲ 5.00%
- Median HH income
- $57,936
- Composite
- 51.46/100
- National rank
- #3682
- State rank
- #76 of 291 in WA
Livability — Terrace Heights
- Score
- 72/100
- State rank
- #210
- US rank
- #5906
Category grades
Schools grade is shown separately in the Schools card above.
Census & demographics
- Census place
- Terrace Heights, WA
- County
- Yakima County · 134,789 people
- Metro
- Yakima, WA
- Population (ZIP)
- 31,366
- Household income
- $57,392
- Rent vs Own
- Severe rent burden
- 1317.0
Population outlook (Yakima County) Hauer SSP2
- Today (2025)
- 256,514 people
- By 2030
- 259,403 · +1.1%
- By 2040
- 265,677 · +3.6%
- By 2050
- 273,061 · +6.5%
- By 2075
- 296,991 · +15.8%
- By 2100
- 315,291 · +22.9%
Race, ethnicity, and origin ACS 2023
- Neighborhood character
- Majority Hispanic (54%)
- Race & ethnicity
- Hispanic / Latino 54% White 39% Two or more races 22% Native American 3% Black 1%
- Hispanic origin (detail)
- Mexican 49%
- Common ancestry
- Italian 3% Lithuanian 2% Scottish 1%
- Foreign-born
- 20% · Canada
- Languages at home
- 53% English-only · Spanish 46%
Political lean MEDSL · Yakima
- 2024 margin
- R (+14.3) · D 41.6% · R 55.9% · Other 2.5%
- 2008→2024 swing
- -3.8pp toward R · 2008: -10.6pp · 2024: -14.3pp
- All cycles
- 2024: R+14.3 2020: R+7.7 2016: R+15.4 2012: R+15.1 2008: R+10.6
Not yet ingested
- Civics
- —
Market trends
- HPI YoY
- ▼ -144.24%
- Current HPI
- 287.8283
- Rent YoY
- ▲ 9.31%
- Metro
- Yakima, WA
- State GDP YoY
- ▲ 4.65%
- F500 in state
- 22
Industry mix (Fortune 500 HQ in WA)
| Industry | F500 HQs | Revenue |
|---|---|---|
| Retail | 2 | $269B |
|
||
| Technology / Retail | 1 | $638B |
|
||
| Technology | 1 | $245B |
|
||
| Telecommunications | 1 | $38B |
|
||
| Food / Beverage | 1 | $36B |
|
||
| Automotive / Trucks | 1 | $34B |
|
||
Price history
-14.9% since first listed2 events — show timeline
- 2026-05-01 Listed $234,000 YAMLS
- 2025-05-30 Listed $275,000 YAMLS
Property tax history
+11.1%/yrLatest (2026): $2,195 · +1.1% YoY. Source: county tax records.
Cash-flow waterfall
monthlySold comps — $/sqft
last 12 mo · ≤1 miLoading sold comps…