1151 Sunview Dr · St. Johns, MI
Flood risk No data
- FEMA flood zone
- —
- Chance of flooding over 30 yrs
- —
- Est. flood insurance / yr
- —
Fire risk No data
- Est. fire insurance / yr
- —
Heat risk No data
- Hot days now (above threshold)
- —
- Hot days in 30 yrs
- —
Wind risk No data
- Chance of severe wind over 30 yrs
- —
Air-quality risk No data
- Unhealthy air days now
- —
- Unhealthy air days in 30 yrs
- —
Risk factors via First Street. Map © Google.
Why this score? — see what drove the D+ grade
The composite is a weighted blend of 9 inputs, each scored 0–100. Each bar is that input's sub-score; the figure is the points it added to the 100-point composite (weight × sub-score).
- ARV discount +15.0/15.0
- Cash flow +10.5/30.0
- 1% rule +6.2/10.0
- Schools +3.6/10.0
- DSCR +3.0/10.0
- Rent growth +2.5/5.0
- Livability +2.5/5.0
- Condition / age +2.5/5.0
- Appreciation +0.0/10.0
$89,900
🖨 Deal sheet (PDF) 📄 Offer letter ✓ Due diligence
Listing remarks MLS
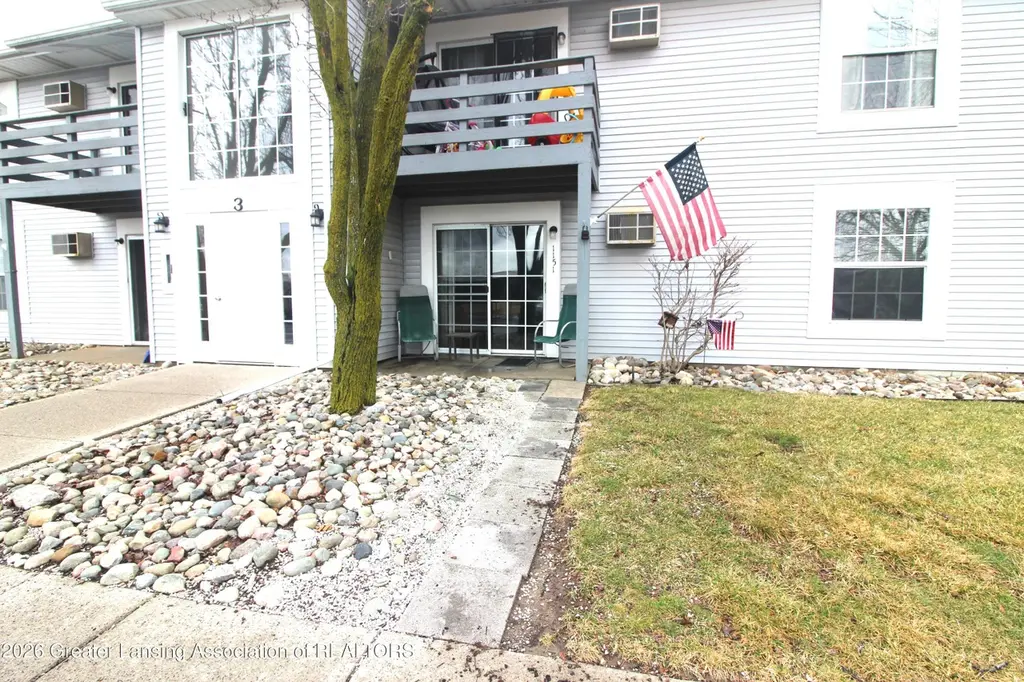
Adorable and affordable 2-bedroom condo. First floor with small patio, coin laundry, and carport space. Spacious master with super sized closet. Association fee included heat, water, outdoor maintenance, and exterior insurance.
Key facts
- Coin laundry
- Carport space
- First floor
Tags
Neighborhood map
What this means for you Summary
Snapshot
- This is a 2-bed/1.0-bath single-family listed at $90k.
Deal economics
- At list price, monthly cash flow is $-45 ($-544/yr) — negative.
- To cash-flow at today's rent, offer at most $82k (8.9% below list).
- Meets the 1% rule at list price ($1k rent vs $90k).
- Recommended offer: $82k (9.0% below list) — sets the bar for market timing.
- Cap rate 5.7% vs local median 2.7% in St. Johns — top-decile yield for the area; either an underpriced asset or a hidden risk that comps aren't pricing in. Stress-test before assuming the spread holds.
Location & tenants
- Location reads: area grade D — affects rentability + tenant quality, not the cash-flow math above.
- St. Johns Public Schools (rural): math 33% / reading 50% proficiency, ranked #177 of 540 in MI (top 33%) — families likely to look elsewhere, expect single-tenant / working-renter base with shorter leases.
- Market conditions: 94 active listings in the ZIP; 154 units permitted in Clinton County in 2024 (0 in 5+ unit buildings).
Forward outlook
- Local home prices are declining (-3.0%/yr); year-one equity from $622 of loan paydown is wiped out by about $3k of value loss. Plan a longer hold.
Negotiation context
- It's been on market 101 days — a 9% lower offer ($82k) is reasonable based on typical stale-listing flexibility.
- 6 sale attempts since 5y ago; this cycle's ask has dropped $10k (10%) from the opening price — seller is motivated, your offer sets the floor, not the list.
- Current owner paid $70k; 28% above their basis — modest negotiation headroom, anchor on the comps not their cost.
Risks & watch-outs
- Watch-outs: HOA is 26% of rent.
Questions for the listing agent
- What do current leases actually rent for vs. the listed asking? Can we see a recent rent roll and the last 12 months of T-12 income?
- It's been on market 101 days. Have you received any prior offers? Is the seller open to a 9% concession, seller financing, or rate buy-down credit?
- What does the HOA fee cover, when was the last increase, and are there any pending special assessments or reserve-fund shortfalls?
- Why hasn't it sold? Are there any deal-killer items the seller is aware of (foundation, flood, title, zoning, code violations)?
- Is there a deadline driving the sale (1031 exchange, divorce, estate, relocation)? That informs how much negotiation room exists.
- The area grade is low — what's the realistic commute time and amenity access for the typical tenant pool here? Any planned neighborhood developments (good or bad) we should know about?
- What's the average days-on-market for RENTAL listings here right now (not sales)? A rising rental-DOM trend means longer vacancies and softer asking-rent achievability than the comps imply.
- What's the recent tenant-quality profile in this submarket — average credit score on applications, eviction rate, late-payment / NSF rate, and stable-employment percentage? A property-management company in the area should have these aggregated.
- How much new for-sale + rental construction is in the pipeline within 1–3 miles? Heavy new supply typically softens prices + rents 12–24 months out; constrained supply supports both.
Investment metrics
- 1% rule
- 1.12% ✓
- Cap rate
- 5.69%
- Cash-on-cash
- -2.16%
- DSCR
- 0.90
- GRM
- 7.4
CMA / ARV
- ARV (median comp)
- $153,000
- List price
- $89,900
- Delta
- -41.24%
- Verdict
- UNDERPRICED
- Comps
- 7 within 1.0 mi
Projected returns pro-forma
-3.0% appreciation · 3.0% rent growth · sell at horizon
- IRR
- -19.7%
- Equity multiple
- 0.31×
- Total profit
- $-17,304
- Equity at exit
- $13,404
- IRR
- -12.1%
- Equity multiple
- 0.28×
- Total profit
- $-18,176
- Equity at exit
- $7,773
Cash invested: $25,172 (down + closing). Projections, not guarantees.
Landlord ↔ Tenant lean methodology
- Overall (STATE)
- 62 Landlord-Friendly
- State Michigan
- 62 Landlord-Friendly · EVEN
- County
- — inherits STATE
- City
- — inherits STATE
ZIP-level market 48879
- Active inventory
- 94
- Price-to-rent
- 7.4×
Monthly cashflow live
- Estimated rent
- $1,007 medium interval (Pro) →
- Mortgage (P&I)
- −$471
- Tax from tax record
- −$74 /mo · $885/yr
- Insurance
- −$37
- HOA
- −$258
- Vacancy / Maint / Mgmt
- −$211
- Net cashflow
- $-45
Break-even live
Sensitivity live
| Price | -10% $6 | -5% $-20 | +0% $-45 | +5% $-71 | +10% $-96 |
|---|---|---|---|---|---|
| Rent | -10% $-125 | -5% $-85 | +0% $-45 | +5% $-6 | +10% $34 |
| Rate | -1.0pp $0 | -0.5pp $-22 | base $-45 | +0.5pp $-69 | +1.0pp $-92 |
UW: 25.0% down · 7.5% · 30yr · 1.5% tax · 5.0% vac · 8.0% maint · 8.0% mgmt
Financing live
Cash to close
- Down payment
- $22,475
- Closing costs
- $2,697
- Reserves months
- —
- Total cash needed
- —
Loan-product check · same deal, 3 products live
Conventional
25% down · 7.5% · 30yr
- Down + closing
- —
- Monthly P&I
- —
- Monthly cashflow
- —
- DSCR
- —
- Eligible?
- —
Personal DTI + credit; lowest rate.
DSCR
20% down · 8.5% · 30yr
- Down + closing
- —
- Monthly P&I
- —
- Monthly cashflow
- —
- DSCR
- —
- Eligible?
- —
No personal income docs; deal must DSCR.
Hard money
10% down · 12.0% · 12mo
- Down + closing
- —
- Monthly P&I
- —
- Monthly cashflow
- —
- DSCR
- —
- Eligible?
- —
Short-term bridge; refi at stabilization.
HOA detail
- Monthly dues
- $258 · $3,096/yr
- Likely covers
- water
Listing history 29 events
-
2026-06-18days on market $89,900 Active 101 DOM
-
2026-06-17days on market $89,900 Active 100 DOM
-
2026-06-16days on market $89,900 Active 99 DOM
-
2026-06-15days on market $89,900 Active 98 DOM
-
2026-06-14days on market $89,900 Active 96 DOM
-
2026-06-13days on market $89,900 Active 95 DOM
-
2026-06-10days on market $89,900 Active 93 DOM
-
2026-06-09days on market $89,900 Active 92 DOM
-
2026-06-08days on market $89,900 Active 91 DOM
-
2026-06-07days on market $89,900 Active 90 DOM
-
2026-06-05pricedays on market $89,900 Active 87 DOM
-
2026-06-03days on market $94,500 Active 86 DOM
-
2026-06-02days on market $94,500 Active 85 DOM
-
2026-06-01days on market $94,500 Active 84 DOM
-
2026-05-31days on market $94,500 Active 83 DOM
-
2026-05-30days on market $94,500 Active 82 DOM
-
2026-05-12price $94,500 227-char remark
Show marketing remark (227 chars)
Adorable and affordable 2-bedroom condo. First floor with small patio, coin laundry, and carport space. Spacious master with super sized closet. Association fee included heat, water, outdoor maintenance, and exterior insurance.
-
2026-05-11status Active 227-char remark
Show marketing remark (227 chars)
Adorable and affordable 2-bedroom condo. First floor with small patio, coin laundry, and carport space. Spacious master with super sized closet. Association fee included heat, water, outdoor maintenance, and exterior insurance.
-
2026-04-06historical Active Under Contract 227-char remark
Show marketing remark (227 chars)
Adorable and affordable 2-bedroom condo. First floor with small patio, coin laundry, and carport space. Spacious master with super sized closet. Association fee included heat, water, outdoor maintenance, and exterior insurance.
-
2026-03-09$99,900 Active 227-char remark
Show marketing remark (227 chars)
Adorable and affordable 2-bedroom condo. First floor with small patio, coin laundry, and carport space. Spacious master with super sized closet. Association fee included heat, water, outdoor maintenance, and exterior insurance.
-
2022-05-27soldstatus $70,000
-
2022-05-26soldstatus $70,000
-
2022-04-25$79,900
-
2022-01-10historical
-
2021-08-10$84,900
ⓘ Source: listings_history table (triggers on properties + properties_extension) + one-shot
backfill from property_details.listing_events for pre-trigger history.
Tax reassessment forecast MI · Partial reset (capped growth)
- Current annual tax
- $885 · $74/mo
- Projected year-2 tax
- $1,135 · $95/mo
- Expected delta
- +$250/yr (+$21/mo · 28.2%)
ⓘ Screening estimate from a state-policy table — verify with the county assessor before closing.
Nearby sold comps map
Loading sold comps map…
Walkable amenities ~0.75 mi
Loading nearby amenities…
Taxation est. · year 1
- Rental income
- $12,081
- − Mortgage interest
- −$5,036
- − Property taxes
- −$885
- − Insurance
- −$450
- − Repairs & maintenance
- −$966
- − Management
- −$966
- − HOA
- −$3,096
- − Depreciation
- −$2,615
- Taxable loss
- −$1,934
- Est. tax savings @ 24.0%
- +$464
- After-tax cash flow
- $-80/yr
For passive investors: Depreciation is non-cash, so a rental often shows a tax loss while cash-flowing — sheltering income. Rental losses are passive: they offset passive income freely, and up to $25,000/yr can offset ordinary (W-2) income if you actively participate and your MAGI is under $100k (phasing out to $0 by $150k); unused losses carry forward. On sale, claimed depreciation is recaptured at up to 25%, and gains may owe capital-gains tax (a 1031 exchange can defer both). Figures are a year-1 estimate at your 24.0% rate — not tax advice; consult a CPA.
Schools (NCES district)
- District
- St. Johns Public Schools
- NCES district ID
- 2632820
- Math proficiency
- 33% ▼ -11.00%
- Reading proficiency
- 50% ▼ -10.00%
- Median HH income
- $56,002
- Composite
- 36.25/100
- National rank
- #4710
- State rank
- #177 of 540 in MI
Livability — St. Johns
No livability data for this city. (Only ~50 U.S. cities are tracked.)
Census & demographics
- Census place
- St. Johns, MI
- Population (ZIP)
- 18,472
Population outlook (Clinton County) Hauer SSP2
- Today (2025)
- 81,490 people
- By 2030
- 82,558 · +1.3%
- By 2040
- 82,325 · +1.0%
- By 2050
- 79,133 · -2.9%
- By 2075
- 65,737 · -19.3%
- By 2100
- 51,314 · -37.0%
Race, ethnicity, and origin ACS 2023
- Neighborhood character
- Predominantly White (92%)
- Race & ethnicity
- White 92% Two or more races 4% Hispanic / Latino 4%
- Common ancestry
- Romanian 4% Iranian 3% Lithuanian 3%
- Foreign-born
- 1% · Canada
- Languages at home
- 98% English-only · Spanish 1%
Political lean MEDSL · Clinton
- 2024 margin
- Lean R (+8.6) · D 44.9% · R 53.5% · Other 1.5%
- 2008→2024 swing
- -9.3pp toward R · 2008: 0.7pp · 2024: -8.6pp
- All cycles
- 2024: R+8.6 2020: R+6.5 2016: R+12.7 2012: R+6.2 2008: D+0.7
Not yet ingested
- Civics
- —
Market trends
- HPI YoY
- ▼ -210.44%
- Current HPI
- 248.4208
- Rent YoY
- —
- Metro
- —
- State GDP YoY
- ▲ 1.37%
- F500 in state
- 28
Industry mix (Fortune 500 HQ in MI)
| Industry | F500 HQs | Revenue |
|---|---|---|
| Automotive Parts | 3 | $48B |
|
||
| Automotive | 2 | $372B |
|
||
| Chemicals | 1 | $45B |
|
||
| Automotive Retail | 1 | $29B |
|
||
| Healthcare / Medical Devices | 1 | $23B |
|
||
| Automotive Technology | 1 | $20B |
|
||
Price history
+11.3% since first listed13 events — show timeline
- 2026-05-12 Price Changed $94,500 REALCOMP
- 2026-05-12 Price Changed $94,500 Greater Lansing AoR
- 2026-05-11 Relisted — REALCOMP
- 2026-05-11 Relisted — Greater Lansing AoR
- 2026-04-06 Contingent — REALCOMP
- 2026-04-06 Contingent — Greater Lansing AoR
- 2026-03-09 Listed $99,900 REALCOMP
- 2026-03-09 Listed $99,900 Greater Lansing AoR
- 2022-05-27 Sold (Public Records) $70,000 Public Records
- 2022-05-26 Sold (MLS) $70,000 REALCOMP
- 2022-04-25 Listed $79,900 REALCOMP
- 2022-01-10 Listing Removed — REALCOMP
- 2021-08-10 Listed $84,900 REALCOMP
Property tax history
-3.0%/yrLatest (2025): $885 · -31.8% YoY. Source: county tax records.
Cash-flow waterfall
monthlySold comps — $/sqft
last 12 mo · ≤1 miLoading sold comps…