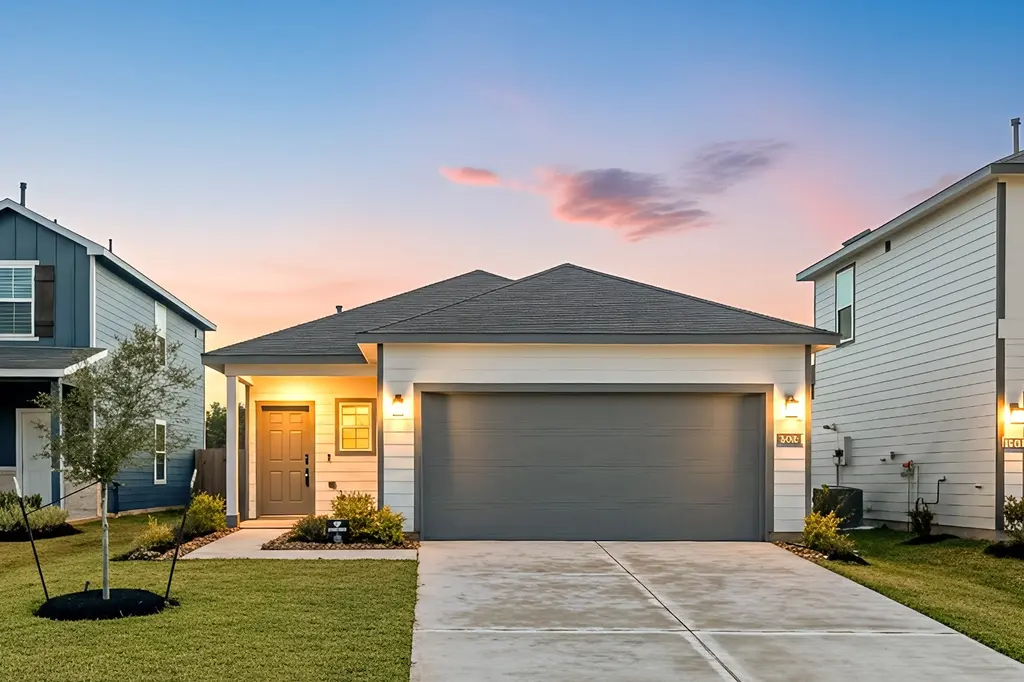
26215 Park Cove Ln · Houston, TX
Flood risk No data
- FEMA flood zone
- —
- Chance of flooding over 30 yrs
- —
- Est. flood insurance / yr
- —
Fire risk No data
- Est. fire insurance / yr
- —
Heat risk No data
- Hot days now (above threshold)
- —
- Hot days in 30 yrs
- —
Wind risk No data
- Chance of severe wind over 30 yrs
- —
Air-quality risk No data
- Unhealthy air days now
- —
- Unhealthy air days in 30 yrs
- —
Risk factors via First Street. Map © Google.
Why this score? — see what drove the D- grade
The composite is a weighted blend of 9 inputs, each scored 0–100. Each bar is that input's sub-score; the figure is the points it added to the 100-point composite (weight × sub-score).
- ARV discount +11.5/15.0
- Cash flow +8.8/30.0
- Condition / age +4.0/5.0
- Livability +3.7/5.0
- 1% rule +3.0/10.0
- Rent growth +2.9/5.0
- Schools +2.8/10.0
- DSCR +2.4/10.0
- Appreciation +0.0/10.0
$234,900
🖨 Deal sheet 📄 Offer letter ✓ Due diligence
Listing remarks MLS
This beautiful 2025-built single-story home offers modern comfort and thoughtful design throughout. Located in a quiet and friendly brand-new subdivision, it features an inviting open-concept living area that flows into a bright kitchen with a center island, quartz countertops, 42" cabinets, and a 5-burner gas range. The spacious primary bedroom includes an ensuite bath with a luxurious 5' tiled walk-in shower, while two additional generously sized bedrooms provide ample space for everyone. Additional highlights include a 2-car attached garage, a tankless water heater, full-yard irrigation with six zones, a large fenced backyard, and durable 25-year warranty shingles. Conveniently located near great schools, abundant shopping, and everyday essentials, with HEB just minutes away. This home offers peaceful living close to everything you need and is a MUST-SEE!
Key facts
- Bright kitchen
- Quartz countertops
- 42 inch cabinets
Tags
Neighborhood map
What this means for you Summary
Snapshot
- This is a 3-bed/2.0-bath single-family listed at $235k. Condition is rated good.
Deal economics
- At list price, monthly cash flow is $-192 ($-2k/yr) — negative.
- To cash-flow at today's rent, offer at most $207k (11.9% below list).
- To meet the 1% rule (rent ≥ 1% of price), the offer needs to be $188k (19.8% below list).
- Recommended offer: $188k (19.8% below list) — sets the bar for 1% rule.
- Cap rate 5.3% vs local median 3.2% in Houston — top-decile yield for the area; either an underpriced asset or a hidden risk that comps aren't pricing in. Stress-test before assuming the spread holds.
Location & tenants
- Location reads 74/100 on livability (#184 in TX, #4,771 nationally) — a middle-class / working-renter tenant base. Strengths: amenities A+, cost of living A+, housing A+; Watch: schools D, crime F.
- New Caney ISD (suburban): math 31% / reading 32% proficiency, ranked #570 of 826 in TX (top 69%) — families likely to look elsewhere, expect single-tenant / working-renter base with shorter leases.
- Market conditions: Rents rising (+1.6%/yr); 941 active listings in the ZIP; 40 comparable units currently listed for rent nearby; rentals at typical pace (median 22d on market — plan ~3-4 weeks tenant-placement turnaround); solid renter incomes; 13,259 units permitted in Montgomery County in 2024 (1,402 in 5+ unit buildings).
Forward outlook
- Local home prices are declining (-3.0%/yr); year-one equity from $2k of loan paydown is wiped out by about $7k of value loss. Plan a longer hold.
- Montgomery County population projected at +65% by 2050 — long-run rental-demand tailwind backs the buy-and-hold thesis.
Negotiation context
- It's been on market 55 days — a 3% lower offer ($228k) is reasonable based on typical stale-listing flexibility.
- 3 sale attempts with the ask held roughly flat each time — persistent listings suggest the price (not the market) is what's stuck; bring a comps-based counter.
Questions for the listing agent
- What do current leases actually rent for vs. the listed asking? Can we see a recent rent roll and the last 12 months of T-12 income?
- It's been on market 55 days. Have you received any prior offers? Is the seller open to a 20% concession, seller financing, or rate buy-down credit?
- What does the HOA fee cover, when was the last increase, and are there any pending special assessments or reserve-fund shortfalls?
- Is there a deadline driving the sale (1031 exchange, divorce, estate, relocation)? That informs how much negotiation room exists.
- Schools are D-rated, which usually means shorter tenancies and higher turnover. Who's the typical renter profile here, and what's been the actual vacancy rate?
- Crime grade is F in this area — have there been break-ins, vandalism, or insurance claims at this property in the last 3 years? What carrier currently insures it and at what premium?
- The area grade is low — what's the realistic commute time and amenity access for the typical tenant pool here? Any planned neighborhood developments (good or bad) we should know about?
- What's the average days-on-market for RENTAL listings here right now (not sales)? A rising rental-DOM trend means longer vacancies and softer asking-rent achievability than the comps imply.
- What's the recent tenant-quality profile in this submarket — average credit score on applications, eviction rate, late-payment / NSF rate, and stable-employment percentage? A property-management company in the area should have these aggregated.
- How much new for-sale + rental construction is in the pipeline within 1–3 miles? Heavy new supply typically softens prices + rents 12–24 months out; constrained supply supports both.
Investment metrics
- 1% rule
- 0.80% ✗
- Cap rate
- 5.31%
- Cash-on-cash
- -3.51%
- DSCR
- 0.84
- GRM
- 10.4
CMA / ARV
- ARV (median comp)
- $257,534
- List price
- $234,900
- Delta
- -8.79%
- Verdict
- FAIR
- Comps
- 20 within 1.0 mi
Show comp detail 12 sales within ~0.75 mi
| Address | Dist | Beds/Ba | Sqft | Sold | Price | $/sf | Match |
|---|---|---|---|---|---|---|---|
| 26215 Park Cove Ln | 0.00mi | 3/2.0 | 1,388 (0%) | 0mo | $234,900 | $169 | 100 |
| 19930 Park Mesa Ln | 0.03mi | 3/2.0 | 1,388 (0%) | 3mo | $249,900 | $180 | 96 |
| 26384 Jasper Park Ln | 0.11mi | 3/2.0 | 1,388 (0%) | 0mo | $259,900 | $187 | 95 |
| 19903 Park Mesa Ln | 0.08mi | 3/2.0 | 1,388 (0%) | 2mo | $259,900 | $187 | 94 |
| 19902 Park Mesa Ln | 0.09mi | 3/2.0 | 1,388 (0%) | 3mo | $239,000 | $172 | 94 |
| 19914 Park Mesa Ln | 0.06mi | 3/2.0 | 1,388 (0%) | 6mo | $244,900 | $176 | 92 |
| 19939 Park Mesa Ln | 0.07mi | 3/2.0 | 1,388 (0%) | 6mo | $239,900 | $173 | 92 |
| 19923 Park Mesa Ln | 0.07mi | 3/2.0 | 1,388 (0%) | 6mo | $239,900 | $173 | 92 |
| 19950 Park Mesa Ln | 0.07mi | 3/2.0 | 1,388 (0%) | 6mo | $254,900 | $184 | 91 |
| 19951 Park Mesa Ln | 0.07mi | 3/2.0 | 1,388 (0%) | 9mo | $271,900 | $196 | 89 |
| 25711 Northpark Palm Dr | 0.43mi | 3/2.0 | 1,367 (-2%) | 7mo | $222,500 | $163 | 71 |
| 25830 Northpark Pine Dr | 0.38mi | 3/2.0 | 1,243 (-10%) | 7mo | $215,000 | $173 | 59 |
Match score weights: distance 35% · size 25% · config 20% · recency 20%. Top-matched comps best support the ARV.
Projected returns pro-forma
-3.0% appreciation · 1.65% rent growth · sell at horizon
- IRR
- -23.7%
- Equity multiple
- 0.20×
- Total profit
- $-52,785
- Equity at exit
- $35,024
- IRR
- -22.9%
- Equity multiple
- -0.09×
- Total profit
- $-71,577
- Equity at exit
- $20,310
Cash invested: $65,772 (down + closing). Projections, not guarantees.
Landlord ↔ Tenant lean methodology
- Overall (STATE)
- 87 Strongly Landlord-Friendly
- State Texas
- 87 Strongly Landlord-Friendly · R+5
- County
- — inherits STATE
- City
- — inherits STATE
ZIP-level market 77365
- Home prices YoY
- -33.0%
- Rents YoY
- 1.6%
- Active inventory
- 941
- Price-to-rent
- 10.4×
Monthly cashflow live
- Estimated rent
- $1,885 high interval (Pro) →
- Mortgage (P&I)
- −$1,232
- Tax est. 1.5%
- −$294 /mo · $3,524/yr
- Insurance
- −$98
- HOA
- −$58
- Vacancy / Maint / Mgmt
- −$396
- Net cashflow
- $-192
Break-even live
UW: 25.0% down · 7.5% · 30yr · 1.5% tax · 5.0% vac · 8.0% maint · 8.0% mgmt
Financing live
Cash to close
- Down payment
- $58,725
- Closing costs
- $7,047
- Reserves months
- —
- Total cash needed
- —
Loan-product check · same deal, 3 products live
Conventional
25% down · 7.5% · 30yr
- Down + closing
- —
- Monthly P&I
- —
- Monthly cashflow
- —
- DSCR
- —
- Eligible?
- —
Personal DTI + credit; lowest rate.
DSCR
20% down · 8.5% · 30yr
- Down + closing
- —
- Monthly P&I
- —
- Monthly cashflow
- —
- DSCR
- —
- Eligible?
- —
No personal income docs; deal must DSCR.
Hard money
10% down · 12.0% · 12mo
- Down + closing
- —
- Monthly P&I
- —
- Monthly cashflow
- —
- DSCR
- —
- Eligible?
- —
Short-term bridge; refi at stabilization.
Rent comps 40 comps
| Address | Beds | Baths | Sqft | Rent | $/sqft | DOM | Units | Dist |
|---|---|---|---|---|---|---|---|---|
| 20047 Briarcliff Park Ln Porter, TX | 4.0 | 2.5 | 1785 | $2,035 | $1.14 | 15d | 1 | 0.03mi |
| 24770 Stowbridge Dr Porter, TX | 1.0–3.0 | 1.0–2.0 | 1109 | $2,439 | $2.20 | 2d | 26 | 0.53mi |
| 21925 Northpark Dr Kingwood, TX | 2.0 | 2.0 | 1005 | $1,605 | $1.60 | 44d | 1 | 0.62mi |
| 25606 Northpark Palm Dr Porter, TX | 3.0 | 2.0 | 1373 | $1,795 | $1.31 | 24d | 1 | 0.65mi |
| 25407 Northpark Lake Dr Porter, TX | 3.0 | 2.0 | 1396 | $1,745 | $1.25 | 21d | 1 | 0.71mi |
| 25545 Sorters McClellan Rd Porter, TX | 2.0 | 2.0 | 1294 | $1,949 | $1.51 | 11d | 1 | 0.71mi |
| 21919 Northpark Dr Kingwood, TX | 3.0 | 1.0–2.0 | 1005 | $1,981 | $1.97 | 2d | 34 | 0.73mi |
| 300 Forest Center Dr Kingwood, TX | 1.0–3.0 | 1.0–2.0 | 1062 | $2,133 | $2.01 | 2d | 32 | 0.88mi |
| 331 Forest Center Dr Kingwood, TX | 2.0 | 2.0 | 1102 | $1,580 | $1.43 | 44d | 1 | 0.93mi |
| 195 1/2 Kellington Dr Kingwood, TX | 2.0 | 2.0 | 1149 | $1,330 | $1.16 | 44d | 1 | 0.94mi |
| 200 Kellington Dr Unit 2047 Kingwood, TX | 2.0 | 2.0 | 956 | $1,377 | $1.44 | 11d | 1 | 0.96mi |
| 200 Kellington Dr Unit 4207 Kingwood, TX | 2.0 | 2.0 | 1245 | $1,600 | $1.29 | 20d | 1 | 1.02mi |
| 200 Kellington Dr Apt 15303 Kingwood, TX | 2.0 | 2.0 | 1064 | $1,524 | $1.43 | 44d | 1 | 1.02mi |
| 200 Kellington Dr Unit 3228 Kingwood, TX | 3.0 | 2.0 | 1503 | $1,540 | $1.02 | 3d | 1 | 1.02mi |
| 200 Kellington Dr Unit 233 Kingwood, TX | 3.0 | 2.0 | 1503 | $1,572 | $1.05 | 10d | 1 | 1.02mi |
| 200 Kellington Dr Unit 257 Kingwood, TX | 2.0 | 2.0 | 956 | $1,366 | $1.43 | 10d | 1 | 1.02mi |
| 200 Kellington Dr Unit 424 Kingwood, TX | 2.0 | 2.0 | 956 | $1,342 | $1.40 | 5d | 1 | 1.02mi |
| 200 Kellington Dr Apt 2204 Kingwood, TX | 2.0 | 2.0 | 1064 | $1,524 | $1.43 | 17d | 1 | 1.02mi |
| 200 Kellington Dr Unit 2228 Kingwood, TX | 2.0 | 2.0 | 956 | $1,334 | $1.40 | 3d | 1 | 1.02mi |
| 200 Kellington Dr Unit 17303 Kingwood, TX | 2.0 | 1.0 | 956 | $1,470 | $1.54 | 44d | 1 | 1.02mi |
| 200 Kellington Dr Unit 11306 Kingwood, TX | 2.0 | 2.0 | 1064 | $1,524 | $1.43 | 24d | 1 | 1.02mi |
| 200 Kellington Dr Unit 10206 Kingwood, TX | 2.0 | 1.0 | 956 | $1,470 | $1.54 | 24d | 1 | 1.02mi |
| 200 Kellington Dr Unit 13105 Kingwood, TX | 2.0 | 2.0 | 1064 | $1,299 | $1.22 | 17d | 1 | 1.02mi |
| 200 Kellington Dr Unit 13104 Kingwood, TX | 2.0 | 2.0 | 1064 | $1,399 | $1.31 | 44d | 1 | 1.02mi |
| 206 Kellington Dr Unit 5201 Kingwood, TX | 2.0 | 2.0 | 1245 | $1,275 | $1.02 | 24d | 1 | 1.05mi |
| 21255 W Memorial Dr Porter, TX | 3.0 | 2.0 | 1050 | $1,599 | $1.52 | 24d | 1 | 1.20mi |
| 156 Northpark Plaza Dr Kingwood, TX | 3.0 | 2.0 | 1487 | $1,777 | $1.20 | 44d | 1 | 1.23mi |
| 156 Northpark Plaza Dr Kingwood, TX | 3.0 | 2.0 | 1487 | $1,777 | $1.20 | 22d | 1 | 1.23mi |
| 156 Northpark Plaza Dr Kingwood, TX | 2.0 | 2.0 | 1167 | $1,460 | $1.25 | 24d | 1 | 1.23mi |
| 150 Northpark Plaza Dr Kingwood, TX | 1.0–3.0 | 1.0–2.0 | 1064 | $2,432 | $2.28 | 5d | 20 | 1.32mi |
| 200 Northpines Dr Kingwood, TX | 1.0–2.0 | 1.0–2.0 | 1006 | $1,630 | $1.62 | 2d | 28 | 1.32mi |
| 23200 Forest North Dr Kingwood, TX | 1.0–3.0 | 1.0–2.0 | 1093 | $2,079 | $1.90 | 2d | 19 | 1.32mi |
| 200 Northpines Dr Unit 257 Kingwood, TX | 2.0 | 2.0 | 1130 | $1,465 | $1.30 | 44d | 1 | 1.33mi |
| 200 Northpines Dr Apt 233 Kingwood, TX | 3.0 | 2.0 | 1417 | $2,002 | $1.41 | 44d | 1 | 1.33mi |
| 206 Northpines Dr Kingwood, TX | 2.0 | 2.0 | 1130 | $1,387 | $1.23 | 22d | 1 | 1.39mi |
| 206 Northpines Dr Kingwood, TX | 3.0 | 2.0 | 1417 | $1,913 | $1.35 | 21d | 1 | 1.39mi |
| 206 Northpines Dr Kingwood, TX | 2.0 | 2.0 | 1130 | $1,387 | $1.23 | 24d | 1 | 1.39mi |
| 206 Northpines Dr Kingwood, TX | 3.0 | 2.0 | 1417 | $1,913 | $1.35 | 44d | 1 | 1.39mi |
| 25710 Texas 494 Loop Unit 25743 Kingwood, TX | 3.0 | 2.0 | 1689 | $2,400 | $1.42 | 44d | 1 | 1.39mi |
| 29469 Loop 494 Kingwood, TX | 2.0 | 1.0 | 1085 | $1,500 | $1.38 | 44d | 1 | 1.46mi |
HOA detail
- Monthly dues
- $58 · $696/yr
- Likely covers
- watergas
Listing history 8 events
-
2026-04-01$234,900 Active 875-char remark
Show marketing remark (875 chars)
This beautiful 2025-built single-story home offers modern comfort and thoughtful design throughout. Located in a quiet and friendly brand-new subdivision, it features an inviting open-concept living area that flows into a bright kitchen with a center island, quartz countertops, 42" cabinets, and a 5-burner gas range. The spacious primary bedroom includes an ensuite bath with a luxurious 5' tiled walk-in shower, while two additional generously sized bedrooms provide ample space for everyone. Additional highlights include a 2-car attached garage, a tankless water heater, full-yard irrigation with six zones, a large fenced backyard, and durable 25-year warranty shingles. Conveniently located near great schools, abundant shopping, and everyday essentials, with HEB just minutes away. This home offers peaceful living close to everything you need and is a MUST-SEE!
-
2026-03-31historical
-
2025-12-04$239,900 Active
-
2025-09-26soldstatus Closed
-
2025-09-10status Pending
-
2025-07-24price $239,900
-
2025-06-17price $270,900
-
2025-05-28$264,900 Active
ⓘ Source: listings_history table (triggers on properties + properties_extension) + one-shot
backfill from property_details.listing_events for pre-trigger history.
Nearby sold comps map
Loading sold comps map…
Walkable amenities ~0.75 mi
Loading nearby amenities…
Taxation est. · year 1
- Rental income
- $22,616
- − Mortgage interest
- −$13,158
- − Property taxes
- −$3,524
- − Insurance
- −$1,174
- − Repairs & maintenance
- −$1,809
- − Management
- −$1,809
- − HOA
- −$696
- − Depreciation
- −$6,833
- Taxable loss
- −$6,388
- Est. tax savings @ 24.0%
- +$1,533
- After-tax cash flow
- $-777/yr
For passive investors: Depreciation is non-cash, so a rental often shows a tax loss while cash-flowing — sheltering income. Rental losses are passive: they offset passive income freely, and up to $25,000/yr can offset ordinary (W-2) income if you actively participate and your MAGI is under $100k (phasing out to $0 by $150k); unused losses carry forward. On sale, claimed depreciation is recaptured at up to 25%, and gains may owe capital-gains tax (a 1031 exchange can defer both). Figures are a year-1 estimate at your 24.0% rate — not tax advice; consult a CPA.
Condition & rehab AI · 12 photos
This 2025-built single-story home in a quiet and friendly subdivision offers modern comfort and thoughtful design. It is in good condition with minimal repairs needed and potential for value-adding updates.
Value-add opportunities
- Both Paint interior walls — Neutral paint can be refreshed to enhance curb appeal and interior aesthetics
- Resale Replace countertops — Quartz countertops are durable but can be replaced with more modern materials to attract buyers
- Resale Install new flooring — Hardwood floors are durable but can be replaced with more modern materials to attract buyers
Renovation cost estimate screening
Value-add ROI direction
- Both Paint interior walls — Neutral paint can be refreshed to enhance curb appeal and interior aesthetics ↑
- Resale Replace countertops — Quartz countertops are durable but can be replaced with more modern materials to attract buyers ↑
- Resale Install new flooring — Hardwood floors are durable but can be replaced with more modern materials to attract buyers ↑
ⓘ Cost ranges are severity-bucket heuristics (US national rule-of-thumb). Get contractor quotes + a written scope before underwriting a rehab budget.
Schools (NCES district)
- District
- New Caney ISD
- NCES district ID
- 4832400
- Math proficiency
- 31% ▼ -16.00%
- Reading proficiency
- 32% ▼ -6.00%
- Median HH income
- $55,380
- Composite
- 27.97/100
- National rank
- #6857
- State rank
- #570 of 826 in TX
Livability — Houston
- Score
- 74/100
- State rank
- #184
- US rank
- #4771
Category grades
Schools grade is shown separately in the Schools card above.
Census & demographics
- County
- Montgomery County · 663,713 people
- City population
- 3,226,434
- Metro
- Houston-The Woodlands-Sugar Land, TX
- Population (ZIP)
- 46,418
- Household income
- $95,702
- Rent vs Own
- Severe rent burden
- 1016.0
Population outlook (Montgomery County) Hauer SSP2
- Today (2025)
- 713,896 people
- By 2030
- 805,263 · +12.8%
- By 2040
- 992,708 · +39.1%
- By 2050
- 1,179,590 · +65.2%
- By 2075
- 1,628,084 · +128.1%
- By 2100
- 1,937,880 · +171.5%
Race, ethnicity, and origin ACS 2023
- Neighborhood character
- Diverse neighborhood (Simpson 0.59)
- Race & ethnicity
- Hispanic / Latino 46% White 44% Two or more races 15% Black 5% Asian 3%
- Hispanic origin (detail)
- Mexican 39% Puerto Rican 1%
- Common ancestry
- Lithuanian 4% Slovak 2% Romanian 2%
- Foreign-born
- 18% · Canada
- Languages at home
- 59% English-only · Spanish 36% Other Indo-European 2% Russian/Polish/Slavic 1%
Political lean MEDSL · Montgomery
- 2024 margin
- Solid R (+45.5) · D 26.8% · R 72.3%
- 2008→2024 swing
- +7.2pp toward D · 2008: -52.7pp · 2024: -45.5pp
- All cycles
- 2024: R+45.5 2020: R+43.8 2016: R+51.4 2012: R+60.7 2008: R+52.7
Not yet ingested
- Civics
- —
Market trends
- HPI YoY
- ▼ -111.46%
- Current HPI
- 225.9903
- Rent YoY
- ▲ 1.65%
- Metro
- Houston-The Woodlands-Sugar Land, TX
- State GDP YoY
- ▲ 3.95%
- F500 in state
- 110
Industry mix (Fortune 500 HQ in TX)
| Industry | F500 HQs | Revenue |
|---|---|---|
| Energy | 16 | $1,198B |
|
||
| Technology | 5 | $198B |
|
||
| Engineering / Construction | 4 | $72B |
|
||
| Energy Services | 3 | $60B |
|
||
| Utilities | 3 | $41B |
|
||
| Healthcare | 2 | $330B |
|
||
Price history
-11.3% since first listed8 events — show timeline
- 2026-04-01 Listed $234,900 HARMLS
- 2026-03-31 Listing Removed — HARMLS
- 2025-12-04 Listed $239,900 HARMLS
- 2025-09-26 Sold (MLS) — HARMLS
- 2025-09-10 Pending — HARMLS
- 2025-07-24 Price Changed $239,900 HARMLS
- 2025-06-17 Price Changed $270,900 HARMLS
- 2025-05-28 Listed $264,900 HARMLS
Cash-flow waterfall
monthlySold comps — $/sqft
last 12 mo · ≤1 miLoading sold comps…