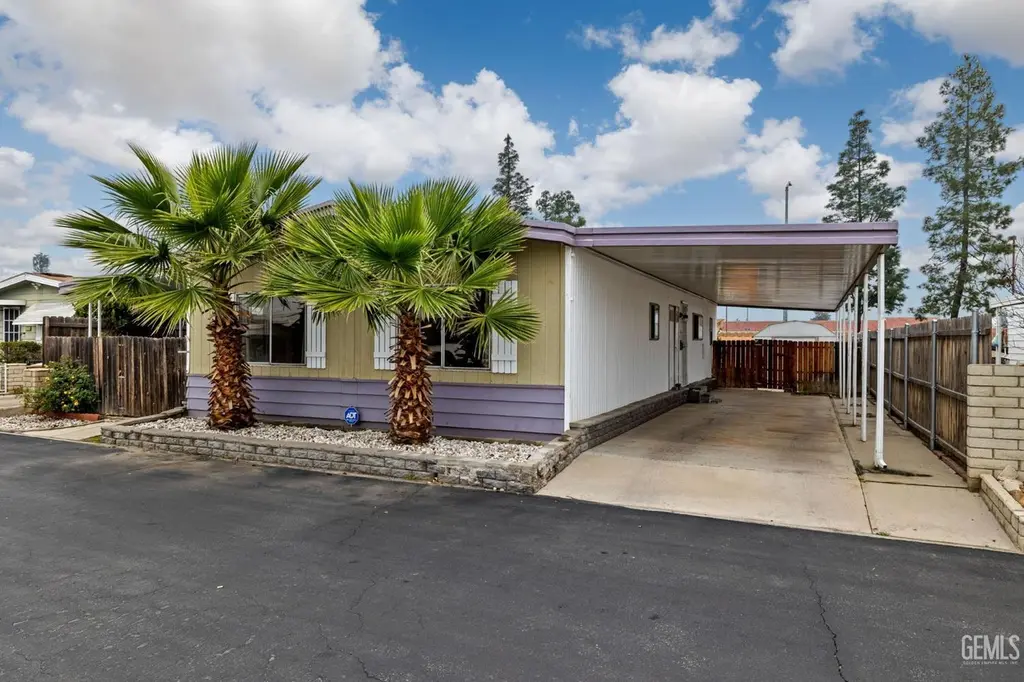
3535 Stine Rd #124 · Bakersfield, CA
Flood risk 1/10 · Minimal
- FEMA flood zone
- X (unshaded)
- Chance of flooding over 30 yrs
- 0.0%
- Est. flood insurance / yr
- $507 – $1,088
Fire risk 1/10 · Minimal
- Est. fire insurance / yr
- $659 – $1,223
Heat risk 8/10 · Major
- Hot days now (above 105°F)
- 7 days/yr
- Hot days in 30 yrs
- 18 days/yr
Wind risk 1/10 · Minimal
- Chance of severe wind over 30 yrs
- —
Air-quality risk 10/10 · Severe
- Unhealthy air days now
- 33 days/yr
- Unhealthy air days in 30 yrs
- 38 days/yr
Risk factors via First Street. Map © Google.
Why this score? — see what drove the D- grade
The composite is a weighted blend of 9 inputs, each scored 0–100. Each bar is that input's sub-score; the figure is the points it added to the 100-point composite (weight × sub-score).
- ARV discount +13.1/15.0
- 1% rule +8.9/10.0
- Schools +4.2/10.0
- Rent growth +3.3/5.0
- Livability +2.9/5.0
- Cash flow +2.6/30.0
- Condition / age +2.5/5.0
- DSCR +0.0/10.0
- Appreciation +0.0/10.0
$103,000
🖨 Deal sheet (PDF) 📄 Offer letter ✓ Due diligence
Listing remarks MLS
Beautifully updated, move-in ready 3-bedroom, 2-bath home featuring a bright open floor plan and stylish updates throughout. Enjoy granite countertops in the kitchen and bathrooms, updated flooring, and modern lighting. The covered patio is perfect for relaxing or entertaining, while the two-car carport and low-maintenance yard add everyday convenience. A perfect blend of comfort and functionality.
Key facts
- Low-maintenance yard
- Covered patio
- Updated flooring
Tags
Neighborhood map
What this means for you Summary
Snapshot
- This is a 3-bed/2.0-bath manufactured listed at $103k.
Deal economics
- At list price, monthly cash flow is $-353 ($-4k/yr) — negative.
- To cash-flow at today's rent, offer at most $52k (49.6% below list).
- Meets the 1% rule at list price ($1k rent vs $103k).
- Recommended offer: $52k (49.6% below list) — sets the bar for cash-flow.
- Cap rate 2.2% vs local median 3.6% in Bakersfield — below-typical yield; the buyer is paying a premium for something (appreciation thesis, condition, location) that the cap rate doesn't capture.
Location & tenants
- Location reads 58/100 on livability (#716 in CA) — a working-class tenant base; expect higher turnover. Strengths: housing A+; Watch: health & safety D, crime F, amenities F.
- Panama-Buena Vista Union (urban): math 37% / reading 52% proficiency, ranked #542 of 1,400 in CA (top 39%) — families likely to look elsewhere, expect single-tenant / working-renter base with shorter leases.
- Zoned schools: Louise Sandrini Elementary (597 students, 92% FRL); O. J. Actis Junior High (680 students, 83% FRL); West High (reading 90%, 2,025 students, 91% FRL) — zoned schools average 89% FRL vs 51% district-wide (38 pts higher); higher-poverty schools than district average — tighter screening recommended.
- Market conditions: Rents rising (+3.2%/yr); 207 active listings in the ZIP; 40 comparable units currently listed for rent nearby; rentals at typical pace (median 14d on market — plan ~3-4 weeks tenant-placement turnaround); 3,244 units permitted in Kern County in 2024 (73 in 5+ unit buildings).
Forward outlook
- Local home prices are declining (-3.0%/yr); year-one equity from $712 of loan paydown is wiped out by about $3k of value loss. Plan a longer hold.
- Kern County population projected at +17% by 2050 — long-run rental-demand tailwind backs the buy-and-hold thesis.
Negotiation context
- It's been on market 140 days — a 12% lower offer ($91k) is reasonable based on typical stale-listing flexibility.
- 2 sale attempts since 5y ago with the ask held roughly flat each time — persistent listings suggest the price (not the market) is what's stuck; bring a comps-based counter.
- Current owner paid $65k; list at $103k implies a 58% gain — meaningful room to come down on a strong offer.
Risks & watch-outs
- Watch-outs: HOA is 54% of rent.
- Climate carrying-cost: extreme-heat days projected 7→18/yr by 2055 (HVAC capex compounding) — expect insurance premiums to compound above CPI over the hold.
Questions for the listing agent
- What do current leases actually rent for vs. the listed asking? Can we see a recent rent roll and the last 12 months of T-12 income?
- It's been on market 140 days. Have you received any prior offers? Is the seller open to a 50% concession, seller financing, or rate buy-down credit?
- Built in 1975 — when were the roof, HVAC, electrical panel, plumbing, and water heater last replaced?
- What does the HOA fee cover, when was the last increase, and are there any pending special assessments or reserve-fund shortfalls?
- Why hasn't it sold? Are there any deal-killer items the seller is aware of (foundation, flood, title, zoning, code violations)?
- Is there a deadline driving the sale (1031 exchange, divorce, estate, relocation)? That informs how much negotiation room exists.
- Schools are D-rated, which usually means shorter tenancies and higher turnover. Who's the typical renter profile here, and what's been the actual vacancy rate?
- Crime grade is F in this area — have there been break-ins, vandalism, or insurance claims at this property in the last 3 years? What carrier currently insures it and at what premium?
- The area grade is low — what's the realistic commute time and amenity access for the typical tenant pool here? Any planned neighborhood developments (good or bad) we should know about?
- What's the average days-on-market for RENTAL listings here right now (not sales)? A rising rental-DOM trend means longer vacancies and softer asking-rent achievability than the comps imply.
- What's the recent tenant-quality profile in this submarket — average credit score on applications, eviction rate, late-payment / NSF rate, and stable-employment percentage? A property-management company in the area should have these aggregated.
- How much new for-sale + rental construction is in the pipeline within 1–3 miles? Heavy new supply typically softens prices + rents 12–24 months out; constrained supply supports both.
Investment metrics
- 1% rule
- 1.39% ✓
- Cap rate
- 2.18%
- Cash-on-cash
- -14.68%
- DSCR
- 0.35
- GRM
- 6.0
CMA / ARV
- ARV (median comp)
- $117,500
- List price
- $103,000
- Delta
- -12.34%
- Verdict
- UNDERPRICED
- Comps
- 2 within 1.0 mi
Show comp detail 3 sales within ~0.75 mi
| Address | Dist | Beds/Ba | Sqft | Sold | Price | $/sf | Match |
|---|---|---|---|---|---|---|---|
| 3535 Stine Rd #4 | 0.09mi | 3/2.0 | 1,536 (+7%) | 1mo | $120,000 | $78 | 84 |
| 3535 Stine Rd #194 | 0.09mi | 2/2.0 (-1) | 1,344 (-7%) | 12mo | $85,000 | $63 | 69 |
| 3535 Stine Rd #172 | 0.09mi | 3/2.0 | 1,624 (+13%) | 23mo | $127,000 | $78 | 56 |
Match score weights: distance 35% · size 25% · config 20% · recency 20%. Top-matched comps best support the ARV.
Projected returns pro-forma
-3.0% appreciation · 3.2% rent growth · sell at horizon
- IRR
- -42.6%
- Equity multiple
- -0.33×
- Total profit
- $-38,372
- Equity at exit
- $15,358
- IRR
- -62.7%
- Equity multiple
- -1.05×
- Total profit
- $-59,130
- Equity at exit
- $8,906
Cash invested: $28,840 (down + closing). Projections, not guarantees.
Landlord ↔ Tenant lean methodology
- Overall (STATE)
- 18 Strongly Tenant-Friendly
- State California
- 18 Strongly Tenant-Friendly · D+13
- County
- — inherits STATE
- City
- — inherits STATE
ZIP-level market 93309
- Rents YoY
- 3.2%
- Active inventory
- 207
- Price-to-rent
- 6.0×
Monthly cashflow live
- Estimated rent
- $1,435 high interval (Pro) →
- Mortgage (P&I)
- −$540
- Tax est. 1.5%
- −$129 /mo · $1,545/yr
- Insurance
- −$43
- HOA
- −$775
- Lot rent leased land?
- −$0
- Vacancy / Maint / Mgmt
- −$301
- Net cashflow
- $-353
Break-even live
Sensitivity live
| Price | -10% $-282 | -5% $-317 | +0% $-353 | +5% $-388 | +10% $-424 |
|---|---|---|---|---|---|
| Rent | -10% $-466 | -5% $-409 | +0% $-353 | +5% $-296 | +10% $-239 |
| Rate | -1.0pp $-301 | -0.5pp $-327 | base $-353 | +0.5pp $-379 | +1.0pp $-407 |
UW: 25.0% down · 7.5% · 30yr · 1.5% tax · 5.0% vac · 8.0% maint · 8.0% mgmt
Financing live
Cash to close
- Down payment
- $25,750
- Closing costs
- $3,090
- Reserves months
- —
- Total cash needed
- —
Loan-product check · same deal, 3 products live
Conventional
25% down · 7.5% · 30yr
- Down + closing
- —
- Monthly P&I
- —
- Monthly cashflow
- —
- DSCR
- —
- Eligible?
- —
Personal DTI + credit; lowest rate.
DSCR
20% down · 8.5% · 30yr
- Down + closing
- —
- Monthly P&I
- —
- Monthly cashflow
- —
- DSCR
- —
- Eligible?
- —
No personal income docs; deal must DSCR.
Hard money
10% down · 12.0% · 12mo
- Down + closing
- —
- Monthly P&I
- —
- Monthly cashflow
- —
- DSCR
- —
- Eligible?
- —
Short-term bridge; refi at stabilization.
Rent comps 40 comps
| Address | Beds | Baths | Sqft | Rent | $/sqft | DOM | Units | Dist |
|---|---|---|---|---|---|---|---|---|
| 3401 Starwood Ln Bakersfield, CA | 3.0 | 2.0 | 1293 | $1,750 | $1.35 | 14d | 1 | 0.20mi |
| 5001 Appleblossom Dr Unit 23 Bakersfield, CA | 2.0 | 1.0 | 960 | $1,350 | $1.41 | 6d | 1 | 0.23mi |
| 3401 Actis St Unit 15 Bakersfield, CA | 2.0 | 2.0 | 940 | $1,495 | $1.59 | 47d | 1 | 0.25mi |
| 5119 Appleblossom Dr Apt 1 Bakersfield, CA | 3.0 | 2.0 | 1860 | $1,800 | $0.97 | 6d | 1 | 0.27mi |
| 4508 Planz Rd Apt A Bakersfield, CA | 3.0 | 2.0 | 1400 | $1,700 | $1.21 | 6d | 1 | 0.28mi |
| 4513 Summer Side Ave Bakersfield, CA | 3.0 | 2.0 | 1555 | $2,250 | $1.45 | 6d | 1 | 0.29mi |
| 3509 Cardamon Dr Bakersfield, CA | 3.0 | 2.0 | 1104 | $1,900 | $1.72 | 47d | 1 | 0.32mi |
| 4505 Gardenwood Ln Bakersfield, CA | 3.0 | 2.5 | 1385 | $2,295 | $1.66 | 6d | 1 | 0.38mi |
| 4413 White Ln Bakersfield, CA | 3.0 | 2.0 | 1249 | $2,250 | $1.80 | 25d | 1 | 0.49mi |
| 4508 Foxboro Ave Bakersfield, CA | 3.0 | 2.0 | 1512 | $2,200 | $1.46 | 25d | 1 | 0.51mi |
| 5204 Curson Ave Bakersfield, CA | 3.0 | 2.0 | 1232 | $2,050 | $1.66 | 14d | 1 | 0.52mi |
| 4208 White Ln Unit A Bakersfield, CA | 3.0 | 2.5 | 1200 | $1,575 | $1.31 | 6d | 1 | 0.52mi |
| 4208 White Ln Apt B Bakersfield, CA | 3.0 | 2.5 | 1200 | $1,575 | $1.31 | 14d | 1 | 0.52mi |
| 5725 Sage Dr Bakersfield, CA | 4.0 | 2.0 | 1476 | $2,350 | $1.59 | 47d | 1 | 0.66mi |
| 6800 Wilson Rd Bakersfield, CA | 3.0 | 2.0 | 1088 | $2,070 | $1.90 | 14d | 1 | 0.71mi |
| 3029 N Half Moon Dr Bakersfield, CA | 2.0 | 2.0 | 1014 | $1,475 | $1.45 | 6d | 1 | 0.77mi |
| 2246 Hasti Acres Dr Bakersfield, CA | 3.0 | 2.0 | 1859 | $2,395 | $1.29 | 14d | 1 | 0.78mi |
| 4309 Rosewall St Bakersfield, CA | 3.0 | 2.0 | 1356 | $2,200 | $1.62 | 6d | 1 | 0.84mi |
| 3605 Truman Ave Bakersfield, CA | 4.0 | 2.0 | 1643 | $2,295 | $1.40 | 14d | 1 | 0.86mi |
| 3605 Biltmore Ln Bakersfield, CA | 2.0 | 2.0 | 1450 | $1,650 | $1.14 | 1d | 1 | 0.91mi |
| 6300 Spice Way Bakersfield, CA | 2.0 | 1.5 | 1000 | $1,595 | $1.59 | 1d | 1 | 0.94mi |
| 6300 Spice Way Unit 24 Bakersfield, CA | 2.0 | 1.5 | 1000 | $1,595 | $1.59 | 14d | 1 | 0.94mi |
| 6300 Spice Way #5 Bakersfield, CA | 2.0 | 1.5 | 1000 | $1,595 | $1.59 | 47d | 1 | 0.94mi |
| 2804 N Half Moon Dr Unit C Bakersfield, CA | 2.0 | 1.0 | 900 | $1,225 | $1.36 | 23d | 1 | 0.97mi |
| 5912 Almendra Ave Unit B Bakersfield, CA | 2.0 | 1.0 | 980 | $1,500 | $1.53 | 27d | 1 | 0.99mi |
| 3600 Sampson Ct Unit A Bakersfield, CA | 2.0 | 1.5 | 945 | $1,250 | $1.32 | 27d | 1 | 1.00mi |
| 3600 Sampson Ct Unit A Bakersfield, CA | 2.0 | 1.5 | 936 | $1,395 | $1.49 | 47d | 1 | 1.00mi |
| 2100 Pinon Springs Cir Unit A Bakersfield, CA | 3.0 | 1.5 | 1040 | $1,595 | $1.53 | 23d | 1 | 1.04mi |
| 5051 Ming Ave Bakersfield, CA | 1.0–3.0 | 1.0–2.0 | 925 | $1,695 | $1.83 | 6d | 9 | 1.05mi |
| 2600 Chandler Ct Bakersfield, CA | 2.0 | 1.5 | 1073 | $1,495 | $1.39 | 18d | 1 | 1.10mi |
| 2601 Ashe Rd Bakersfield, CA | 2.0 | 1.5–2.0 | 1054 | $1,862 | $1.77 | 47d | 5 | 1.13mi |
| 6500 White Ln Unit 6538 Bakersfield, CA | 3.0 | 2.0 | 1400 | $1,795 | $1.28 | 6d | 1 | 1.14mi |
| 6500 White Ln Unit 6529 Bakersfield, CA | 2.0 | 2.0 | 1010 | $1,750 | $1.73 | 14d | 1 | 1.14mi |
| 2500 Ashe Rd Apt B Bakersfield, CA | 2.0 | 1.0 | 925 | $1,150 | $1.24 | 6d | 1 | 1.16mi |
| 2601 Ashe Rd #1 Bakersfield, CA | 2.0 | 1.5 | 1151 | $1,850 | $1.61 | 18d | 1 | 1.18mi |
| 3901 Soranno Ave Bakersfield, CA | 2.0 | 1.0 | 900 | $1,200 | $1.33 | 47d | 1 | 1.18mi |
| 3101 Coventry Dr Bakersfield, CA | 2.0 | 2.0 | 945 | $919 | $0.97 | 1d | 1 | 1.21mi |
| 2704 Villalovos Ct Unit 2 Bakersfield, CA | 3.0 | 2.0 | 1092 | $1,650 | $1.51 | 47d | 1 | 1.25mi |
| 2801 El Berrendo Ave Unit 1 Bakersfield, CA | 3.0 | 2.0 | 1491 | $2,395 | $1.61 | 18d | 1 | 1.29mi |
| 2805 Cambria Ave Bakersfield, CA | 3.0 | 1.5 | 1395 | $2,050 | $1.47 | 1d | 1 | 1.35mi |
HOA detail
- Monthly dues
- $775 · $9,300/yr
Listing history 9 events
-
2026-06-18days on market $103,000 Active 140 DOM
-
2026-06-17status $103,000 Active 139 DOM
-
2026-03-17price $103,000 401-char remark
Show marketing remark (401 chars)
Beautifully updated, move-in ready 3-bedroom, 2-bath home featuring a bright open floor plan and stylish updates throughout. Enjoy granite countertops in the kitchen and bathrooms, updated flooring, and modern lighting. The covered patio is perfect for relaxing or entertaining, while the two-car carport and low-maintenance yard add everyday convenience. A perfect blend of comfort and functionality.
-
2026-01-08$108,000 Active 401-char remark
Show marketing remark (401 chars)
Beautifully updated, move-in ready 3-bedroom, 2-bath home featuring a bright open floor plan and stylish updates throughout. Enjoy granite countertops in the kitchen and bathrooms, updated flooring, and modern lighting. The covered patio is perfect for relaxing or entertaining, while the two-car carport and low-maintenance yard add everyday convenience. A perfect blend of comfort and functionality.
-
2021-08-27soldstatus $65,000 Sold 208-char remark
Show marketing remark (208 chars)
This 1440 Sq ft manufacture home includes 2 bedrooms 2 baths, Large living area, dining room, Bonus room, indoor laundry. It also includes a 2 car carport, and a nice patio. Community is very quiet and clean.
-
2021-08-13status Pending 208-char remark
Show marketing remark (208 chars)
This 1440 Sq ft manufacture home includes 2 bedrooms 2 baths, Large living area, dining room, Bonus room, indoor laundry. It also includes a 2 car carport, and a nice patio. Community is very quiet and clean.
-
2021-07-07price $69,900 208-char remark
Show marketing remark (208 chars)
This 1440 Sq ft manufacture home includes 2 bedrooms 2 baths, Large living area, dining room, Bonus room, indoor laundry. It also includes a 2 car carport, and a nice patio. Community is very quiet and clean.
-
2021-06-25$79,900 Active 208-char remark
Show marketing remark (208 chars)
This 1440 Sq ft manufacture home includes 2 bedrooms 2 baths, Large living area, dining room, Bonus room, indoor laundry. It also includes a 2 car carport, and a nice patio. Community is very quiet and clean.
-
2019-04-18price $45,000
ⓘ Source: listings_history table (triggers on properties + properties_extension) + one-shot
backfill from property_details.listing_events for pre-trigger history.
Climate risk First Street
- Flood 1/10 Low FEMA zone X (unshaded) · 0% chance over 30 yrs
- Wildfire 1/10 Low
- Heat 8/10 Severe 7 d/yr ≥105°F today · 18 d/yr by 30 yrs out
- Wind 1/10 Low
- Air quality 10/10 Extreme 33 unhealthy d/yr today · 38 by 30 yrs out
Nearby sold comps map
Loading sold comps map…
Walkable amenities ~0.75 mi
Loading nearby amenities…
Taxation est. · year 1
- Rental income
- $17,226
- − Mortgage interest
- −$5,770
- − Property taxes
- −$1,545
- − Insurance
- −$515
- − Repairs & maintenance
- −$1,378
- − Management
- −$1,378
- − HOA
- −$9,300
- − Depreciation
- −$2,996
- Taxable loss
- −$5,656
- Est. tax savings @ 24.0%
- +$1,358
- After-tax cash flow
- $-2,876/yr
For passive investors: Depreciation is non-cash, so a rental often shows a tax loss while cash-flowing — sheltering income. Rental losses are passive: they offset passive income freely, and up to $25,000/yr can offset ordinary (W-2) income if you actively participate and your MAGI is under $100k (phasing out to $0 by $150k); unused losses carry forward. On sale, claimed depreciation is recaptured at up to 25%, and gains may owe capital-gains tax (a 1031 exchange can defer both). Figures are a year-1 estimate at your 24.0% rate — not tax advice; consult a CPA.
Schools (NCES district)
- District
- Panama-Buena Vista Union
- NCES district ID
- 0606390
- Math proficiency
- 37% ▲ 3.00%
- Reading proficiency
- 52% ▲ 1.00%
- Median HH income
- $63,361
- Composite
- 41.71/100
- National rank
- #7191
- State rank
- #542 of 1400 in CA
Livability — Bakersfield
- Score
- 58/100
- State rank
- #716
- US rank
- #21355
Category grades
Schools grade is shown separately in the Schools card above.
Census & demographics
- Census place
- Bakersfield, CA
- County
- Kern County · 710,371 people
- City population
- 499,124
- Metro
- Bakersfield, CA
- Population (ZIP)
- 63,217
- Household income
- $63,544
- Rent vs Own
- Severe rent burden
- 3180.0
Population outlook (Kern County) Hauer SSP2
- Today (2025)
- 947,286 people
- By 2030
- 978,984 · +3.3%
- By 2040
- 1,045,018 · +10.3%
- By 2050
- 1,105,232 · +16.7%
- By 2075
- 1,229,538 · +29.8%
- By 2100
- 1,238,059 · +30.7%
Race, ethnicity, and origin ACS 2023
- Neighborhood character
- Diverse neighborhood (Simpson 0.61)
- Race & ethnicity
- Hispanic / Latino 54% White 30% Two or more races 29% Black 8% Asian 4% Native American 1%
- Hispanic origin (detail)
- Mexican 46%
- Common ancestry
- Slovak 2% Italian 1% Lithuanian 1%
- Foreign-born
- 16% · Canada, China
- Languages at home
- 62% English-only · Spanish 34% Other Indo-European 1% Tagalog/Filipino 1%
Political lean MEDSL · Kern
- 2024 margin
- Strong R (+21.1) · D 38.2% · R 59.3% · Other 2.5%
- 2008→2024 swing
- -3.3pp toward R · 2008: -17.8pp · 2024: -21.1pp
- All cycles
- 2024: R+21.1 2020: R+10.2 2016: R+15.0 2012: R+20.9 2008: R+17.8
Not yet ingested
- Civics
- —
Market trends
- HPI YoY
- ▼ -296.97%
- Current HPI
- 376.8674
- Rent YoY
- ▲ 3.20%
- Metro
- Bakersfield, CA
- State GDP YoY
- ▲ 3.21%
- F500 in state
- 116
Industry mix (Fortune 500 HQ in CA)
| Industry | F500 HQs | Revenue |
|---|---|---|
| Technology | 27 | $1,492B |
|
||
| Financial Services | 3 | $174B |
|
||
| Retail | 3 | $44B |
|
||
| Insurance | 3 | $26B |
|
||
| Media / Entertainment | 2 | $115B |
|
||
| Pharmaceuticals / Biotech | 2 | $62B |
|
||
Price history
+128.9% since first listed7 events — show timeline
- 2026-03-17 Price Changed $103,000 GEMLS
- 2026-01-08 Listed $108,000 GEMLS
- 2021-08-27 Sold (MLS) $65,000 GEMLS
- 2021-08-13 Pending — GEMLS
- 2021-07-07 Price Changed $69,900 GEMLS
- 2021-06-25 Listed $79,900 GEMLS
- 2019-04-18 Price Changed $45,000 GEMLS
Cash-flow waterfall
monthlySold comps — $/sqft
last 12 mo · ≤1 miLoading sold comps…