95 Church St · Dora, AL
Flood risk 1/10 · Minimal
- FEMA flood zone
- X (unshaded)
- Chance of flooding over 30 yrs
- 0.0%
- Est. flood insurance / yr
- $473 – $860
Fire risk 6/10 · Moderate
- Est. fire insurance / yr
- $916 – $1,700
Heat risk 6/10 · Moderate
- Hot days now (above 107°F)
- 7 days/yr
- Hot days in 30 yrs
- 19 days/yr
Wind risk 6/10 · Moderate
- Chance of severe wind over 30 yrs
- 27.0%
Air-quality risk 4/10 · Minor
- Unhealthy air days now
- 5 days/yr
- Unhealthy air days in 30 yrs
- 6 days/yr
Risk factors via First Street. Map © Google.
Why this score? — see what drove the D grade
The composite is a weighted blend of 9 inputs, each scored 0–100. Each bar is that input's sub-score; the figure is the points it added to the 100-point composite (weight × sub-score).
- Appreciation +10.0/10.0
- Cash flow +9.4/30.0
- ARV discount +5.4/15.0
- Livability +2.9/5.0
- 1% rule +2.8/10.0
- DSCR +2.6/10.0
- Rent growth +2.5/5.0
- Condition / age +2.5/5.0
- Schools +2.2/10.0
$149,900
🖨 Deal sheet 📄 Offer letter ✓ Due diligence
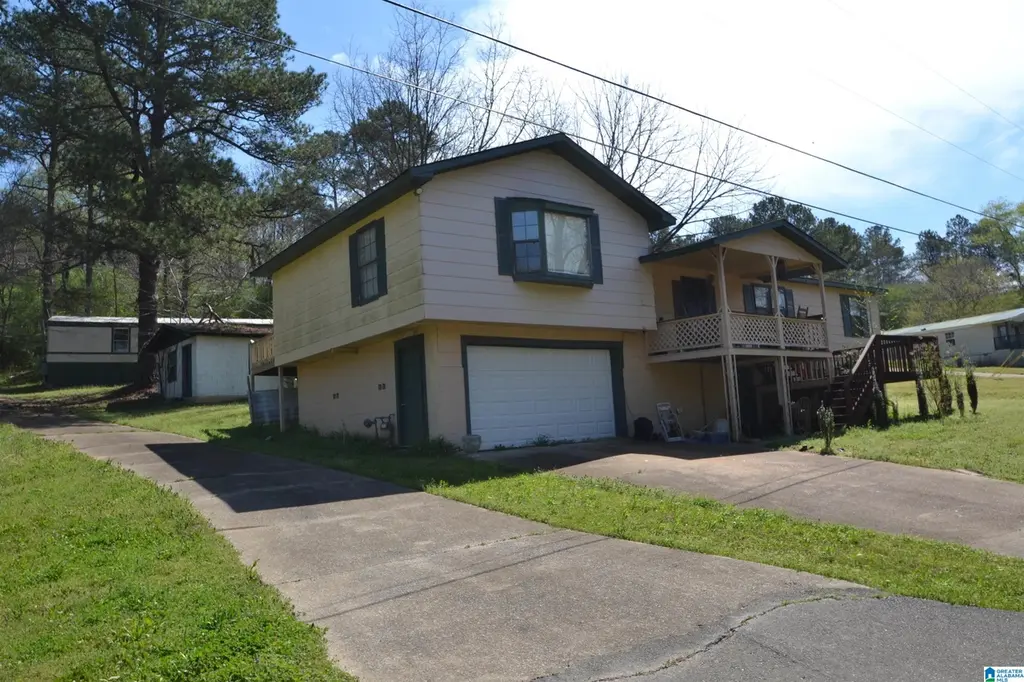
Listing remarks MLS
More pictures and information coming. Property also includes 16 x 80 manufactured home with three bedrooms, two full baths as well.
Key facts
- 0.5 acre lot
- Garage
- Built 1976
Neighborhood map
What this means for you Summary
Snapshot
- This is a 3-bed/1.0-bath single-family listed at $150k.
Deal economics
- At list price, monthly cash flow is $-108 ($-1k/yr) — negative.
- To cash-flow at today's rent, offer at most $134k (10.4% below list).
- To meet the 1% rule (rent ≥ 1% of price), the offer needs to be $117k (21.6% below list).
- Recommended offer: $117k (21.6% below list) — sets the bar for 1% rule.
Location & tenants
- Location reads 57/100 on livability (#374 in AL) — a working-class tenant base; expect higher turnover. Strengths: cost of living A+, housing A+; Watch: schools D, amenities F, commute F.
- Walker County (rural): math 13% / reading 39% proficiency, ranked #89 of 129 in AL (top 69%) — low school quality limits family demand, transient renter base, plan for 1-2y turnover.
- Market conditions: 29 active listings in the ZIP; 36 units permitted in Walker County in 2024 (0 in 5+ unit buildings).
Forward outlook
- In year one you build about $16k of equity ($1k loan paydown + $15k appreciation (10.0% local appreciation)).
- Walker County population projected at -21% by 2050 — secular population decline; favor cash flow + early exit over multi-decade hold.
- By year 3, paydown + projected appreciation supports a ~$41k cash-out refi (75% LTV) — recoverable capital for the next deal without selling this one.
Negotiation context
- It's been on market 85 days — a 6% lower offer ($141k) is reasonable based on typical stale-listing flexibility.
Risks & watch-outs
- Climate carrying-cost: major wind risk, 27% chance of damaging wind over 30y; major wildfire risk; extreme-heat days projected 7→19/yr by 2055 (HVAC capex compounding) — expect insurance premiums to compound above CPI over the hold.
Questions for the listing agent
- What do current leases actually rent for vs. the listed asking? Can we see a recent rent roll and the last 12 months of T-12 income?
- It's been on market 85 days. Have you received any prior offers? Is the seller open to a 22% concession, seller financing, or rate buy-down credit?
- Built in 1976 — when were the roof, HVAC, electrical panel, plumbing, and water heater last replaced?
- Why hasn't it sold? Are there any deal-killer items the seller is aware of (foundation, flood, title, zoning, code violations)?
- Is there a deadline driving the sale (1031 exchange, divorce, estate, relocation)? That informs how much negotiation room exists.
- Schools are D-rated, which usually means shorter tenancies and higher turnover. Who's the typical renter profile here, and what's been the actual vacancy rate?
- The area grade is low — what's the realistic commute time and amenity access for the typical tenant pool here? Any planned neighborhood developments (good or bad) we should know about?
- What's the average days-on-market for RENTAL listings here right now (not sales)? A rising rental-DOM trend means longer vacancies and softer asking-rent achievability than the comps imply.
- What's the recent tenant-quality profile in this submarket — average credit score on applications, eviction rate, late-payment / NSF rate, and stable-employment percentage? A property-management company in the area should have these aggregated.
- How much new for-sale + rental construction is in the pipeline within 1–3 miles? Heavy new supply typically softens prices + rents 12–24 months out; constrained supply supports both.
Investment metrics
- 1% rule
- 0.78% ✗
- Cap rate
- 5.43%
- Cash-on-cash
- -3.08%
- DSCR
- 0.86
- GRM
- 10.6
CMA / ARV
- ARV (median comp)
- $143,105
- List price
- $149,900
- Delta
- 4.75%
- Verdict
- FAIR
- Comps
- 17 within 2.0 mi
Projected returns pro-forma
10.0% appreciation · 3.0% rent growth · sell at horizon
- IRR
- 22.1%
- Equity multiple
- 2.78×
- Total profit
- $74,787
- Equity at exit
- $135,042
- IRR
- 19.8%
- Equity multiple
- 6.38×
- Total profit
- $225,674
- Equity at exit
- $291,223
Cash invested: $41,972 (down + closing). Projections, not guarantees.
Landlord ↔ Tenant lean methodology
- Overall (STATE)
- 90 Strongly Landlord-Friendly
- State Alabama
- 90 Strongly Landlord-Friendly · R+15
- County
- — inherits STATE
- City
- — inherits STATE
ZIP-level market 35130
- Home prices YoY
- 7.0%
- Active inventory
- 29
- Price-to-rent
- 10.6×
Monthly cashflow live
- Estimated rent
- $1,175 medium interval (Pro) →
- Mortgage (P&I)
- −$786
- Tax est. 1.5%
- −$187 /mo · $2,248/yr
- Insurance
- −$62
- HOA
- −$0
- Vacancy / Maint / Mgmt
- −$247
- Net cashflow
- $-108
Break-even live
UW: 25.0% down · 7.5% · 30yr · 1.5% tax · 5.0% vac · 8.0% maint · 8.0% mgmt
Financing live
Cash to close
- Down payment
- $37,475
- Closing costs
- $4,497
- Reserves months
- —
- Total cash needed
- —
Loan-product check · same deal, 3 products live
Conventional
25% down · 7.5% · 30yr
- Down + closing
- —
- Monthly P&I
- —
- Monthly cashflow
- —
- DSCR
- —
- Eligible?
- —
Personal DTI + credit; lowest rate.
DSCR
20% down · 8.5% · 30yr
- Down + closing
- —
- Monthly P&I
- —
- Monthly cashflow
- —
- DSCR
- —
- Eligible?
- —
No personal income docs; deal must DSCR.
Hard money
10% down · 12.0% · 12mo
- Down + closing
- —
- Monthly P&I
- —
- Monthly cashflow
- —
- DSCR
- —
- Eligible?
- —
Short-term bridge; refi at stabilization.
Listing history 16 events
-
2026-06-18days on market $149,900 Active 85 DOM
-
2026-06-17days on market $149,900 Active 84 DOM
-
2026-06-16days on market $149,900 Active 83 DOM
-
2026-06-15days on market $149,900 Active 82 DOM
-
2026-06-13days on market $149,900 Active 80 DOM
-
2026-06-13days on market $149,900 Active 79 DOM
-
2026-06-10days on market $149,900 Active 77 DOM
-
2026-06-09days on market $149,900 Active 76 DOM
-
2026-06-08days on market $149,900 Active 75 DOM
-
2026-06-07days on market $149,900 Active 74 DOM
-
2026-06-05days on market $149,900 Active 71 DOM
-
2026-06-03days on market $149,900 Active 70 DOM
-
2026-06-03days on market $149,900 Active 69 DOM
-
2026-06-01days on market $149,900 Active 68 DOM
-
2026-05-31days on market $149,900 Active 67 DOM
-
2026-03-25$149,900 Active 131-char remark
Show marketing remark (131 chars)
More pictures and information coming. Property also includes 16 x 80 manufactured home with three bedrooms, two full baths as well.
ⓘ Source: listings_history table (triggers on properties + properties_extension) + one-shot
backfill from property_details.listing_events for pre-trigger history.
Climate risk First Street
- Flood 1/10 Low FEMA zone X (unshaded) · 0% chance over 30 yrs
- Wildfire 6/10 Major
- Heat 6/10 Major 7 d/yr ≥107°F today · 19 d/yr by 30 yrs out
- Wind 6/10 Major 27% chance of damaging wind over 30 yrs
- Air quality 4/10 Moderate 5 unhealthy d/yr today · 6 by 30 yrs out
Nearby sold comps map
Loading sold comps map…
Walkable amenities ~0.75 mi
Loading nearby amenities…
Taxation est. · year 1
- Rental income
- $14,097
- − Mortgage interest
- −$8,397
- − Property taxes
- −$2,248
- − Insurance
- −$750
- − Repairs & maintenance
- −$1,128
- − Management
- −$1,128
- − Depreciation
- −$4,361
- Taxable loss
- −$3,914
- Est. tax savings @ 24.0%
- +$939
- After-tax cash flow
- $-355/yr
For passive investors: Depreciation is non-cash, so a rental often shows a tax loss while cash-flowing — sheltering income. Rental losses are passive: they offset passive income freely, and up to $25,000/yr can offset ordinary (W-2) income if you actively participate and your MAGI is under $100k (phasing out to $0 by $150k); unused losses carry forward. On sale, claimed depreciation is recaptured at up to 25%, and gains may owe capital-gains tax (a 1031 exchange can defer both). Figures are a year-1 estimate at your 24.0% rate — not tax advice; consult a CPA.
Schools (NCES district)
- District
- Walker County
- NCES district ID
- 0103450
- Math proficiency
- 13% ▼ -28.00%
- Reading proficiency
- 39% ▼ -5.00%
- Median HH income
- $36,664
- Composite
- 21.51/100
- National rank
- #8321
- State rank
- #89 of 129 in AL
Livability — Dora
- Score
- 57/100
- State rank
- #374
- US rank
- #21559
Category grades
Schools grade is shown separately in the Schools card above.
Census & demographics
- Population (ZIP)
- 3,239
Population outlook (Walker County) Hauer SSP2
- Today (2025)
- 61,037 people
- By 2030
- 58,391 · -4.3%
- By 2040
- 53,080 · -13.0%
- By 2050
- 48,031 · -21.3%
- By 2075
- 37,799 · -38.1%
- By 2100
- 29,001 · -52.5%
Race, ethnicity, and origin ACS 2023
- Neighborhood character
- Predominantly White (85%)
- Race & ethnicity
- White 85% Two or more races 9% Black 6%
- Common ancestry
- Scotch-Irish 6% Serbian 1% Italian 1%
- Foreign-born
- 0% · Canada, Jamaica
Political lean MEDSL · Walker
- 2024 margin
- Solid R (+71.8) · D 13.8% · R 85.6%
- 2008→2024 swing
- -25.4pp toward R · 2008: -46.4pp · 2024: -71.8pp
- All cycles
- 2024: R+71.8 2020: R+67.9 2016: R+67.4 2012: R+52.9 2008: R+46.4
Not yet ingested
- Civics
- —
Market trends
- HPI YoY
- ▲ 11.51%
- Current HPI
- 176.96
- Rent YoY
- —
- Metro
- —
- State GDP YoY
- ▲ 2.94%
- F500 in state
- 4
Industry mix (Fortune 500 HQ in AL)
| Industry | F500 HQs | Revenue |
|---|---|---|
| Financial Services | 1 | $8B |
|
||
| Healthcare | 1 | $5B |
|
||
Price history
1 event — show timeline
- 2026-03-25 Listed $149,900 Greater Alabama MLS
Property tax history
-0.8%/yrLatest (2024): $243 · +10.7% YoY. Source: county tax records.
Cash-flow waterfall
monthlySold comps — $/sqft
last 12 mo · ≤1 miLoading sold comps…