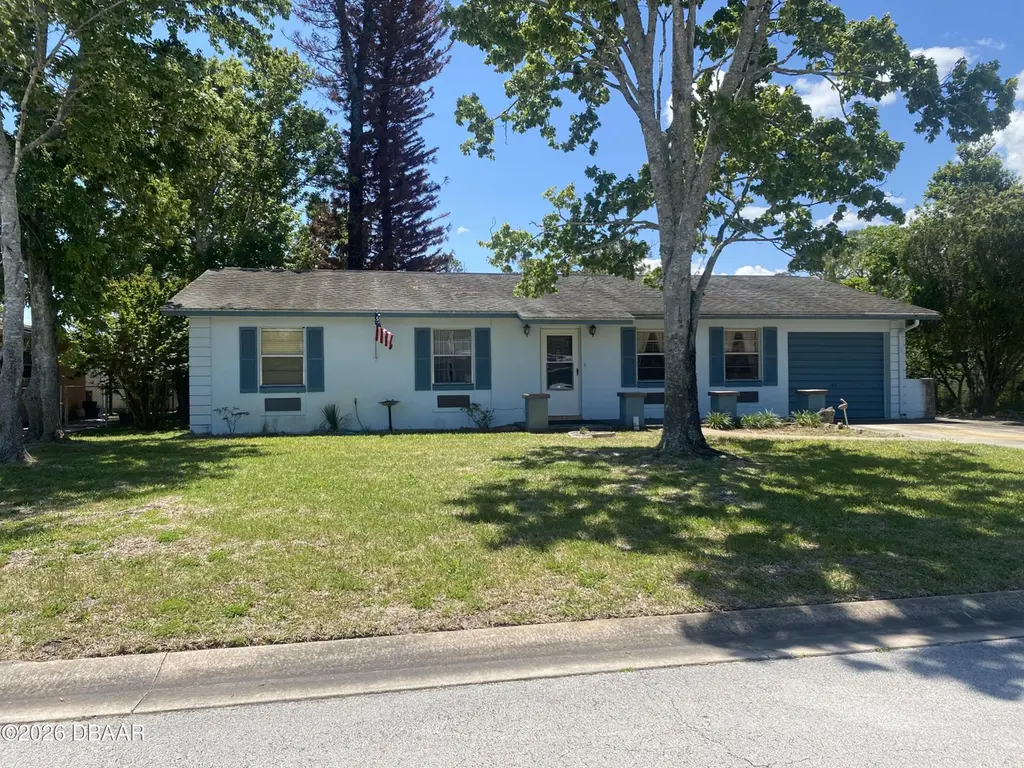
67 Broadmoor Cir · Ormond Beach, FL
Flood risk 6/10 · Moderate
- FEMA flood zone
- X (unshaded)
- Chance of flooding over 30 yrs
- 0.57%
- Est. flood insurance / yr
- $507 – $1,088
Fire risk 2/10 · Minimal
- Est. fire insurance / yr
- $947 – $1,759
Heat risk 10/10 · Severe
- Hot days now (above 105°F)
- 7 days/yr
- Hot days in 30 yrs
- 20 days/yr
Wind risk 10/10 · Severe
- Chance of severe wind over 30 yrs
- 99.0%
Air-quality risk 3/10 · Minor
- Unhealthy air days now
- 3 days/yr
- Unhealthy air days in 30 yrs
- 3 days/yr
Risk factors via First Street. Map © Google.
Why this score? — see what drove the C- grade
The composite is a weighted blend of 9 inputs, each scored 0–100. Each bar is that input's sub-score; the figure is the points it added to the 100-point composite (weight × sub-score).
- Cash flow +22.2/30.0
- ARV discount +7.5/15.0
- DSCR +7.1/10.0
- 1% rule +4.6/10.0
- Livability +4.2/5.0
- Schools +3.9/10.0
- Rent growth +2.9/5.0
- Condition / age +2.5/5.0
- Appreciation +0.0/10.0
$239,000
🖨 Deal sheet (PDF) 📄 Offer letter ✓ Due diligence
Listing remarks
Welcome to this charming fixer-upper with 3 bedrooms, and 2 full baths right in the heart of Ormond Beach. upgraded floors throughout the main living areas. Spacious family room/bonus room that leads to a screened back porch and the fenced backyard, makes relaxing and entertaining easy. Convenient location to Central Park, for easy access to shopping, great restaurants, and a short drive to the beach. A little TLC and this one will shine! Schedule your private showing today!
Key facts
- Screened back porch
- Short drive to beach
- Convenient location
Tags
Property features AI
Exterior
- Parking: Attached garage (1 car)
- Security: Smoke detector(s)
- Utilities: Public water; Public sewer; Cable available
- Home design: Single-family residence; One story; Faces north
- Construction: Block construction; Block foundation; Shingle roof; Built with residential single-family design
- Exterior features: Patio (screened); Back yard fencing; Chain link fence; Privacy wood fence; Cleared lot with few trees; Concrete road frontage (city street); Public maintained road
Interior
- Kitchen: Refrigerator; Dishwasher
- Flooring: Carpet; Tile
- Bathrooms: 2 full bathrooms
- Heating & cooling: Central heat; Electric heat; Heat pump; Central air; Ceiling fans
- Interior features: Ceiling fans; Pantry; Fireplace (1)
- Laundry & utility: Washer hookup in unit; Electric dryer hookup; Washer and Dryer included
Neighborhood map
What this means for you Summary
Snapshot
- This is a 3-bed/2.0-bath single-family listed at $239k.
Deal economics
- At list price, monthly cash flow is $391 ($5k/yr) — positive.
- The deal already cash-flows at list — no discount required.
- To meet the 1% rule (rent ≥ 1% of price), the offer needs to be $229k (4.1% below list).
- Recommended offer: $229k (4.1% below list) — sets the bar for 1% rule.
- Cap rate 8.3% vs local median 3.9% in Ormond Beach — top-decile yield for the area; either an underpriced asset or a hidden risk that comps aren't pricing in. Stress-test before assuming the spread holds.
Location & tenants
- Location reads 83/100 on livability (#55 in FL, #965 nationally) — a professional / high-income tenant draw. Strengths: amenities A+, housing A+, health & safety A+; Watch: commute F.
- Volusia (suburban): math 44% / reading 49% proficiency, ranked #47 of 73 in FL (top 64%) — families likely to look elsewhere, expect single-tenant / working-renter base with shorter leases.
- Zoned schools: Pine Trail Elementary School (math 77% / reading 72%, grade A, #230 of 2,144 statewide, top 12%, 688 students, 45% FRL); Ormond Beach Middle School (math 57% / reading 55%, grade B-, #175 of 571 statewide, top 31%, 990 students, 48% FRL); Mainland High School (math 30% / reading 37%, grade F, #400 of 667 statewide, top 61%, 1,855 students, 64% FRL) — zoned schools at 52% FRL track the district average.
- Market conditions: Rents rising (+1.6%/yr); 986 active listings in the ZIP; 13 comparable units currently listed for rent nearby; rentals at typical pace (median 25d on market — plan ~3-4 weeks tenant-placement turnaround); 3,402 units permitted in Volusia County in 2024 (681 in 5+ unit buildings).
- This rent runs 39% of the median local income ($71k/yr) — at the standard rent-burdened threshold; future hikes will face affordability resistance.
Forward outlook
- Local home prices are declining (-3.0%/yr); year-one equity from $2k of loan paydown is wiped out by about $7k of value loss. Plan a longer hold.
- Volusia County population projected at +19% by 2050 — long-run rental-demand tailwind backs the buy-and-hold thesis.
Negotiation context
- It's been on market 18 days — a 2% lower offer ($235k) is reasonable based on typical stale-listing flexibility.
- 6 sale attempts since 21y ago with the ask held roughly flat each time — persistent listings suggest the price (not the market) is what's stuck; bring a comps-based counter.
- Current owner paid $159k; list at $239k implies a 51% gain — meaningful room to come down on a strong offer.
Risks & watch-outs
- Climate carrying-cost: major flood risk; severe wind risk, 99% chance of damaging wind over 30y; extreme-heat days projected 7→20/yr by 2055 (HVAC capex compounding) — expect insurance premiums to compound above CPI over the hold.
Questions for the listing agent
- Built in 1974 — when were the roof, HVAC, electrical panel, plumbing, and water heater last replaced?
- Is there a deadline driving the sale (1031 exchange, divorce, estate, relocation)? That informs how much negotiation room exists.
- Schools are B-rated — typically a magnet for longer-tenancy family renters. What's the average tenant stay here, and is there a school-zone premium baked into asking?
- What's the average days-on-market for RENTAL listings here right now (not sales)? A rising rental-DOM trend means longer vacancies and softer asking-rent achievability than the comps imply.
- What's the recent tenant-quality profile in this submarket — average credit score on applications, eviction rate, late-payment / NSF rate, and stable-employment percentage? A property-management company in the area should have these aggregated.
- How much new for-sale + rental construction is in the pipeline within 1–3 miles? Heavy new supply typically softens prices + rents 12–24 months out; constrained supply supports both.
Investment metrics
- 1% rule
- 0.96% ✗
- Cap rate
- 8.25%
- Cash-on-cash
- 7.00%
- DSCR
- 1.31
- GRM
- 8.7
CMA / ARV
No comps found within radius.
Projected returns pro-forma
-3.0% appreciation · 1.64% rent growth · sell at horizon
- IRR
- -7.0%
- Equity multiple
- 0.75×
- Total profit
- $-17,056
- Equity at exit
- $35,636
- IRR
- 1.0%
- Equity multiple
- 1.07×
- Total profit
- $4,387
- Equity at exit
- $20,664
Cash invested: $66,920 (down + closing). Projections, not guarantees.
Landlord ↔ Tenant lean methodology
- Overall (STATE)
- 87 Strongly Landlord-Friendly
- State Florida
- 87 Strongly Landlord-Friendly · R+3
- County
- — inherits STATE
- City
- — inherits STATE
ZIP-level market 32174
- Rents YoY
- 1.6%
- Active inventory
- 986
- Price-to-rent
- 8.7×
Monthly cashflow live
- Estimated rent
- $2,291 high interval (Pro) →
- Mortgage (P&I)
- −$1,253
- Tax from tax record
- −$67 /mo · $801/yr
- Insurance
- −$100
- HOA
- −$0
- Vacancy / Maint / Mgmt
- −$481
- Net cashflow
- $391
Break-even live
Sensitivity live
| Price | -10% $526 | -5% $458 | +0% $391 | +5% $323 | +10% $255 |
|---|---|---|---|---|---|
| Rent | -10% $210 | -5% $300 | +0% $391 | +5% $481 | +10% $572 |
| Rate | -1.0pp $511 | -0.5pp $451 | base $391 | +0.5pp $329 | +1.0pp $266 |
UW: 25.0% down · 7.5% · 30yr · 1.5% tax · 5.0% vac · 8.0% maint · 8.0% mgmt
Financing live
Cash to close
- Down payment
- $59,750
- Closing costs
- $7,170
- Reserves months
- —
- Total cash needed
- —
Loan-product check · same deal, 3 products live
Conventional
25% down · 7.5% · 30yr
- Down + closing
- —
- Monthly P&I
- —
- Monthly cashflow
- —
- DSCR
- —
- Eligible?
- —
Personal DTI + credit; lowest rate.
DSCR
20% down · 8.5% · 30yr
- Down + closing
- —
- Monthly P&I
- —
- Monthly cashflow
- —
- DSCR
- —
- Eligible?
- —
No personal income docs; deal must DSCR.
Hard money
10% down · 12.0% · 12mo
- Down + closing
- —
- Monthly P&I
- —
- Monthly cashflow
- —
- DSCR
- —
- Eligible?
- —
Short-term bridge; refi at stabilization.
Rent comps 13 comps
| Address | Beds | Baths | Sqft | Rent | $/sqft | DOM | Units | Dist |
|---|---|---|---|---|---|---|---|---|
| 402 Fleming Ave Ormond Beach, FL | 3.0 | 2.0 | 1495 | $2,560 | $1.71 | 22d | 1 | 0.14mi |
| 559 Cameo Dr Ormond Beach, FL | 3.0 | 2.5 | 1668 | $2,310 | $1.38 | 25d | 1 | 0.71mi |
| 733 Buena Vista Ave Ormond Beach, FL | 3.0 | 2.0 | 1485 | $2,400 | $1.62 | 25d | 1 | 0.82mi |
| 450 Tomoka Ave Unit 215 Ormond Beach, FL | 2.0 | 1.5 | 1150 | $1,750 | $1.52 | 15d | 1 | 0.91mi |
| 1953 Nelson Ave Ormond Beach, FL | 4.0 | 1.5 | 1600 | $2,000 | $1.25 | 25d | 1 | 1.04mi |
| 1767 Valencia Ave Ormond Beach, FL | 4.0 | 2.0 | 1216 | $2,100 | $1.73 | 25d | 1 | 1.17mi |
| 81 Tomoka Ave Ormond Beach, FL | 2.0 | 2.5 | 1500 | $1,950 | $1.30 | 25d | 1 | 1.23mi |
| 1575 Megan Bay Cir Daytona Beach, FL | 3.0 | 2.0 | 1232 | $1,800 | $1.46 | 25d | 1 | 1.27mi |
| 1420 Alabama Ave Daytona Beach, FL | 4.0 | 2.0 | 1367 | $1,824 | $1.33 | 20d | 1 | 1.40mi |
| 1235 Alcazar St Daytona Beach, FL | 3.0 | 2.0 | 1498 | $2,100 | $1.40 | 25d | 1 | 1.41mi |
| 1559 Hammock Dr Unit B Holly Hill, FL | 2.0 | 1.5 | 1100 | $1,375 | $1.25 | 15d | 1 | 1.41mi |
| 1435 Atlanta Dr Daytona Beach, FL | 3.0 | 1.0 | 1200 | $1,800 | $1.50 | 25d | 1 | 1.48mi |
| 462 Magnolia St Ormond Beach, FL | 3.0 | 2.0 | 1502 | $2,100 | $1.40 | 15d | 1 | 1.50mi |
Listing history 21 events
-
2026-05-10status Pending
-
2026-05-03price $239,000
-
2026-05-02price $329,000
-
2026-04-21$249,000 Active
-
2026-04-20historical
-
2026-04-20historical
-
2026-04-11price $249,000
-
2026-04-11price $249,000
-
2026-03-14price $259,000
-
2026-03-14price $259,000
-
2026-02-05$267,000 Active
-
2026-02-05$267,000 Active
-
2007-11-01soldstatus $158,750
-
2007-10-25soldstatus $158,750
-
2007-07-20$167,000
-
2006-10-26historical
-
2005-09-25$206,900
-
2005-06-08$229,900
-
1985-09-01soldstatus $50,000
-
1978-08-01soldstatus $42,900
-
1975-01-01soldstatus $35,000
ⓘ Source: listings_history table (triggers on properties + properties_extension) + one-shot
backfill from property_details.listing_events for pre-trigger history.
Tax reassessment forecast FL · Resets to sale price
- Current annual tax
- $801 · $67/mo
- Projected year-2 tax
- $1,984 · $165/mo
- Expected delta
- +$1,182/yr (+$99/mo · 147.5%)
ⓘ Screening estimate from a state-policy table — verify with the county assessor before closing.
Climate risk First Street
- Flood 6/10 Major FEMA zone X (unshaded) · 57% chance over 30 yrs
- Wildfire 2/10 Low
- Heat 10/10 Extreme 7 d/yr ≥105°F today · 20 d/yr by 30 yrs out
- Wind 10/10 Extreme 99% chance of damaging wind over 30 yrs
- Air quality 3/10 Moderate 3 unhealthy d/yr today · 3 by 30 yrs out
Nearby sold comps map
Loading sold comps map…
Walkable amenities ~0.75 mi
Loading nearby amenities…
Taxation est. · year 1
- Rental income
- $27,498
- − Mortgage interest
- −$13,388
- − Property taxes
- −$801
- − Insurance
- −$1,195
- − Repairs & maintenance
- −$2,200
- − Management
- −$2,200
- − Depreciation
- −$6,953
- Taxable income
- $761
- Est. tax owed @ 24.0%
- −$183
- After-tax cash flow
- $4,504/yr
For passive investors: Depreciation is non-cash, so a rental often shows a tax loss while cash-flowing — sheltering income. Rental losses are passive: they offset passive income freely, and up to $25,000/yr can offset ordinary (W-2) income if you actively participate and your MAGI is under $100k (phasing out to $0 by $150k); unused losses carry forward. On sale, claimed depreciation is recaptured at up to 25%, and gains may owe capital-gains tax (a 1031 exchange can defer both). Figures are a year-1 estimate at your 24.0% rate — not tax advice; consult a CPA.
Schools (NCES district)
- District
- Volusia
- NCES district ID
- 1201920
- Math proficiency
- 44% ▼ -9.00%
- Reading proficiency
- 49% ▼ -3.00%
- Median HH income
- $42,946
- Composite
- 39.2/100
- National rank
- #4019
- State rank
- #47 of 73 in FL
Livability — Ormond Beach
- Score
- 83/100
- State rank
- #55
- US rank
- #965
Category grades
Schools grade is shown separately in the Schools card above.
Census & demographics
- Census place
- Ormond Beach, FL
- County
- Volusia County · 556,871 people
- City population
- 69,624
- Metro
- Deltona-Daytona Beach-Ormond Beach, FL
- Population (ZIP)
- 54,783
- Household income
- $71,011
- Rent vs Own
- Severe rent burden
- 1158.0
Population outlook (Volusia County) Hauer SSP2
- Today (2025)
- 572,749 people
- By 2030
- 598,695 · +4.5%
- By 2040
- 644,880 · +12.6%
- By 2050
- 681,451 · +19.0%
- By 2075
- 759,957 · +32.7%
- By 2100
- 778,902 · +36.0%
Race, ethnicity, and origin ACS 2023
- Neighborhood character
- Predominantly White (82%)
- Race & ethnicity
- White 82% Black 6% Hispanic / Latino 5% Two or more races 5% Asian 3%
- Hispanic origin (detail)
- Puerto Rican 2%
- Common ancestry
- Romanian 4% Lithuanian 3% Slovak 3%
- Foreign-born
- 7% · Canada, China
- Languages at home
- 91% English-only · Spanish 3% Other Indo-European 1% German/W. Germanic 1%
Political lean MEDSL · Volusia
- 2024 margin
- Strong R (+21.8) · D 38.7% · R 60.5%
- 2008→2024 swing
- -27.4pp toward R · 2008: 5.7pp · 2024: -21.8pp
- All cycles
- 2024: R+21.8 2020: R+14.1 2016: R+13.1 2012: R+1.2 2008: D+5.7
Not yet ingested
- Civics
- —
Market trends
- HPI YoY
- ▼ -327.97%
- Current HPI
- 271.92
- Rent YoY
- ▲ 1.64%
- Metro
- Deltona-Daytona Beach-Ormond Beach, FL
- State GDP YoY
- ▲ 3.28%
- F500 in state
- 36
Industry mix (Fortune 500 HQ in FL)
| Industry | F500 HQs | Revenue |
|---|---|---|
| Industrial Technology | 2 | $29B |
|
||
| Insurance | 2 | $17B |
|
||
| Retail | 1 | $60B |
|
||
| Technology Distribution | 1 | $58B |
|
||
| Homebuilding | 1 | $35B |
|
||
| Technology Manufacturing | 1 | $35B |
|
||
Price history
+582.9% since first listed21 events — show timeline
- 2026-05-10 Pending — Daytona MLS
- 2026-05-03 Price Changed $239,000 Daytona MLS
- 2026-05-02 Price Changed $329,000 Daytona MLS
- 2026-04-21 Listed $249,000 Daytona MLS
- 2026-04-20 Listing Removed — Daytona MLS
- 2026-04-20 Listing Removed — Stellar MLS as Distributed by MLS Grid
- 2026-04-11 Price Changed $249,000 Daytona MLS
- 2026-04-11 Price Changed $249,000 Stellar MLS as Distributed by MLS Grid
- 2026-03-14 Price Changed $259,000 Daytona MLS
- 2026-03-14 Price Changed $259,000 Stellar MLS as Distributed by MLS Grid
- 2026-02-05 Listed $267,000 Daytona MLS
- 2026-02-05 Listed $267,000 Stellar MLS as Distributed by MLS Grid
- 2007-11-01 Sold (Public Records) $158,750 Public Records
- 2007-10-25 Sold (MLS) $158,750 Daytona MLS
- 2007-07-20 Listed $167,000 Daytona MLS
- 2006-10-26 Listing Removed — Daytona MLS
- 2005-09-25 Listed $206,900 Daytona MLS
- 2005-06-08 Listed $229,900 Daytona MLS
- 1985-09-01 Sold (Public Records) $50,000 Public Records
- 1978-08-01 Sold (Public Records) $42,900 Public Records
- 1975-01-01 Sold (Public Records) $35,000 Public Records
Property tax history
+1.5%/yrLatest (2025): $801 · +5.3% YoY. Source: county tax records.
Cash-flow waterfall
monthlySold comps — $/sqft
last 12 mo · ≤1 miLoading sold comps…