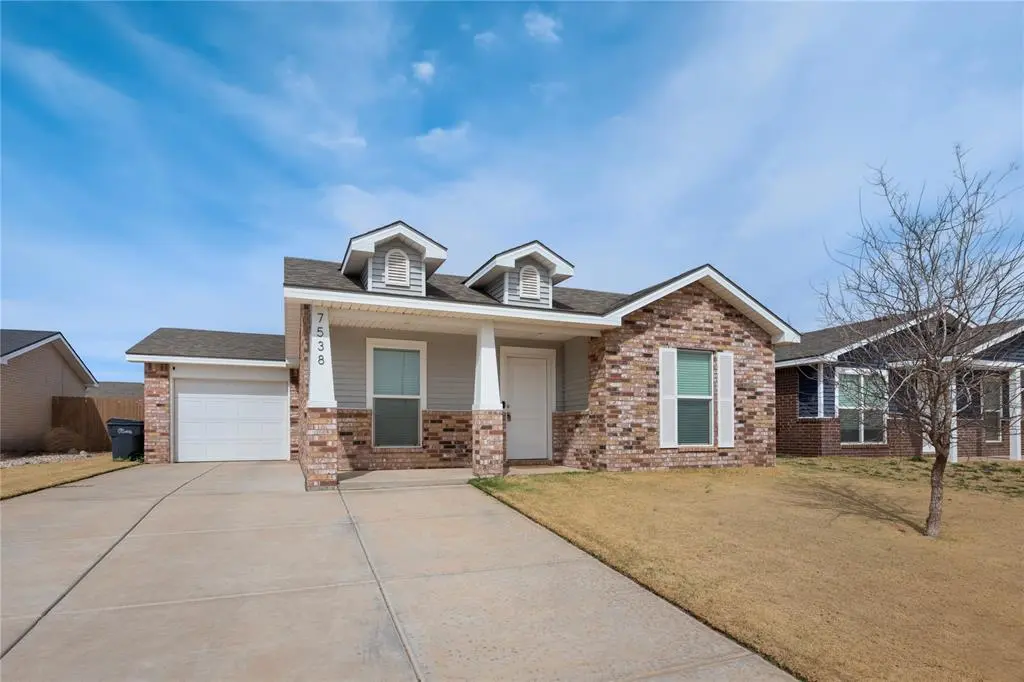
7538 33rd St · Lubbock, TX
Flood risk 1/10 · Minimal
- FEMA flood zone
- X (unshaded)
- Chance of flooding over 30 yrs
- 0.0%
- Est. flood insurance / yr
- $507 – $1,088
Fire risk 5/10 · Moderate
- Est. fire insurance / yr
- $1,222 – $2,270
Heat risk 5/10 · Moderate
- Hot days now (above 99°F)
- 7 days/yr
- Hot days in 30 yrs
- 22 days/yr
Wind risk 2/10 · Minimal
- Chance of severe wind over 30 yrs
- 1.0%
Air-quality risk 2/10 · Minimal
- Unhealthy air days now
- 1 days/yr
- Unhealthy air days in 30 yrs
- 1 days/yr
Risk factors via First Street. Map © Google.
Why this score? — see what drove the D grade
The composite is a weighted blend of 9 inputs, each scored 0–100. Each bar is that input's sub-score; the figure is the points it added to the 100-point composite (weight × sub-score).
- Cash flow +11.2/30.0
- ARV discount +7.5/15.0
- Schools +4.4/10.0
- Livability +4.0/5.0
- Condition / age +4.0/5.0
- 1% rule +3.9/10.0
- DSCR +3.3/10.0
- Rent growth +2.5/5.0
- Appreciation +0.0/10.0
$185,000
🖨 Deal sheet (PDF) 📄 Offer letter ✓ Due diligence
Listing remarks
Built in 2022, this beautifully maintained home at 7538 33rd Street in Lubbock offers the perfect blend of modern style and low-maintenance living. With 3 bedrooms, 2 full bathrooms, and 1,248 square feet, the thoughtfully designed open-concept layout creates a bright and inviting space ideal for both everyday living and entertaining. The kitchen flows seamlessly into the living and dining areas, making it easy to gather with family and friends. The private primary suite provides a comfortable retreat with its own full bath, while two additional bedrooms offer flexibility for guests, a home office, or growing families. This home also has a new water softening system that filters the water t
Key facts
- Modern finishes
- Energy efficiency
- Yard for relaxing
Tags
Neighborhood map
What this means for you Summary
Snapshot
- This is a 3-bed/2.0-bath single-family listed at $185k. Condition is rated good.
Deal economics
- At list price, monthly cash flow is $-72 ($-869/yr) — negative.
- To cash-flow at today's rent, offer at most $172k (6.9% below list).
- To meet the 1% rule (rent ≥ 1% of price), the offer needs to be $164k (11.3% below list).
- Recommended offer: $164k (11.3% below list) — sets the bar for 1% rule.
Location & tenants
- Location reads 80/100 on livability (#37 in TX, #1,749 nationally) — a professional / high-income tenant draw. Strengths: commute A+, cost of living A+, housing A+; Watch: employment C-, crime F.
- Frenship ISD (urban): math 47% / reading 54% proficiency, ranked #162 of 826 in TX (top 20%) — acceptable for families but not a draw, mixed tenant base, ~2y average lease.
- Zoned schools: Willow Bend El (math 34% / reading 41%, grade F, #1,744 of 4,322 statewide, top 41%, 730 students, 74% FRL) — zoned schools average 74% FRL vs 36% district-wide (38 pts higher); higher-poverty schools than district average — tighter screening recommended.
- Zoned-school proficiency averages 38% at this address vs 50% district-wide (-13 pts) — the specific schools serving this property underperform the Frenship ISD average; the district grade overstates school quality for this exact location.
- Market conditions: Rents soft (-0.1%/yr); 610 active listings in the ZIP; 21 comparable units currently listed for rent nearby; rentals at typical pace (median 22d on market — plan ~3-4 weeks tenant-placement turnaround); 48% of comp listings sitting > 30 days — soft ceiling on asking rent; 2,219 units permitted in Lubbock County in 2024 (252 in 5+ unit buildings).
- This rent runs 32% of the median local income ($62k/yr) — at the standard rent-burdened threshold; future hikes will face affordability resistance.
Forward outlook
- Local home prices are declining (-3.0%/yr); year-one equity from $1k of loan paydown is wiped out by about $6k of value loss. Plan a longer hold.
- Lubbock County population projected at +39% by 2050 — long-run rental-demand tailwind backs the buy-and-hold thesis.
Negotiation context
- It's been on market 17 days — a 2% lower offer ($182k) is reasonable based on typical stale-listing flexibility.
Risks & watch-outs
- Climate carrying-cost: moderate wildfire risk; extreme-heat days projected 7→22/yr by 2055 (HVAC capex compounding) — expect insurance premiums to compound above CPI over the hold.
Questions for the listing agent
- What do current leases actually rent for vs. the listed asking? Can we see a recent rent roll and the last 12 months of T-12 income?
- Is there a deadline driving the sale (1031 exchange, divorce, estate, relocation)? That informs how much negotiation room exists.
- Schools are D-rated, which usually means shorter tenancies and higher turnover. Who's the typical renter profile here, and what's been the actual vacancy rate?
- Crime grade is F in this area — have there been break-ins, vandalism, or insurance claims at this property in the last 3 years? What carrier currently insures it and at what premium?
- The area grade is low — what's the realistic commute time and amenity access for the typical tenant pool here? Any planned neighborhood developments (good or bad) we should know about?
- What's the average days-on-market for RENTAL listings here right now (not sales)? A rising rental-DOM trend means longer vacancies and softer asking-rent achievability than the comps imply.
- What's the recent tenant-quality profile in this submarket — average credit score on applications, eviction rate, late-payment / NSF rate, and stable-employment percentage? A property-management company in the area should have these aggregated.
- How much new for-sale + rental construction is in the pipeline within 1–3 miles? Heavy new supply typically softens prices + rents 12–24 months out; constrained supply supports both.
Investment metrics
- 1% rule
- 0.89% ✗
- Cap rate
- 5.82%
- Cash-on-cash
- -1.68%
- DSCR
- 0.93
- GRM
- 9.4
CMA / ARV
No comps found within radius.
Projected returns pro-forma
-3.0% appreciation · 0.0% rent growth · sell at horizon
- IRR
- -22.7%
- Equity multiple
- 0.24×
- Total profit
- $-39,318
- Equity at exit
- $27,584
- IRR
- -28.4%
- Equity multiple
- -0.13×
- Total profit
- $-58,435
- Equity at exit
- $15,995
Cash invested: $51,800 (down + closing). Projections, not guarantees.
Landlord ↔ Tenant lean methodology
- Overall (STATE)
- 87 Strongly Landlord-Friendly
- State Texas
- 87 Strongly Landlord-Friendly · R+5
- County
- — inherits STATE
- City
- — inherits STATE
ZIP-level market 79407
- Home prices YoY
- -16.3%
- Rents YoY
- -0.1%
- Active inventory
- 610
- Price-to-rent
- 9.4×
Monthly cashflow live
- Estimated rent
- $1,641 high interval (Pro) →
- Mortgage (P&I)
- −$970
- Tax from tax record
- −$322 /mo · $3,860/yr
- Insurance
- −$77
- HOA
- −$0
- Vacancy / Maint / Mgmt
- −$345
- Net cashflow
- $-72
Break-even live
Sensitivity live
| Price | -10% $32 | -5% $-20 | +0% $-72 | +5% $-125 | +10% $-177 |
|---|---|---|---|---|---|
| Rent | -10% $-202 | -5% $-137 | +0% $-72 | +5% $-8 | +10% $57 |
| Rate | -1.0pp $21 | -0.5pp $-25 | base $-72 | +0.5pp $-120 | +1.0pp $-169 |
UW: 25.0% down · 7.5% · 30yr · 1.5% tax · 5.0% vac · 8.0% maint · 8.0% mgmt
Financing live
Cash to close
- Down payment
- $46,250
- Closing costs
- $5,550
- Reserves months
- —
- Total cash needed
- —
Loan-product check · same deal, 3 products live
Conventional
25% down · 7.5% · 30yr
- Down + closing
- —
- Monthly P&I
- —
- Monthly cashflow
- —
- DSCR
- —
- Eligible?
- —
Personal DTI + credit; lowest rate.
DSCR
20% down · 8.5% · 30yr
- Down + closing
- —
- Monthly P&I
- —
- Monthly cashflow
- —
- DSCR
- —
- Eligible?
- —
No personal income docs; deal must DSCR.
Hard money
10% down · 12.0% · 12mo
- Down + closing
- —
- Monthly P&I
- —
- Monthly cashflow
- —
- DSCR
- —
- Eligible?
- —
Short-term bridge; refi at stabilization.
Rent comps 21 comps
| Address | Beds | Baths | Sqft | Rent | $/sqft | DOM | Units | Dist |
|---|---|---|---|---|---|---|---|---|
| 7541 33rd St Lubbock, TX | 3.0 | 2.0 | 1296 | $1,500 | $1.16 | 22d | 1 | 0.02mi |
| 7535 32nd St Lubbock, TX | 3.0 | 2.0 | 1120 | $1,395 | $1.25 | 44d | 1 | 0.07mi |
| 7420 35th St Lubbock, TX | 3.0 | 2.0 | 1247 | $1,500 | $1.20 | 44d | 1 | 0.36mi |
| 7413 35th St Lubbock, TX | 3.0 | 2.0 | 1247 | $1,475 | $1.18 | 22d | 1 | 0.41mi |
| 2911 Urbana Pl Lubbock, TX | 3.0 | 2.0 | 1452 | $1,800 | $1.24 | 22d | 1 | 0.58mi |
| 7324 26th St Lubbock, TX | 2.0 | 1.0 | 936 | $850 | $0.91 | 44d | 1 | 0.71mi |
| 7222 35th St Lubbock, TX | 3.0 | 2.0 | 1450 | $1,935 | $1.33 | 44d | 1 | 0.73mi |
| 3518 Turner Ave Lubbock, TX | 3.0 | 2.0 | 1450 | $2,199 | $1.52 | 44d | 1 | 0.74mi |
| 3414 Tiffin Ave Lubbock, TX | 3.0 | 2.0 | 1550 | $1,799 | $1.16 | 14d | 1 | 0.82mi |
| 2801 Trenton Ave Unit LO Lubbock, TX | 3.0 | 2.0 | 1722 | $1,799 | $1.04 | 22d | 1 | 0.89mi |
| 7024 40th St Unit A Lubbock, TX | 3.0 | 2.0 | 1500 | $1,600 | $1.07 | 44d | 1 | 0.92mi |
| 2612 Tiffin Ave Lubbock, TX | 3.0 | 2.0 | 1600 | $1,775 | $1.11 | 14d | 1 | 0.93mi |
| 2625 Tiffin Ave Lubbock, TX | 3.0 | 2.0 | 1552 | $1,800 | $1.16 | 44d | 1 | 0.93mi |
| 7022 40th St Unit A Lubbock, TX | 3.0 | 2.0 | 1500 | $1,600 | $1.07 | 44d | 1 | 0.94mi |
| 7216 24th St Lubbock, TX | 3.0 | 2.0 | 1732 | $1,700 | $0.98 | 44d | 1 | 0.94mi |
| 7036 41st St Lubbock, TX | 3.0 | 2.0 | 1608 | $1,895 | $1.18 | 22d | 1 | 0.97mi |
| 2617 Garland Ave Lubbock, TX | 4.0 | 2.0 | 1703 | $2,000 | $1.17 | 22d | 1 | 1.13mi |
| 8607 29th St Lubbock, TX | 3.0 | 2.0 | 1350 | $1,749 | $1.30 | 44d | 1 | 1.22mi |
| 2603 Harmony Ave Lubbock, TX | 3.0 | 2.0 | 1450 | $1,749 | $1.21 | 22d | 1 | 1.24mi |
| 2603 Harmony Ave Lubbock, TX | 3.0 | 2.0 | 1450 | $1,749 | $1.21 | 14d | 1 | 1.24mi |
| 6927 20th St Lubbock, TX | 3.0 | 2.0 | 1611 | $1,599 | $0.99 | 22d | 1 | 1.34mi |
Listing history 4 events
-
2026-04-27soldstatus
-
2026-04-03status Pending
-
2026-03-25historical Active Option Contract
-
2026-03-16$185,000 Active
ⓘ Source: listings_history table (triggers on properties + properties_extension) + one-shot
backfill from property_details.listing_events for pre-trigger history.
Tax reassessment forecast TX · Resets to sale price
- Current annual tax
- $3,860 · $322/mo
- Projected year-2 tax
- $3,860 · $322/mo
- Expected delta
- $0/yr ($0/mo · 0.0%)
ⓘ Screening estimate from a state-policy table — verify with the county assessor before closing.
Climate risk First Street
- Flood 1/10 Low FEMA zone X (unshaded) · 0% chance over 30 yrs
- Wildfire 5/10 Major
- Heat 5/10 Major 7 d/yr ≥99°F today · 22 d/yr by 30 yrs out
- Wind 2/10 Low 100% chance of damaging wind over 30 yrs
- Air quality 2/10 Low 1 unhealthy d/yr today · 1 by 30 yrs out
Nearby sold comps map
Loading sold comps map…
Walkable amenities ~0.75 mi
Loading nearby amenities…
Taxation est. · year 1
- Rental income
- $19,694
- − Mortgage interest
- −$10,363
- − Property taxes
- −$3,860
- − Insurance
- −$925
- − Repairs & maintenance
- −$1,576
- − Management
- −$1,576
- − Depreciation
- −$5,382
- Taxable loss
- −$3,987
- Est. tax savings @ 24.0%
- +$957
- After-tax cash flow
- $88/yr
For passive investors: Depreciation is non-cash, so a rental often shows a tax loss while cash-flowing — sheltering income. Rental losses are passive: they offset passive income freely, and up to $25,000/yr can offset ordinary (W-2) income if you actively participate and your MAGI is under $100k (phasing out to $0 by $150k); unused losses carry forward. On sale, claimed depreciation is recaptured at up to 25%, and gains may owe capital-gains tax (a 1031 exchange can defer both). Figures are a year-1 estimate at your 24.0% rate — not tax advice; consult a CPA.
Condition & rehab AI · 12 photos
This 2022-built home offers a modern and well-maintained interior with a good condition exterior. It is ready for immediate occupancy and minor cosmetic updates could further enhance its value.
Value-add opportunities
- Resale Paint exterior trim — Enhances curb appeal and can increase property value.
- Rental Clean gutters — Keeps property in good condition and reduces maintenance costs for tenants.
Renovation cost estimate screening
Value-add ROI direction
- Resale Paint exterior trim — Enhances curb appeal and can increase property value. ↑
- Rental Clean gutters — Keeps property in good condition and reduces maintenance costs for tenants. ↑
ⓘ Cost ranges are severity-bucket heuristics (US national rule-of-thumb). Get contractor quotes + a written scope before underwriting a rehab budget.
Schools (NCES district)
- District
- Frenship ISD
- NCES district ID
- 4819830
- Math proficiency
- 47% ▼ -8.00%
- Reading proficiency
- 54% ▬ 0.00%
- Median HH income
- $54,376
- Composite
- 43.59/100
- National rank
- #2976
- State rank
- #162 of 826 in TX
Livability — Lubbock
- Score
- 80/100
- State rank
- #37
- US rank
- #1749
Category grades
Schools grade is shown separately in the Schools card above.
Census & demographics
- Census place
- Lubbock, TX
- County
- Lubbock County · 293,542 people
- City population
- 283,030
- Metro
- Lubbock, TX
- Population (ZIP)
- 24,000
- Household income
- $61,509
- Rent vs Own
- Severe rent burden
- 1914.0
Population outlook (Lubbock County) Hauer SSP2
- Today (2025)
- 345,960 people
- By 2030
- 371,449 · +7.4%
- By 2040
- 424,539 · +22.7%
- By 2050
- 481,150 · +39.1%
- By 2075
- 633,467 · +83.1%
- By 2100
- 746,853 · +115.9%
Race, ethnicity, and origin ACS 2023
- Neighborhood character
- Diverse neighborhood (Simpson 0.56)
- Race & ethnicity
- White 58% Hispanic / Latino 31% Two or more races 17% Black 4% Asian 3%
- Hispanic origin (detail)
- Mexican 27%
- Common ancestry
- Italian 2% Lithuanian 1% Slovak 1%
- Foreign-born
- 5% · Canada, South Korea, China
- Languages at home
- 83% English-only · Spanish 13% Other Asian/Pacific 1% Chinese 1%
Political lean MEDSL · Lubbock
- 2024 margin
- Solid R (+39.5) · D 29.7% · R 69.2% · Other 1.0%
- 2008→2024 swing
- -2.8pp toward R · 2008: -36.7pp · 2024: -39.5pp
- All cycles
- 2024: R+39.5 2020: R+32.2 2016: R+38.4 2012: R+40.9 2008: R+36.7
Not yet ingested
- Civics
- —
Market trends
- HPI YoY
- ▼ -44.87%
- Current HPI
- 229.9895
- Rent YoY
- ▼ -0.07%
- Metro
- Lubbock, TX
- State GDP YoY
- ▲ 3.95%
- F500 in state
- 110
Industry mix (Fortune 500 HQ in TX)
| Industry | F500 HQs | Revenue |
|---|---|---|
| Energy | 16 | $1,198B |
|
||
| Technology | 5 | $198B |
|
||
| Engineering / Construction | 4 | $72B |
|
||
| Energy Services | 3 | $60B |
|
||
| Utilities | 3 | $41B |
|
||
| Healthcare | 2 | $330B |
|
||
Price history
4 events — show timeline
- 2026-04-27 Sold (Public Records) — Public Records
- 2026-04-03 Pending — NTREIS
- 2026-03-25 Contingent — NTREIS
- 2026-03-16 Listed $185,000 NTREIS
Property tax history
+87.8%/yrLatest (2025): $3,860 · +4.1% YoY. Source: county tax records.
Cash-flow waterfall
monthlySold comps — $/sqft
last 12 mo · ≤1 miLoading sold comps…