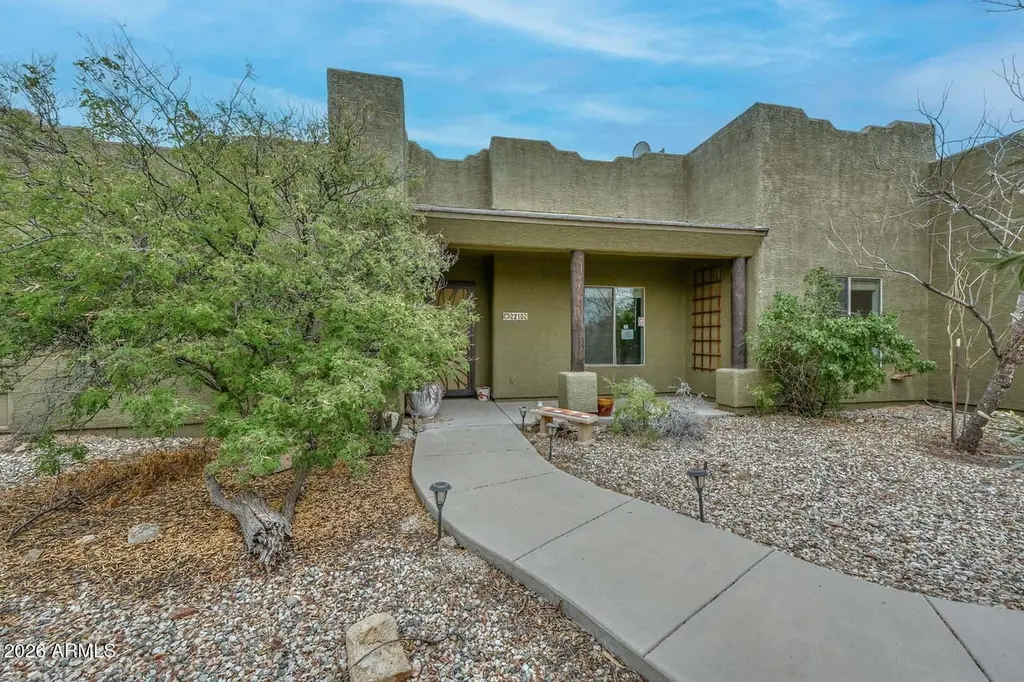
210 W Yucca Ln · New River, AZ
Flood risk 1/10 · Minimal
- FEMA flood zone
- X (shaded)
- Chance of flooding over 30 yrs
- 0.0%
- Est. flood insurance / yr
- $507 – $1,088
Fire risk 5/10 · Moderate
- Est. fire insurance / yr
- $610 – $1,132
Heat risk 8/10 · Major
- Hot days now (above 109°F)
- 7 days/yr
- Hot days in 30 yrs
- 18 days/yr
Wind risk 1/10 · Minimal
- Chance of severe wind over 30 yrs
- —
Air-quality risk 3/10 · Minor
- Unhealthy air days now
- 2 days/yr
- Unhealthy air days in 30 yrs
- 3 days/yr
Risk factors via First Street. Map © Google.
Why this score? — see what drove the B grade
The composite is a weighted blend of 9 inputs, each scored 0–100. Each bar is that input's sub-score; the figure is the points it added to the 100-point composite (weight × sub-score).
- Cash flow +27.0/30.0
- ARV discount +15.0/15.0
- DSCR +9.4/10.0
- 1% rule +6.4/10.0
- Schools +4.7/10.0
- Livability +2.7/5.0
- Rent growth +2.5/5.0
- Condition / age +2.5/5.0
- Appreciation +0.0/10.0
$659,000
🖨 Deal sheet 📄 Offer letter ✓ Due diligence
Listing remarks MLS
Beautiful home with amazing views. Home has all tile floors throughout 3 bedrooms 2 bathroom. 3 car garage great room family room with a fireplace for comfort. Open floor plan split floor master is spacious with jetted tub and separate shower double sinks. Chef's Kitchen has double ovens GE profile appliances with hickory cabinetry. Walk-out to your very own paradise with views to take your breath away. BBQ fireplace sitting areas for enjoyment of the Arizona sunsets. This home is perfect for an outdoor wedding! Home sits on over an acre North/south exposure ''perfect. '' Home is on a shared well with a 5 thousand gallon underground holding tank. All equipment has just been updated with new tanks & new motor. Own a piece of Paradise!
Key facts
- Room for recreation
- Spacious kitchen
- Full acre
Tags
Property features AI
Finance
- HOA & community: No association fees
Exterior
- Parking: 3 covered parking spaces; 3 open parking spaces; 3 garage spaces
- Utilities: Shared well water; Septic (in & connected)
- Home design: Single-family residence; Fee simple ownership
- Construction: Stucco and painted wood frame construction; Foam roof
- Exterior features: Private street(s); Built-in barbecue; Block fencing; Dirt front and dirt back lot surfaces; Mountain views; Horses allowed
Interior
- Kitchen: Built-in microwave; Kitchen island; Multiple ovens; Refrigerator; Dishwasher; Disposal
- Bedrooms: 3 bedrooms (possible)
- Flooring: Tile
- Bathrooms: 3 full bathrooms
- Heating & cooling: Electric heating; Central air; Ceiling fans
- Interior features: High-speed internet; Double vanity in bathroom; Eat-in kitchen; Breakfast bar; 9+ foot flat ceilings; Kitchen island; Primary bedroom with full bath; Separate shower and tub; Tub with jets; Dual-pane windows; Family room fireplace
- Laundry & utility: Laundry room inside
Neighborhood map
What this means for you Summary
Snapshot
- This is a 3-bed/3.0-bath single-family listed at $659k.
Deal economics
- At list price, monthly cash flow is $2k ($22k/yr) — positive.
- The deal already cash-flows at list — no discount required.
- Meets the 1% rule at list price ($8k rent vs $659k).
- Recommended offer: $649k (1.5% below list) — sets the bar for market timing.
- Cap rate 9.7% vs local median 1.9% in New River — top-decile yield for the area; either an underpriced asset or a hidden risk that comps aren't pricing in. Stress-test before assuming the spread holds.
Location & tenants
- Location reads 54/100 on livability (#278 in AZ) — a working-class tenant base; expect higher turnover. Strengths: employment A+, housing A+, crime A; Watch: amenities F, commute F, cost of living F.
- Deer Valley Unified District (4246) (urban): math 50% / reading 55% proficiency, ranked #33 of 249 in AZ (top 13%) — acceptable for families but not a draw, mixed tenant base, ~2y average lease.
- Zoned schools: New River Elementary School (math 42% / reading 47%, grade F, #339 of 1,109 statewide, top 32%, 201 students, 35% FRL); Desert Sky Middle School (math 34% / reading 37%, grade F, #62 of 218 statewide, top 29%, 648 students, 47% FRL); Boulder Creek High School (math 45% / reading 48%, grade D-, #55 of 381 statewide, top 14%, 2,375 students, 13% FRL).
- Market conditions: 148 active listings in the ZIP; 1 comparable units currently listed for rent nearby; 36,011 units permitted in Maricopa County in 2024 (12,801 in 5+ unit buildings).
Forward outlook
- Local home prices are declining (-3.0%/yr); year-one equity from $5k of loan paydown is wiped out by about $20k of value loss. Plan a longer hold.
- Maricopa County population projected at +38% by 2050 — long-run rental-demand tailwind backs the buy-and-hold thesis.
- At projected returns (-3.0% appreciation + 3.0% rent growth), your $185k cash investment doubles in ~10 years — after that, you're playing with house money.
Negotiation context
- It's been on market 19 days — a 2% lower offer ($649k) is reasonable based on typical stale-listing flexibility.
- 5 sale attempts since 4y ago with the ask held roughly flat each time — persistent listings suggest the price (not the market) is what's stuck; bring a comps-based counter.
Risks & watch-outs
- Climate carrying-cost: moderate wildfire risk; extreme-heat days projected 7→18/yr by 2055 (HVAC capex compounding) — expect insurance premiums to compound above CPI over the hold.
Questions for the listing agent
- Is there a deadline driving the sale (1031 exchange, divorce, estate, relocation)? That informs how much negotiation room exists.
- Schools are D-rated, which usually means shorter tenancies and higher turnover. Who's the typical renter profile here, and what's been the actual vacancy rate?
- What's the average days-on-market for RENTAL listings here right now (not sales)? A rising rental-DOM trend means longer vacancies and softer asking-rent achievability than the comps imply.
- What's the recent tenant-quality profile in this submarket — average credit score on applications, eviction rate, late-payment / NSF rate, and stable-employment percentage? A property-management company in the area should have these aggregated.
- How much new for-sale + rental construction is in the pipeline within 1–3 miles? Heavy new supply typically softens prices + rents 12–24 months out; constrained supply supports both.
Investment metrics
- 1% rule
- 1.14% ✓
- Cap rate
- 9.67%
- Cash-on-cash
- 12.06%
- DSCR
- 1.54
- GRM
- 7.3
CMA / ARV
- ARV (on-the-fly)
- $904,578
- Comps found
- 2
Show comp detail 2 sales within ~0.75 mi
| Address | Dist | Beds/Ba | Sqft | Sold | Price | $/sf | Match |
|---|---|---|---|---|---|---|---|
| 115 E Honda Bow Rd | 0.42mi | 3/2.5 | 2,506 (-11%) | 1mo | $800,000 | $319 | 59 |
| 610 W Filoree Ln | 0.27mi | 4/2.5 (+1) | 2,573 (-9%) | 20mo | $825,000 | $321 | 49 |
Match score weights: distance 35% · size 25% · config 20% · recency 20%. Top-matched comps best support the ARV.
Projected returns pro-forma
-3.0% appreciation · 3.0% rent growth · sell at horizon
- IRR
- 1.6%
- Equity multiple
- 1.06×
- Total profit
- $11,123
- Equity at exit
- $98,259
- IRR
- 11.2%
- Equity multiple
- 1.87×
- Total profit
- $161,003
- Equity at exit
- $56,978
Cash invested: $184,520 (down + closing). Projections, not guarantees.
Landlord ↔ Tenant lean methodology
- Overall (STATE)
- 87 Strongly Landlord-Friendly
- State Arizona
- 87 Strongly Landlord-Friendly · R+3
- County
- — inherits STATE
- City
- — inherits STATE
ZIP-level market 85087
- Home prices YoY
- -19.1%
- Active inventory
- 148
- Price-to-rent
- 7.3×
Monthly cashflow live
- Estimated rent
- $7,500 medium interval (Pro) →
- Mortgage (P&I)
- −$3,456
- Tax from tax record
- −$340 /mo · $4,084/yr
- Insurance
- −$275
- HOA
- −$0
- Vacancy / Maint / Mgmt
- −$1,575
- Net cashflow
- $1,854
Break-even live
UW: 25.0% down · 7.5% · 30yr · 1.5% tax · 5.0% vac · 8.0% maint · 8.0% mgmt
Financing live
Cash to close
- Down payment
- $164,750
- Closing costs
- $19,770
- Reserves months
- —
- Total cash needed
- —
Loan-product check · same deal, 3 products live
Conventional
25% down · 7.5% · 30yr
- Down + closing
- —
- Monthly P&I
- —
- Monthly cashflow
- —
- DSCR
- —
- Eligible?
- —
Personal DTI + credit; lowest rate.
DSCR
20% down · 8.5% · 30yr
- Down + closing
- —
- Monthly P&I
- —
- Monthly cashflow
- —
- DSCR
- —
- Eligible?
- —
No personal income docs; deal must DSCR.
Hard money
10% down · 12.0% · 12mo
- Down + closing
- —
- Monthly P&I
- —
- Monthly cashflow
- —
- DSCR
- —
- Eligible?
- —
Short-term bridge; refi at stabilization.
Rent comps 1 comps
| Address | Beds | Baths | Sqft | Rent | $/sqft | DOM | Units | Dist |
|---|---|---|---|---|---|---|---|---|
| 41609 N Signal Hill Ct Phoenix, AZ | 3.0 | 2.5 | 3144 | $7,500 | $2.39 | 43d | 1 | 1.36mi |
Listing history 15 events
-
2026-06-18days on market $659,000 Active 19 DOM
-
2026-06-17days on market $659,000 Active 18 DOM
-
2026-06-16days on market $659,000 Active 17 DOM
-
2026-06-15days on market $659,000 Active 16 DOM
-
2026-06-13days on market $659,000 Active 14 DOM
-
2026-06-13days on market $659,000 Active 13 DOM
-
2026-06-09days on market $659,000 Active 10 DOM
-
2026-06-08days on market $659,000 Active 9 DOM
-
2026-06-07days on market $659,000 Active 8 DOM
-
2026-06-04days on market $659,000 Active 5 DOM
-
2026-06-03days on market $659,000 Active 4 DOM
-
2026-06-02days on market $659,000 Active 3 DOM
-
2026-06-01days on market $659,000 Active 2 DOM
-
2026-05-31remarks 699-char remark
-
2026-05-31$659,000 Active 1 DOM
ⓘ Source: listings_history table (triggers on properties + properties_extension) + one-shot
backfill from property_details.listing_events for pre-trigger history.
Tax reassessment forecast AZ · Resets to sale price
- Current annual tax
- $4,084 · $340/mo
- Projected year-2 tax
- $4,349 · $362/mo
- Expected delta
- +$265/yr (+$22/mo · 6.5%)
ⓘ Screening estimate from a state-policy table — verify with the county assessor before closing.
Climate risk First Street
- Flood 1/10 Low FEMA zone X (shaded) · 0% chance over 30 yrs
- Wildfire 5/10 Major
- Heat 8/10 Severe 7 d/yr ≥109°F today · 18 d/yr by 30 yrs out
- Wind 1/10 Low
- Air quality 3/10 Moderate 2 unhealthy d/yr today · 3 by 30 yrs out
Nearby sold comps map
Loading sold comps map…
Walkable amenities ~0.75 mi
Loading nearby amenities…
Taxation est. · year 1
- Rental income
- $90,000
- − Mortgage interest
- −$36,914
- − Property taxes
- −$4,084
- − Insurance
- −$3,295
- − Repairs & maintenance
- −$7,200
- − Management
- −$7,200
- − Depreciation
- −$19,171
- Taxable income
- $12,135
- Est. tax owed @ 24.0%
- −$2,912
- After-tax cash flow
- $19,338/yr
For passive investors: Depreciation is non-cash, so a rental often shows a tax loss while cash-flowing — sheltering income. Rental losses are passive: they offset passive income freely, and up to $25,000/yr can offset ordinary (W-2) income if you actively participate and your MAGI is under $100k (phasing out to $0 by $150k); unused losses carry forward. On sale, claimed depreciation is recaptured at up to 25%, and gains may owe capital-gains tax (a 1031 exchange can defer both). Figures are a year-1 estimate at your 24.0% rate — not tax advice; consult a CPA.
Schools (NCES district)
- District
- Deer Valley Unified District (4246)
- NCES district ID
- 0407750
- Math proficiency
- 50% ▼ -9.00%
- Reading proficiency
- 55% ▼ -6.00%
- Median HH income
- $72,516
- Composite
- 47.0/100
- National rank
- #2346
- State rank
- #33 of 249 in AZ
Livability — New River
- Score
- 54/100
- State rank
- #278
- US rank
- #24012
Category grades
Schools grade is shown separately in the Schools card above.
Census & demographics
- Census place
- New River, AZ
- City population
- 43,369
- Population (ZIP)
- 9,835
Population outlook (Maricopa County) Hauer SSP2
- Today (2025)
- 4,979,203 people
- By 2030
- 5,378,229 · +8.0%
- By 2040
- 6,156,598 · +23.6%
- By 2050
- 6,872,376 · +38.0%
- By 2075
- 8,401,270 · +68.7%
- By 2100
- 9,247,439 · +85.7%
Race, ethnicity, and origin ACS 2023
- Neighborhood character
- Predominantly White (83%)
- Race & ethnicity
- White 83% Two or more races 11% Hispanic / Latino 6% Asian 2% Black 2%
- Hispanic origin (detail)
- Mexican 4%
- Common ancestry
- Italian 4% Lithuanian 4% Iranian 3%
- Foreign-born
- 5% · Canada, Jamaica, China
- Languages at home
- 96% English-only · Spanish 1% German/W. Germanic 1% Tagalog/Filipino 1%
Political lean MEDSL · Maricopa
- 2024 margin
- Toss-up / Even · D 47.7% · R 51.2% · Other 1.1%
- 2008→2024 swing
- +7.1pp toward D · 2008: -10.6pp · 2024: -3.5pp
- All cycles
- 2024: R+3.5 2020: D+2.2 2016: R+3.5 2012: R+12.0 2008: R+10.6
Not yet ingested
- Civics
- —
Market trends
- HPI YoY
- ▼ -78.05%
- Current HPI
- 331.7169
- Rent YoY
- —
- Metro
- —
- State GDP YoY
- ▲ 4.54%
- F500 in state
- 20
Industry mix (Fortune 500 HQ in AZ)
| Industry | F500 HQs | Revenue |
|---|---|---|
| Technology | 2 | $13B |
|
||
| Mining / Metals | 1 | $23B |
|
||
| Environmental Services | 1 | $16B |
|
||
| Metals / Steel | 1 | $14B |
|
||
| Technology Distribution | 1 | $9B |
|
||
| Homebuilding | 1 | $8B |
|
||
Price history
+163.6% since first listed21 events — show timeline
- 2026-05-30 Listed $659,000 ARMLS
- 2025-07-30 Listing Removed — ARMLS
- 2025-02-03 Listed $850,000 ARMLS
- 2024-03-04 Sold (Public Records) $800,000 Public Records
- 2023-10-04 Sold (Public Records) $838,606 Public Records
- 2023-10-04 Sold (MLS) $838,606 ARMLS
- 2023-08-31 Pending — ARMLS
- 2023-08-31 Listed $855,000 ARMLS
- 2023-08-30 Sold (MLS) $838,606 ARMLS
- 2023-08-10 Pending — ARMLS
- 2023-07-31 Price Changed $855,000 ARMLS
- 2023-07-30 Contingent — ARMLS
- 2023-07-12 Price Changed $845,000 ARMLS
- 2023-06-01 Price Changed $849,900 ARMLS
- 2023-05-12 Listed $875,000 ARMLS
- 2022-04-20 Sold (Public Records) $800,000 Public Records
- 2022-04-20 Sold (MLS) $800,000 ARMLS
- 2022-03-14 Pending — ARMLS
- 2022-03-03 Listed $750,000 ARMLS
- 2004-11-01 Sold (Public Records) $339,810 Public Records
- 2004-02-05 Sold (Public Records) $250,000 Public Records
Property tax history
+3.1%/yrLatest (2025): $4,084 · +1.8% YoY. Source: county tax records.
Cash-flow waterfall
monthlySold comps — $/sqft
last 12 mo · ≤1 miLoading sold comps…