2117 Welch Dr · Hermann, MO
Flood risk 1/10 · Minimal
- FEMA flood zone
- X (unshaded)
- Chance of flooding over 30 yrs
- 0.0%
- Est. flood insurance / yr
- $507 – $1,088
Fire risk 3/10 · Minor
- Est. fire insurance / yr
- $1,054 – $1,958
Heat risk 4/10 · Minor
- Hot days now (above 107°F)
- 7 days/yr
- Hot days in 30 yrs
- 18 days/yr
Wind risk 2/10 · Minimal
- Chance of severe wind over 30 yrs
- —
Air-quality risk 2/10 · Minimal
- Unhealthy air days now
- 0 days/yr
- Unhealthy air days in 30 yrs
- 1 days/yr
Risk factors via First Street. Map © Google.
Why this score? — see what drove the B grade
The composite is a weighted blend of 9 inputs, each scored 0–100. Each bar is that input's sub-score; the figure is the points it added to the 100-point composite (weight × sub-score).
- Cash flow +30.0/30.0
- 1% rule +10.0/10.0
- DSCR +10.0/10.0
- ARV discount +7.3/15.0
- Schools +3.9/10.0
- Livability +3.7/5.0
- Appreciation +3.0/10.0
- Rent growth +2.5/5.0
- Condition / age +2.5/5.0
$49,900
🖨 Deal sheet 📄 Offer letter ✓ Due diligence
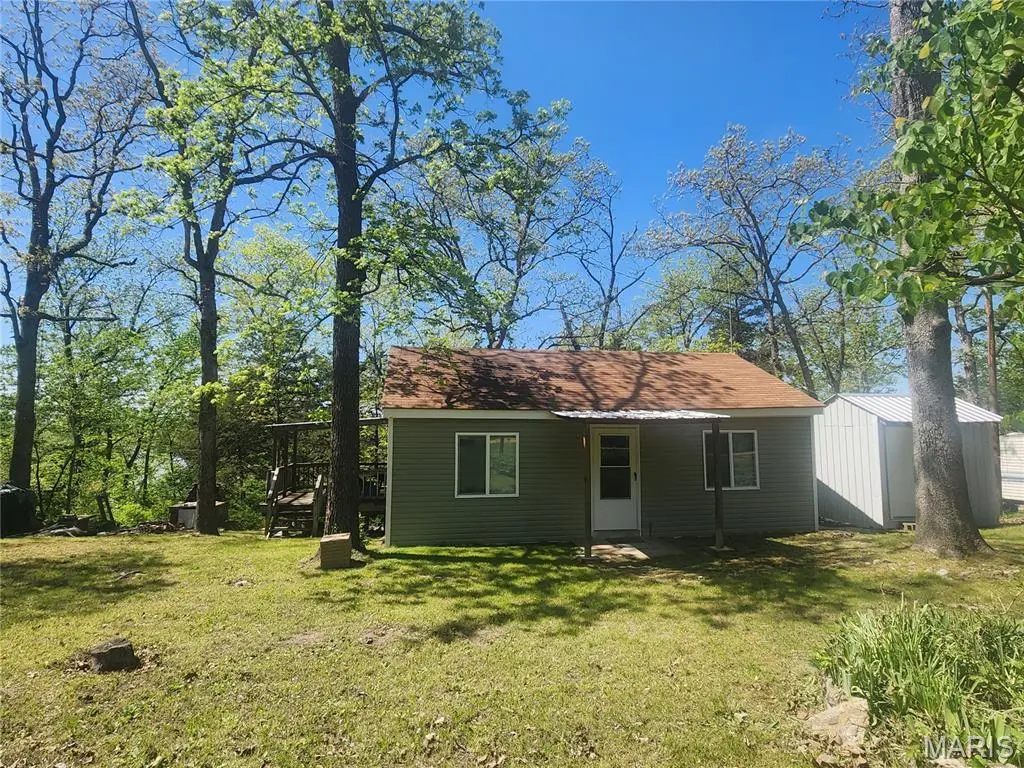
Listing remarks
Looking for a home away from home on the Gasconade River?!?! Look no further! This charming 2 bedroom, 1 bath resistance is ready for its new family! Inside, an open concept living and dining room, large kitchen, full bathroom, a wood burning stove, and 2 spacious bedrooms provide the perfect retreat. Step outside to your covered deck and enjoy a stunning view of the Gasconade River! The river lot also has a shed for all your tools, and fishing equipment, a well, and a nice well-kept level front yard. Seller is planning on leaving the furniture and kitchen appliances. Don't miss this opportunity- Call today!!!
Key facts
- 0.44 acre lot
- Built 1958
- Listed 6 days
Property features AI
Exterior
- Utilities: Well water; No sewer; Electric service (other)
- Home design: Residential cabin; One story
- Construction: Vinyl siding
- Exterior features: Waterfront location
Interior
- Bedrooms: 2 bedrooms on the main level
- Bathrooms: 1 full bathroom (main level)
- Heating & cooling: Wood-burning and space heaters; Wall/window air conditioning units
- Interior features: Adjoins wooded area
Neighborhood map
What this means for you Summary
Snapshot
- This is a 2-bed/1.0-bath single-family listed at $50k.
Deal economics
- At list price, monthly cash flow is $342 ($4k/yr) — positive.
- The deal already cash-flows at list — no discount required.
- Meets the 1% rule at list price ($821 rent vs $50k).
- Cap rate 14.5% vs local median 2.6% in Hermann — top-decile yield for the area; either an underpriced asset or a hidden risk that comps aren't pricing in. Stress-test before assuming the spread holds.
Location & tenants
- Location reads 74/100 on livability (#66 in MO, #4,524 nationally) — a middle-class / working-renter tenant base. Strengths: cost of living A+, housing A+, crime A-; Watch: employment C-, amenities F, commute F.
- Gasconade County R-I (rural): math 44% / reading 48% proficiency, ranked #86 of 324 in MO (top 26%) — families likely to look elsewhere, expect single-tenant / working-renter base with shorter leases.
- Zoned schools: Hermann Elem. (math 24% / reading 44%, grade F, #676 of 1,115 statewide, top 66%, 249 students, 51% FRL); Hermann High (math 42% / reading 62%, grade D+, #92 of 521 statewide, top 20%, 323 students, 38% FRL).
- Market conditions: 60 active listings in the ZIP; 5 units permitted in Gasconade County in 2024 (5 in 5+ unit buildings).
Forward outlook
- Local home prices are declining (-3.0%/yr); year-one equity from $345 of loan paydown is wiped out by about $1k of value loss. Plan a longer hold.
- Gasconade County population projected at -21% by 2050 — secular population decline; favor cash flow + early exit over multi-decade hold.
- At projected returns (-3.0% appreciation + 3.0% rent growth), your $14k cash investment doubles in ~5 years — after that, you're playing with house money.
Negotiation context
- Only 6 days on market — expect competitive offers; lowballing is unlikely to land.
Risks & watch-outs
- Watch-outs: built in 1958 — expect roof / HVAC / electrical / plumbing capex.
Questions for the listing agent
- Built in 1958 — when were the roof, HVAC, electrical panel, plumbing, and water heater last replaced?
- Is there a deadline driving the sale (1031 exchange, divorce, estate, relocation)? That informs how much negotiation room exists.
- What's the average days-on-market for RENTAL listings here right now (not sales)? A rising rental-DOM trend means longer vacancies and softer asking-rent achievability than the comps imply.
- What's the recent tenant-quality profile in this submarket — average credit score on applications, eviction rate, late-payment / NSF rate, and stable-employment percentage? A property-management company in the area should have these aggregated.
- How much new for-sale + rental construction is in the pipeline within 1–3 miles? Heavy new supply typically softens prices + rents 12–24 months out; constrained supply supports both.
Investment metrics
- 1% rule
- 1.65% ✓
- Cap rate
- 14.53%
- Cash-on-cash
- 29.41%
- DSCR
- 2.31
- GRM
- 5.1
CMA / ARV
- ARV (on-the-fly)
- $49,713
- Comps found
- 2
Show comp detail 2 sales within ~0.75 mi
| Address | Dist | Beds/Ba | Sqft | Sold | Price | $/sf | Match |
|---|---|---|---|---|---|---|---|
| 2117 Welch Dr | 0.00mi | 2/1.0 | 681 (0%) | 1mo | $49,900 | $73 | 99 |
| 2163 Welch Dr | 0.20mi | 1/1.0 (-1) | 704 (+3%) | 10mo | $30,000 | $43 | 71 |
Match score weights: distance 35% · size 25% · config 20% · recency 20%. Top-matched comps best support the ARV.
Projected returns pro-forma
-3.0% appreciation · 3.0% rent growth · sell at horizon
- IRR
- 23.8%
- Equity multiple
- 1.98×
- Total profit
- $13,711
- Equity at exit
- $7,440
- IRR
- 31.7%
- Equity multiple
- 3.86×
- Total profit
- $39,974
- Equity at exit
- $4,314
Cash invested: $13,972 (down + closing). Projections, not guarantees.
Landlord ↔ Tenant lean methodology
- Overall (STATE)
- 81 Strongly Landlord-Friendly
- State Missouri
- 81 Strongly Landlord-Friendly · R+10
- County
- — inherits STATE
- City
- — inherits STATE
ZIP-level market 65041
- Home prices YoY
- -1.3%
- Active inventory
- 60
- Price-to-rent
- 5.1×
Monthly cashflow live
- Estimated rent
- $821 medium interval (Pro) →
- Mortgage (P&I)
- −$262
- Tax from tax record
- −$24 /mo · $284/yr
- Insurance
- −$21
- HOA
- −$0
- Vacancy / Maint / Mgmt
- −$172
- Net cashflow
- $342
Break-even live
UW: 25.0% down · 7.5% · 30yr · 1.5% tax · 5.0% vac · 8.0% maint · 8.0% mgmt
Financing live
Cash to close
- Down payment
- $12,475
- Closing costs
- $1,497
- Reserves months
- —
- Total cash needed
- —
Loan-product check · same deal, 3 products live
Conventional
25% down · 7.5% · 30yr
- Down + closing
- —
- Monthly P&I
- —
- Monthly cashflow
- —
- DSCR
- —
- Eligible?
- —
Personal DTI + credit; lowest rate.
DSCR
20% down · 8.5% · 30yr
- Down + closing
- —
- Monthly P&I
- —
- Monthly cashflow
- —
- DSCR
- —
- Eligible?
- —
No personal income docs; deal must DSCR.
Hard money
10% down · 12.0% · 12mo
- Down + closing
- —
- Monthly P&I
- —
- Monthly cashflow
- —
- DSCR
- —
- Eligible?
- —
Short-term bridge; refi at stabilization.
Listing history 3 events
-
2026-04-30status Pending
-
2026-04-25$49,900 Active
-
2026-04-23historical $49,900
ⓘ Source: listings_history table (triggers on properties + properties_extension) + one-shot
backfill from property_details.listing_events for pre-trigger history.
Tax reassessment forecast MO · Resets to sale price
- Current annual tax
- $284 · $24/mo
- Projected year-2 tax
- $484 · $40/mo
- Expected delta
- +$200/yr (+$17/mo · 70.3%)
ⓘ Screening estimate from a state-policy table — verify with the county assessor before closing.
Climate risk First Street
- Flood 1/10 Low FEMA zone X (unshaded) · 0% chance over 30 yrs
- Wildfire 3/10 Moderate
- Heat 4/10 Moderate 7 d/yr ≥107°F today · 18 d/yr by 30 yrs out
- Wind 2/10 Low
- Air quality 2/10 Low 0 unhealthy d/yr today · 1 by 30 yrs out
Nearby sold comps map
Loading sold comps map…
Walkable amenities ~0.75 mi
Loading nearby amenities…
Taxation est. · year 1
- Rental income
- $9,852
- − Mortgage interest
- −$2,795
- − Property taxes
- −$284
- − Insurance
- −$250
- − Repairs & maintenance
- −$788
- − Management
- −$788
- − Depreciation
- −$1,452
- Taxable income
- $3,495
- Est. tax owed @ 24.0%
- −$839
- After-tax cash flow
- $3,270/yr
For passive investors: Depreciation is non-cash, so a rental often shows a tax loss while cash-flowing — sheltering income. Rental losses are passive: they offset passive income freely, and up to $25,000/yr can offset ordinary (W-2) income if you actively participate and your MAGI is under $100k (phasing out to $0 by $150k); unused losses carry forward. On sale, claimed depreciation is recaptured at up to 25%, and gains may owe capital-gains tax (a 1031 exchange can defer both). Figures are a year-1 estimate at your 24.0% rate — not tax advice; consult a CPA.
Schools (NCES district)
- District
- Gasconade County R-I
- NCES district ID
- 2914280
- Math proficiency
- 44% ▼ -3.00%
- Reading proficiency
- 48% ▼ -6.00%
- Median HH income
- $44,397
- Composite
- 38.92/100
- National rank
- #4090
- State rank
- #86 of 324 in MO
Livability — Hermann
- Score
- 74/100
- State rank
- #66
- US rank
- #4524
Category grades
Schools grade is shown separately in the Schools card above.
Census & demographics
- Population (ZIP)
- 5,559
Population outlook (Gasconade County) Hauer SSP2
- Today (2025)
- 14,190 people
- By 2030
- 13,687 · -3.5%
- By 2040
- 12,480 · -12.1%
- By 2050
- 11,227 · -20.9%
- By 2075
- 8,878 · -37.4%
- By 2100
- 6,570 · -53.7%
Race, ethnicity, and origin ACS 2023
- Neighborhood character
- Predominantly White (95%)
- Race & ethnicity
- White 95% Two or more races 2% Black 2%
- Common ancestry
- Lithuanian 3% Romanian 2% Slovak 1%
- Foreign-born
- 1%
Political lean MEDSL · Gasconade
- 2024 margin
- Solid R (+60.2) · D 19.4% · R 79.7%
- 2008→2024 swing
- -36.2pp toward R · 2008: -24.0pp · 2024: -60.2pp
- All cycles
- 2024: R+60.2 2020: R+58.3 2016: R+55.8 2012: R+39.2 2008: R+24.0
Not yet ingested
- Civics
- —
Market trends
- HPI YoY
- ▼ -4.04%
- Current HPI
- 307.8
- Rent YoY
- —
- Metro
- —
- State GDP YoY
- ▲ 1.84%
- F500 in state
- 20
Industry mix (Fortune 500 HQ in MO)
| Industry | F500 HQs | Revenue |
|---|---|---|
| Healthcare | 1 | $163B |
|
||
| Insurance | 1 | $21B |
|
||
| Industrial Technology | 1 | $17B |
|
||
| Retail | 1 | $16B |
|
||
| Industrial Distribution | 1 | $10B |
|
||
| Utilities | 1 | $9B |
|
||
Price history
+0.0% since first listed3 events — show timeline
- 2026-04-30 Pending — MARIS as Distributed by MLS Grid
- 2026-04-25 Listed $49,900 MARIS as Distributed by MLS Grid
- 2026-04-23 Coming Soon $49,900 MARIS as Distributed by MLS Grid
Property tax history
+4.4%/yrLatest (2025): $284 · +14.2% YoY. Source: county tax records.
Cash-flow waterfall
monthlySold comps — $/sqft
last 12 mo · ≤1 miLoading sold comps…