94 Delta Dr · Oakwood, IL
Flood risk No data
- FEMA flood zone
- —
- Chance of flooding over 30 yrs
- —
- Est. flood insurance / yr
- —
Fire risk No data
- Est. fire insurance / yr
- —
Heat risk No data
- Hot days now (above threshold)
- —
- Hot days in 30 yrs
- —
Wind risk No data
- Chance of severe wind over 30 yrs
- —
Air-quality risk No data
- Unhealthy air days now
- —
- Unhealthy air days in 30 yrs
- —
Risk factors via First Street. Map © Google.
Why this score? — see what drove the B+ grade
The composite is a weighted blend of 9 inputs, each scored 0–100. Each bar is that input's sub-score; the figure is the points it added to the 100-point composite (weight × sub-score).
- Cash flow +30.0/30.0
- 1% rule +10.0/10.0
- DSCR +10.0/10.0
- Appreciation +9.2/10.0
- ARV discount +7.5/15.0
- Condition / age +4.0/5.0
- Livability +3.0/5.0
- Rent growth +2.5/5.0
- Schools +1.4/10.0
$39,900
🖨 Deal sheet 📄 Offer letter ✓ Due diligence
Listing remarks
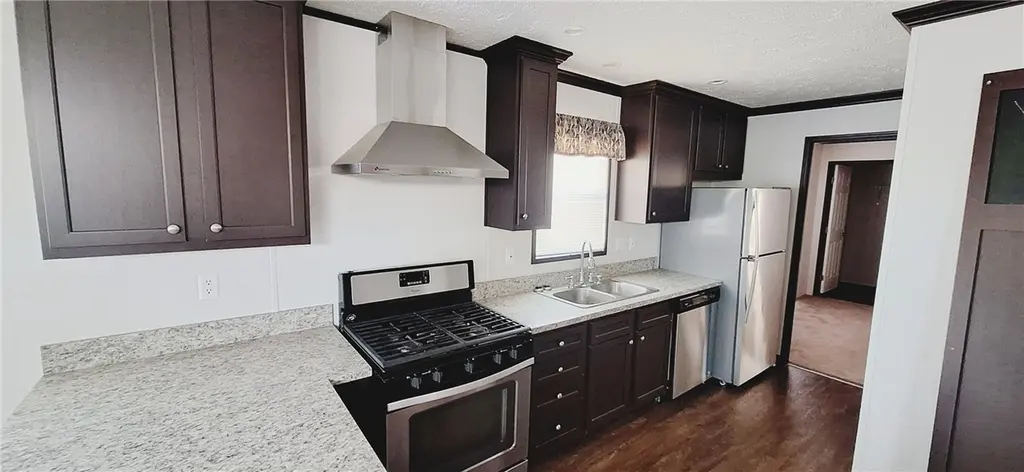
Welcome to this well maintained 2021 mobile home located at 94 Delta Dr in the front section of Lake Bluff Mobile Home Park. This like-new home offers a bright and airy open-concept layout with an abundance of natural lighting throughout. Featuring 2 bedrooms and 2 full bathrooms, this home combines modern comfort with functional living space. The spacious kitchen flows into the living and dining areas, creating the perfect setup for entertaining or everyday living. Conveniently located in the desirable Oakwood Community Unit School District 76, this move-in ready property offers small-town charm with a welcoming community feel. Don’t miss your opportunity to own this stylish and low-
Key facts
- Move-in ready
- Spacious kitchen
- Low-maintenance home
Tags
Property features AI
Finance
- Other: Property type listed as Residential (subtype: Other); Lot approximately 0.2 acres; Zoning: Other
Exterior
- Utilities: Public water; Public sewer
- Home design: One-story residential home; Vinyl siding construction; Entry/facing direction not specified
- Construction: Vinyl siding; Shingle roof; Other foundation
- Exterior features: Shingle roof; Gravel road access
Interior
- Kitchen: Cooktop, Oven, Dishwasher, Refrigerator, Disposal
- Bedrooms: Total of 5 rooms (bedroom count not specified)
- Bathrooms: 2 full bathrooms
- Heating & cooling: Forced air heating; Central air conditioning
- Interior features: Cooktop, Dishwasher, Disposal, Oven, Refrigerator, Electric water heater
- Laundry & utility: Laundry located on the main level
Neighborhood map
What this means for you Summary
Snapshot
- This is a 2-bed/2.0-bath manufactured listed at $40k. Condition is rated good.
Deal economics
- At list price, monthly cash flow is $582 ($7k/yr) — positive.
- The deal already cash-flows at list — no discount required.
- Meets the 1% rule at list price ($1k rent vs $40k).
- Recommended offer: $39k (3.0% below list) — sets the bar for market timing.
Location & tenants
- Location reads 59/100 on livability (#1,056 in IL) — a working-class tenant base; expect higher turnover. Strengths: cost of living A+, housing A+; Watch: employment D+, schools F, crime D-.
- Oakwood CUSD 76 (rural): math 12% / reading 19% proficiency, ranked #495 of 620 in IL (top 80%) — low school quality limits family demand, transient renter base, plan for 1-2y turnover.
- Market conditions: 15 active listings in the ZIP; 8 units permitted in Vermilion County in 2024 (0 in 5+ unit buildings).
Forward outlook
- In year one you build about $4k of equity ($276 loan paydown + $3k appreciation (8.3% local appreciation)).
- Vermilion County population projected at -24% by 2050 — secular population decline; favor cash flow + early exit over multi-decade hold.
- At projected returns (8.3% appreciation + 3.0% rent growth), your $11k cash investment doubles in ~2 years — after that, you're playing with house money.
- By year 9, paydown + projected appreciation supports a ~$35k cash-out refi (75% LTV) — recoverable capital for the next deal without selling this one.
Negotiation context
- It's been on market 33 days — a 3% lower offer ($39k) is reasonable based on typical stale-listing flexibility.
- 3 sale attempts since 2y ago with the ask held roughly flat each time — persistent listings suggest the price (not the market) is what's stuck; bring a comps-based counter.
Questions for the listing agent
- It's been on market 33 days. Have you received any prior offers? Is the seller open to a 3% concession, seller financing, or rate buy-down credit?
- Is there a deadline driving the sale (1031 exchange, divorce, estate, relocation)? That informs how much negotiation room exists.
- Schools are F-rated, which usually means shorter tenancies and higher turnover. Who's the typical renter profile here, and what's been the actual vacancy rate?
- Crime grade is D in this area — have there been break-ins, vandalism, or insurance claims at this property in the last 3 years? What carrier currently insures it and at what premium?
- What's the average days-on-market for RENTAL listings here right now (not sales)? A rising rental-DOM trend means longer vacancies and softer asking-rent achievability than the comps imply.
- What's the recent tenant-quality profile in this submarket — average credit score on applications, eviction rate, late-payment / NSF rate, and stable-employment percentage? A property-management company in the area should have these aggregated.
- How much new for-sale + rental construction is in the pipeline within 1–3 miles? Heavy new supply typically softens prices + rents 12–24 months out; constrained supply supports both.
Investment metrics
- 1% rule
- 2.72% ✓
- Cap rate
- 23.79%
- Cash-on-cash
- 62.50%
- DSCR
- 3.78
- GRM
- 3.1
CMA / ARV
No comps found within radius.
Projected returns pro-forma
8.31% appreciation · 3.0% rent growth · sell at horizon
- IRR
- 72.7%
- Equity multiple
- 5.86×
- Total profit
- $54,312
- Equity at exit
- $31,162
- IRR
- 67.9%
- Equity multiple
- 12.65×
- Total profit
- $130,126
- Equity at exit
- $62,684
Cash invested: $11,172 (down + closing). Projections, not guarantees.
Landlord ↔ Tenant lean methodology
- Overall (STATE)
- 43 Moderately Tenant-Leaning
- State Illinois
- 43 Moderately Tenant-Leaning · D+7
- County
- — inherits STATE
- City
- — inherits STATE
ZIP-level market 61858
- Home prices YoY
- 3.4%
- Active inventory
- 15
- Price-to-rent
- 3.1×
Monthly cashflow live
- Estimated rent
- $1,086 medium interval (Pro) →
- Mortgage (P&I)
- −$209
- Tax est. 1.5%
- −$50 /mo · $598/yr
- Insurance
- −$17
- HOA
- −$0
- Vacancy / Maint / Mgmt
- −$228
- Net cashflow
- $582
Break-even live
UW: 25.0% down · 7.5% · 30yr · 1.5% tax · 5.0% vac · 8.0% maint · 8.0% mgmt
Financing live
Cash to close
- Down payment
- $9,975
- Closing costs
- $1,197
- Reserves months
- —
- Total cash needed
- —
Loan-product check · same deal, 3 products live
Conventional
25% down · 7.5% · 30yr
- Down + closing
- —
- Monthly P&I
- —
- Monthly cashflow
- —
- DSCR
- —
- Eligible?
- —
Personal DTI + credit; lowest rate.
DSCR
20% down · 8.5% · 30yr
- Down + closing
- —
- Monthly P&I
- —
- Monthly cashflow
- —
- DSCR
- —
- Eligible?
- —
No personal income docs; deal must DSCR.
Hard money
10% down · 12.0% · 12mo
- Down + closing
- —
- Monthly P&I
- —
- Monthly cashflow
- —
- DSCR
- —
- Eligible?
- —
Short-term bridge; refi at stabilization.
Listing history 20 events
-
2026-06-19days on market $39,900 Active 33 DOM
-
2026-06-18days on market $39,900 Active 32 DOM
-
2026-06-17days on market $39,900 Active 31 DOM
-
2026-06-16days on market $39,900 Active 30 DOM
-
2026-06-15days on market $39,900 Active 29 DOM
-
2026-06-14days on market $39,900 Active 27 DOM
-
2026-06-12days on market $39,900 Active 26 DOM
-
2026-06-09days on market $39,900 Active 23 DOM
-
2026-06-08days on market $39,900 Active 22 DOM
-
2026-06-07days on market $39,900 Active 21 DOM
-
2026-06-02days on market $39,900 Active 16 DOM
-
2026-06-01days on market $39,900 Active 15 DOM
-
2026-05-31days on market $39,900 Active 14 DOM
-
2026-05-30days on market $39,900 Active 13 DOM
-
2026-05-18$39,900 Active
-
2024-11-29historical
-
2024-06-08price $39,500
-
2024-06-07price
-
2024-04-29$42,000 Active
-
2024-04-29Active
ⓘ Source: listings_history table (triggers on properties + properties_extension) + one-shot
backfill from property_details.listing_events for pre-trigger history.
Nearby sold comps map
Loading sold comps map…
Walkable amenities ~0.75 mi
Loading nearby amenities…
Taxation est. · year 1
- Rental income
- $13,027
- − Mortgage interest
- −$2,235
- − Property taxes
- −$598
- − Insurance
- −$200
- − Repairs & maintenance
- −$1,042
- − Management
- −$1,042
- − Depreciation
- −$1,161
- Taxable income
- $6,749
- Est. tax owed @ 24.0%
- −$1,620
- After-tax cash flow
- $5,363/yr
For passive investors: Depreciation is non-cash, so a rental often shows a tax loss while cash-flowing — sheltering income. Rental losses are passive: they offset passive income freely, and up to $25,000/yr can offset ordinary (W-2) income if you actively participate and your MAGI is under $100k (phasing out to $0 by $150k); unused losses carry forward. On sale, claimed depreciation is recaptured at up to 25%, and gains may owe capital-gains tax (a 1031 exchange can defer both). Figures are a year-1 estimate at your 24.0% rate — not tax advice; consult a CPA.
Condition & rehab AI · 12 photos
This 2021 mobile home is in excellent condition with a good condition score of 80. It offers a bright and airy open-concept layout with modern finishes and is move-in ready.
Value-add opportunities
- Both Paint the interior walls — Fresh paint can enhance the home's curb appeal and interior aesthetics.
- Both Replace the air filter — A clean air filter improves air quality and HVAC system efficiency.
- Both Repair any deck damage — A well-maintained deck enhances the home's curb appeal and adds value for potential buyers or renters.
Renovation cost estimate screening
Value-add ROI direction
- Both Paint the interior walls — Fresh paint can enhance the home's curb appeal and interior aesthetics. ↑
- Both Replace the air filter — A clean air filter improves air quality and HVAC system efficiency. ↑
- Both Repair any deck damage — A well-maintained deck enhances the home's curb appeal and adds value for potential buyers or renters. ↑
ⓘ Cost ranges are severity-bucket heuristics (US national rule-of-thumb). Get contractor quotes + a written scope before underwriting a rehab budget.
Schools (NCES district)
- District
- Oakwood CUSD 76
- NCES district ID
- 1710800
- Math proficiency
- 12% ▼ -10.00%
- Reading proficiency
- 19% ▼ -9.00%
- Median HH income
- $49,722
- Composite
- 14.13/100
- National rank
- #9456
- State rank
- #495 of 620 in IL
Livability — Oakwood
- Score
- 59/100
- State rank
- #1056
- US rank
- #20208
Category grades
Schools grade is shown separately in the Schools card above.
Census & demographics
- Census place
- Oakwood, IL
- Population (ZIP)
- 2,716
Population outlook (Vermilion County) Hauer SSP2
- Today (2025)
- 72,775 people
- By 2030
- 69,235 · -4.9%
- By 2040
- 62,360 · -14.3%
- By 2050
- 55,539 · -23.7%
- By 2075
- 40,606 · -44.2%
- By 2100
- 26,985 · -62.9%
Race, ethnicity, and origin ACS 2023
- Neighborhood character
- Predominantly White (98%)
- Race & ethnicity
- White 98% Two or more races 2%
- Common ancestry
- Romanian 3% Italian 2% Slovak 2%
- Foreign-born
- 1% · Canada
- Languages at home
- 99% English-only · German/W. Germanic 1%
Political lean MEDSL · Vermilion
- 2024 margin
- Solid R (+35.7) · D 31.4% · R 67.0% · Other 1.6%
- 2008→2024 swing
- -36.2pp toward R · 2008: 0.6pp · 2024: -35.7pp
- All cycles
- 2024: R+35.7 2020: R+32.9 2016: R+29.2 2012: R+15.7 2008: D+0.6
Not yet ingested
- Civics
- —
Market trends
- HPI YoY
- ▲ 8.31%
- Current HPI
- 251.0822
- Rent YoY
- —
- Metro
- —
- State GDP YoY
- ▲ 1.59%
- F500 in state
- 60
Industry mix (Fortune 500 HQ in IL)
| Industry | F500 HQs | Revenue |
|---|---|---|
| Insurance | 4 | $201B |
|
||
| Consumer Goods | 4 | $87B |
|
||
| Industrial Machinery | 3 | $64B |
|
||
| Healthcare | 2 | $55B |
|
||
| Retail / Pharmacy | 1 | $148B |
|
||
| Agriculture / Food | 1 | $86B |
|
||
Price history
-5.0% since first listed6 events — show timeline
- 2026-05-18 Listed $39,900 CIBR
- 2024-11-29 Listing Removed — MRED as Distributed by MLS Grid
- 2024-06-08 Price Changed $39,500 CIBR
- 2024-06-07 Price Changed — MRED as Distributed by MLS Grid
- 2024-04-29 Listed — MRED as Distributed by MLS Grid
- 2024-04-29 Listed $42,000 CIBR
Cash-flow waterfall
monthlySold comps — $/sqft
last 12 mo · ≤1 miLoading sold comps…