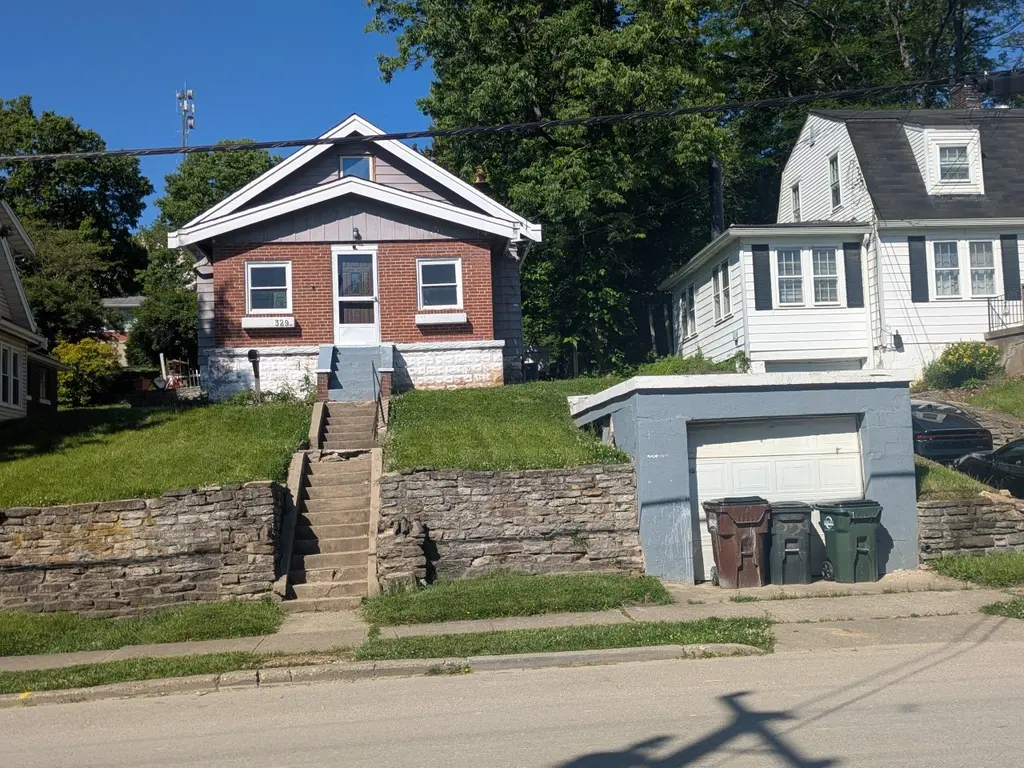
329 Highway Ave · Ludlow, KY
Flood risk 1/10 · Minimal
- FEMA flood zone
- X (unshaded)
- Chance of flooding over 30 yrs
- 0.0%
- Est. flood insurance / yr
- $507 – $1,088
Fire risk 1/10 · Minimal
- Est. fire insurance / yr
- $839 – $1,559
Heat risk 4/10 · Minor
- Hot days now (above 103°F)
- 7 days/yr
- Hot days in 30 yrs
- 19 days/yr
Wind risk 2/10 · Minimal
- Chance of severe wind over 30 yrs
- 1.0%
Air-quality risk 3/10 · Minor
- Unhealthy air days now
- 2 days/yr
- Unhealthy air days in 30 yrs
- 3 days/yr
Risk factors via First Street. Map © Google.
Why this score? — see what drove the B- grade
The composite is a weighted blend of 9 inputs, each scored 0–100. Each bar is that input's sub-score; the figure is the points it added to the 100-point composite (weight × sub-score).
- Cash flow +30.0/30.0
- 1% rule +10.0/10.0
- DSCR +10.0/10.0
- ARV discount +7.5/15.0
- Livability +4.4/5.0
- Rent growth +2.5/5.0
- Schools +2.5/10.0
- Condition / age +2.5/5.0
- Appreciation +0.0/10.0
$94,900
🖨 Deal sheet 📄 Offer letter ✓ Due diligence
Listing remarks MLS
Well loved home in close proximity to downtown Cincinnati. Freshly painted interior and move in ready. Beautiful tiled fireplace accents the living room w/ overhead fan & laminate flooring. Large formal dining room w/ fan. Huge eat in kitchen boasts counter bar, pantry , & walkout. Flexible floorplan with 1st & 2nd floor bedroom. Usable rear yard w/ storage shed/playhouse. .
Key facts
- 7,500 sq ft lot
- Parking
- Listed 23 days
Property features AI
Exterior
- Parking: On-street parking
- Utilities: Public water; Public sewer
- Home design: Single-family residence; One and one-half stories; Existing structure
- Construction: Brick exterior; Block foundation
- Exterior features: Vinyl and wood frame windows; Shingle roof; Lot dimensions approximately 50 x 170
Interior
- Kitchen: Kitchen (14 x 10)
- Bedrooms: Primary bath (8 x 5); Bedroom 2 (12 x 14)
- Bathrooms: 1 full bathroom
- Interior features: Fireplace
Neighborhood map
What this means for you Summary
Snapshot
- This is a 2-bed/1.0-bath single-family listed at $95k.
Deal economics
- At list price, monthly cash flow is $647 ($8k/yr) — positive.
- The deal already cash-flows at list — no discount required.
- Meets the 1% rule at list price ($2k rent vs $95k).
- Recommended offer: $93k (1.5% below list) — sets the bar for market timing.
- Cap rate 14.5% vs local median 2.8% in Ludlow — top-decile yield for the area; either an underpriced asset or a hidden risk that comps aren't pricing in. Stress-test before assuming the spread holds.
Location & tenants
- Location reads 87/100 on livability (#36 in KY, #326 nationally) — a professional / high-income tenant draw. Strengths: crime A+, commute A+, cost of living A+.
- Ludlow Independent (suburban): math 26% / reading 33% proficiency, ranked #105 of 165 in KY (top 64%) — low school quality limits family demand, transient renter base, plan for 1-2y turnover.
- Market conditions: 92 active listings in the ZIP; 11 comparable units currently listed for rent nearby; rentals at typical pace (median 17d on market — plan ~3-4 weeks tenant-placement turnaround); 699 units permitted in Kenton County in 2024 (287 in 5+ unit buildings).
Forward outlook
- Local home prices are declining (-3.0%/yr); year-one equity from $656 of loan paydown is wiped out by about $3k of value loss. Plan a longer hold.
- Kenton County population projected at +5% by 2050 — modest demand growth; plan on rents tracking national, not racing it.
- At projected returns (-3.0% appreciation + 3.0% rent growth), your $27k cash investment doubles in ~5 years — after that, you're playing with house money.
Negotiation context
- It's been on market 23 days — a 2% lower offer ($93k) is reasonable based on typical stale-listing flexibility.
- 3 sale attempts since 8y ago; this cycle's ask has dropped $5k (5%) from the opening price — seller is motivated, your offer sets the floor, not the list.
- Current owner paid $75k; 27% above their basis — modest negotiation headroom, anchor on the comps not their cost.
Questions for the listing agent
- Is there a deadline driving the sale (1031 exchange, divorce, estate, relocation)? That informs how much negotiation room exists.
- What's the average days-on-market for RENTAL listings here right now (not sales)? A rising rental-DOM trend means longer vacancies and softer asking-rent achievability than the comps imply.
- What's the recent tenant-quality profile in this submarket — average credit score on applications, eviction rate, late-payment / NSF rate, and stable-employment percentage? A property-management company in the area should have these aggregated.
- How much new for-sale + rental construction is in the pipeline within 1–3 miles? Heavy new supply typically softens prices + rents 12–24 months out; constrained supply supports both.
Investment metrics
- 1% rule
- 1.79% ✓
- Cap rate
- 14.48%
- Cash-on-cash
- 29.23%
- DSCR
- 2.30
- GRM
- 4.7
CMA / ARV
- ARV (median comp)
- $207,439
- List price
- $94,900
- Delta
- -54.25%
- Verdict
- UNDERPRICED
- Comps
- 20 within 1.0 mi
Show comp detail 12 sales within ~0.75 mi
| Address | Dist | Beds/Ba | Sqft | Sold | Price | $/sf | Match |
|---|---|---|---|---|---|---|---|
| 217 Montclair Ave | 0.13mi | 3/2.0 (+1) | 1,418 (+6%) | 3mo | $227,500 | $160 | 73 |
| 134 Highway Ave | 0.21mi | 3/1.5 (+1) | 1,255 (-6%) | 6mo | $250,000 | $199 | 67 |
| 630 Sunset Ct | 0.57mi | 2/2.0 | 1,316 (-2%) | 2mo | $550,000 | $418 | 65 |
| 25 Kenner St | 0.62mi | 2/1.5 | 1,296 (-3%) | 1mo | $182,500 | $141 | 63 |
| 428 Station Dr Unit 34-102 | 0.56mi | 2/2.0 | 1,326 (-1%) | 8mo | $246,451 | $186 | 62 |
| 448 Station Dr Unit 35-102 | 0.56mi | 2/2.0 | 1,326 (-1%) | 9mo | $265,487 | $200 | 61 |
| 535 Laurel St | 0.54mi | 2/1.0 | 1,199 (-10%) | 8mo | $196,000 | $163 | 50 |
| 1307 Highway Ave | 0.28mi | 3/2.0 (+1) | 1,524 (+14%) | 8mo | $229,800 | $151 | 48 |
| 450 Station Dr Unit 35-302 | 0.56mi | 2/2.0 | 1,213 (-9%) | 8mo | $270,724 | $223 | 47 |
| 446 Station Dr Unit 35-202 | 0.56mi | 2/2.0 | 1,213 (-9%) | 8mo | $307,316 | $253 | 47 |
| 430 Station Dr Unit 34-302 | 0.56mi | 2/2.0 | 1,213 (-9%) | 9mo | $273,540 | $226 | 47 |
| 445 Victoria St | 0.66mi | 2/2.0 | 1,475 (+10%) | 4mo | $315,000 | $214 | 45 |
Match score weights: distance 35% · size 25% · config 20% · recency 20%. Top-matched comps best support the ARV.
Projected returns pro-forma
-3.0% appreciation · 3.0% rent growth · sell at horizon
- IRR
- 23.7%
- Equity multiple
- 1.97×
- Total profit
- $25,897
- Equity at exit
- $14,150
- IRR
- 31.6%
- Equity multiple
- 3.85×
- Total profit
- $75,833
- Equity at exit
- $8,205
Cash invested: $26,572 (down + closing). Projections, not guarantees.
Landlord ↔ Tenant lean methodology
- Overall (STATE)
- 83 Strongly Landlord-Friendly
- State Kentucky
- 83 Strongly Landlord-Friendly · R+16
- County
- — inherits STATE
- City
- — inherits STATE
ZIP-level market 41016
- Active inventory
- 92
- Price-to-rent
- 4.7×
Monthly cashflow live
- Estimated rent
- $1,696 high interval (Pro) →
- Mortgage (P&I)
- −$498
- Tax from tax record
- −$155 /mo · $1,862/yr
- Insurance
- −$40
- HOA
- −$0
- Vacancy / Maint / Mgmt
- −$356
- Net cashflow
- $647
Break-even live
UW: 25.0% down · 7.5% · 30yr · 1.5% tax · 5.0% vac · 8.0% maint · 8.0% mgmt
Financing live
Cash to close
- Down payment
- $23,725
- Closing costs
- $2,847
- Reserves months
- —
- Total cash needed
- —
Loan-product check · same deal, 3 products live
Conventional
25% down · 7.5% · 30yr
- Down + closing
- —
- Monthly P&I
- —
- Monthly cashflow
- —
- DSCR
- —
- Eligible?
- —
Personal DTI + credit; lowest rate.
DSCR
20% down · 8.5% · 30yr
- Down + closing
- —
- Monthly P&I
- —
- Monthly cashflow
- —
- DSCR
- —
- Eligible?
- —
No personal income docs; deal must DSCR.
Hard money
10% down · 12.0% · 12mo
- Down + closing
- —
- Monthly P&I
- —
- Monthly cashflow
- —
- DSCR
- —
- Eligible?
- —
Short-term bridge; refi at stabilization.
Rent comps 11 comps
| Address | Beds | Baths | Sqft | Rent | $/sqft | DOM | Units | Dist |
|---|---|---|---|---|---|---|---|---|
| 1261 Parkway Ave Covington, KY | 1.0–2.0 | 1.0 | 850 | $1,375 | $1.62 | 4d | 3 | 0.28mi |
| 22 Swain Ct Covington, KY | 1.0–3.0 | 1.0–2.0 | 951 | $1,895 | $1.99 | 1d | 3 | 0.49mi |
| 336 Elm St Unit 4 Ludlow, KY | 2.0 | 1.0 | 1100 | $1,350 | $1.23 | 43d | 1 | 0.53mi |
| 336 Elm St Unit 2 Ludlow, KY | 2.0 | 1.0 | 1050 | $1,275 | $1.21 | 1d | 1 | 0.53mi |
| 239 Forest Ave Ludlow, KY | 3.0 | 1.0 | 1146 | $1,395 | $1.22 | 17d | 1 | 0.53mi |
| 515 Main St Covington, KY | 1.0–2.0 | 1.0–2.0 | 934 | $2,215 | $2.37 | 1d | 8 | 1.28mi |
| 2600 Bushnell St Cincinnati, OH | 2.0 | 2.0 | 937 | $1,295 | $1.38 | 23d | 1 | 1.30mi |
| 353 W 4th St Cincinnati, OH | 2.0 | 2.0 | 1140 | $3,400 | $2.98 | 23d | 1 | 1.34mi |
| 810 Matson Pl Cincinnati, OH | 2.0 | 2.0 | 1196 | $2,100 | $1.76 | 1d | 1 | 1.38mi |
| 231 W 4th St Cincinnati, OH | 1.0 | 1.0 | 914 | $1,575 | $1.72 | 23d | 1 | 1.43mi |
| 633 Hawthorne Ave Unit 2 Cincinnati, OH | 3.0 | 1.0 | 1000 | $1,400 | $1.40 | 23d | 1 | 1.44mi |
Listing history 11 events
-
2026-06-01status $94,900 Pending 23 DOM
-
2026-05-31days on market $94,900 Active 23 DOM
-
2026-05-07$99,900 Active 113-char remark
-
2019-10-24soldstatus $75,000
-
2019-10-21soldstatus $75,000 Closed 389-char remark
Show marketing remark (389 chars)
Well loved home in close proximity to downtown Cincinnati. Freshly painted interior and move in ready. Beautiful tiled fireplace accents the living room w/ overhead fan & laminate flooring. Large formal dining room w/ fan. Huge eat in kitchen boasts counter bar, pantry , & walkout. Flexible floorplan with 1st & 2nd floor bedroom. Usable rear yard w/ storage shed/playhouse. .
-
2019-08-25historical 389-char remark
Show marketing remark (389 chars)
Well loved home in close proximity to downtown Cincinnati. Freshly painted interior and move in ready. Beautiful tiled fireplace accents the living room w/ overhead fan & laminate flooring. Large formal dining room w/ fan. Huge eat in kitchen boasts counter bar, pantry , & walkout. Flexible floorplan with 1st & 2nd floor bedroom. Usable rear yard w/ storage shed/playhouse. .
-
2019-05-30$79,900 389-char remark
Show marketing remark (389 chars)
Well loved home in close proximity to downtown Cincinnati. Freshly painted interior and move in ready. Beautiful tiled fireplace accents the living room w/ overhead fan & laminate flooring. Large formal dining room w/ fan. Huge eat in kitchen boasts counter bar, pantry , & walkout. Flexible floorplan with 1st & 2nd floor bedroom. Usable rear yard w/ storage shed/playhouse. .
-
2018-11-30historical
-
2018-05-31$85,000
-
2007-11-09soldstatus $80,000
-
1997-01-03soldstatus $65,000
ⓘ Source: listings_history table (triggers on properties + properties_extension) + one-shot
backfill from property_details.listing_events for pre-trigger history.
Tax reassessment forecast KY · Resets to sale price
- Current annual tax
- $1,862 · $155/mo
- Projected year-2 tax
- $1,862 · $155/mo
- Expected delta
- $0/yr ($0/mo · 0.0%)
ⓘ Screening estimate from a state-policy table — verify with the county assessor before closing.
Climate risk First Street
- Flood 1/10 Low FEMA zone X (unshaded) · 0% chance over 30 yrs
- Wildfire 1/10 Low
- Heat 4/10 Moderate 7 d/yr ≥103°F today · 19 d/yr by 30 yrs out
- Wind 2/10 Low 100% chance of damaging wind over 30 yrs
- Air quality 3/10 Moderate 2 unhealthy d/yr today · 3 by 30 yrs out
Nearby sold comps map
Loading sold comps map…
Walkable amenities ~0.75 mi
Loading nearby amenities…
Taxation est. · year 1
- Rental income
- $20,349
- − Mortgage interest
- −$5,316
- − Property taxes
- −$1,862
- − Insurance
- −$474
- − Repairs & maintenance
- −$1,628
- − Management
- −$1,628
- − Depreciation
- −$2,761
- Taxable income
- $6,681
- Est. tax owed @ 24.0%
- −$1,603
- After-tax cash flow
- $6,164/yr
For passive investors: Depreciation is non-cash, so a rental often shows a tax loss while cash-flowing — sheltering income. Rental losses are passive: they offset passive income freely, and up to $25,000/yr can offset ordinary (W-2) income if you actively participate and your MAGI is under $100k (phasing out to $0 by $150k); unused losses carry forward. On sale, claimed depreciation is recaptured at up to 25%, and gains may owe capital-gains tax (a 1031 exchange can defer both). Figures are a year-1 estimate at your 24.0% rate — not tax advice; consult a CPA.
Schools (NCES district)
- District
- Ludlow Independent
- NCES district ID
- 2103630
- Math proficiency
- 26% ▼ -17.00%
- Reading proficiency
- 33% ▼ -26.00%
- Median HH income
- $44,821
- Composite
- 25.27/100
- National rank
- #7492
- State rank
- #105 of 165 in KY
Livability — Ludlow
- Score
- 87/100
- State rank
- #36
- US rank
- #326
Category grades
Schools grade is shown separately in the Schools card above.
Census & demographics
- Census place
- Ludlow, KY
- County
- Kenton County · 142,881 people
- City population
- 5,795
- Metro
- Cincinnati, OH-KY-IN
- Population (ZIP)
- 5,795
- Household income
- $71,172
- Rent vs Own
- Severe rent burden
- 95.0
Population outlook (Kenton County) Hauer SSP2
- Today (2025)
- 174,205 people
- By 2030
- 177,897 · +2.1%
- By 2040
- 182,671 · +4.9%
- By 2050
- 183,543 · +5.4%
- By 2075
- 178,977 · +2.7%
- By 2100
- 159,920 · -8.2%
Race, ethnicity, and origin ACS 2023
- Neighborhood character
- Predominantly White (79%)
- Race & ethnicity
- White 79% Two or more races 10% Hispanic / Latino 8% Black 2%
- Hispanic origin (detail)
- Mexican 5%
- Common ancestry
- Slovak 2% Romanian 1% Serbian 1%
- Foreign-born
- 1% · Canada
- Languages at home
- 95% English-only · Spanish 3% German/W. Germanic 1%
Political lean MEDSL · Kenton
- 2024 margin
- Strong R (+21.7) · D 38.2% · R 59.9% · Other 1.9%
- 2008→2024 swing
- -0.9pp no change · 2008: -20.9pp · 2024: -21.7pp
- All cycles
- 2024: R+21.7 2020: R+19.3 2016: R+26.1 2012: R+24.3 2008: R+20.9
Not yet ingested
- Civics
- —
Market trends
- HPI YoY
- ▼ -141.84%
- Current HPI
- 215.1436
- Rent YoY
- —
- Metro
- Cincinnati, OH-KY-IN
- State GDP YoY
- ▲ 1.81%
- F500 in state
- 4
Industry mix (Fortune 500 HQ in KY)
| Industry | F500 HQs | Revenue |
|---|---|---|
| Healthcare | 1 | $118B |
|
||
| Food / Beverage | 1 | $7B |
|
||
Price history
+46.0% since first listed11 events — show timeline
- 2026-05-31 Pending — NKMLS
- 2026-05-28 Price Changed $94,900 NKMLS
- 2026-05-07 Listed $99,900 NKMLS
- 2019-10-24 Sold (Public Records) $75,000 Public Records
- 2019-10-21 Sold (MLS) $75,000 NKMLS
- 2019-08-25 Listing Removed — NKMLS
- 2019-05-30 Listed $79,900 NKMLS
- 2018-11-30 Listing Removed — NKMLS
- 2018-05-31 Listed $85,000 NKMLS
- 2007-11-09 Sold (Public Records) $80,000 Public Records
- 1997-01-03 Sold (Public Records) $65,000 Public Records
Property tax history
+5.3%/yrLatest (2025): $1,862 · +0.4% YoY. Source: county tax records.
Cash-flow waterfall
monthlySold comps — $/sqft
last 12 mo · ≤1 miLoading sold comps…