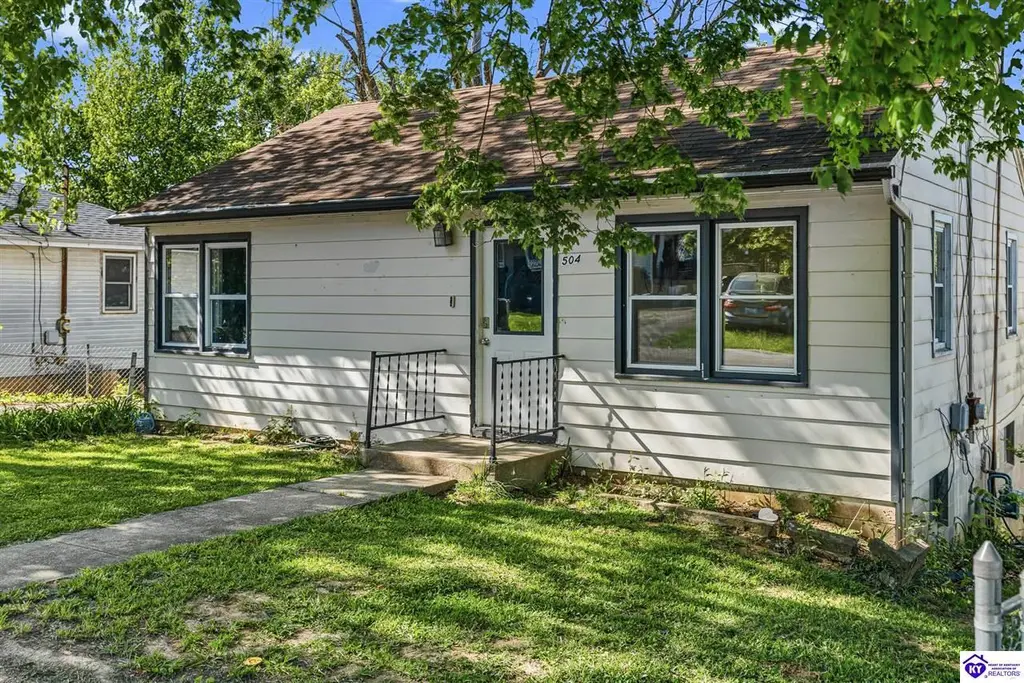
504 Locust St · Vine Grove, KY
Flood risk 1/10 · Minimal
- FEMA flood zone
- X (unshaded)
- Chance of flooding over 30 yrs
- 0.0%
- Est. flood insurance / yr
- $473 – $860
Fire risk 2/10 · Minimal
- Est. fire insurance / yr
- $839 – $1,559
Heat risk 5/10 · Moderate
- Hot days now (above 105°F)
- 7 days/yr
- Hot days in 30 yrs
- 19 days/yr
Wind risk 2/10 · Minimal
- Chance of severe wind over 30 yrs
- 4.0%
Air-quality risk 2/10 · Minimal
- Unhealthy air days now
- 0 days/yr
- Unhealthy air days in 30 yrs
- 1 days/yr
Risk factors via First Street. Map © Google.
Why this score? — see what drove the C grade
The composite is a weighted blend of 9 inputs, each scored 0–100. Each bar is that input's sub-score; the figure is the points it added to the 100-point composite (weight × sub-score).
- Cash flow +25.7/30.0
- DSCR +8.6/10.0
- ARV discount +7.5/15.0
- 1% rule +5.6/10.0
- Livability +3.6/5.0
- Schools +3.2/10.0
- Rent growth +2.5/5.0
- Condition / age +2.5/5.0
- Appreciation +0.0/10.0
$159,900
🖨 Deal sheet 📄 Offer letter ✓ Due diligence
Listing remarks MLS
Cute home located in a quiet neighborhood in the city of Vine Grove. Home is very close to Vine Grove Elementary School and James T. Alton Middle School. Fresh paint. New Carpet. New Ceramic Tiles. Fenced Yard. Partially Finished Walk-out Basement. Great Price! Must SEE!
Key facts
- Manageable yard
- Full basement
- Two additional rooms
Tags
Property features AI
Finance
- Other: Lot size approximately 0.1 acre; Located in the Allison Gross subdivision
Exterior
- Utilities: Public water; Public sewer
- Home design: Farm property; Residential farm
- Construction: Aluminum siding; Vinyl siding; Below-grade finished area
- Exterior features: Shingle roof
Interior
- Kitchen: Electric range
- Bathrooms: 1 full bathroom (main level)
- Heating & cooling: Forced air heating; Natural gas
- Interior features: Gas water heater; Finished full basement with walk-out access
- Laundry & utility: Dedicated laundry room
Neighborhood map
What this means for you Summary
Snapshot
- This is a 4-bed/1.0-bath single-family listed at $160k.
Deal economics
- At list price, monthly cash flow is $382 ($5k/yr) — positive.
- The deal already cash-flows at list — no discount required.
- Meets the 1% rule at list price ($2k rent vs $160k).
- Recommended offer: $158k (1.5% below list) — sets the bar for market timing.
- Cap rate 9.2% vs local median 4.0% in Vine Grove — top-decile yield for the area; either an underpriced asset or a hidden risk that comps aren't pricing in. Stress-test before assuming the spread holds.
Location & tenants
- Location reads 72/100 on livability (#124 in KY) — a middle-class / working-renter tenant base. Strengths: crime A+, cost of living A+, housing A+; Watch: amenities F, commute F, health & safety F.
- Hardin County (suburban): math 30% / reading 43% proficiency, ranked #47 of 165 in KY (top 28%) — families likely to look elsewhere, expect single-tenant / working-renter base with shorter leases.
- Zoned schools: Vine Grove Elementary School (math 33% / reading 34%, grade F, #334 of 676 statewide, top 50%, 511 students, 50% FRL); James T Alton Middle School (math 29% / reading 46%, grade F, #73 of 217 statewide, top 36%, 666 students, 46% FRL); North Hardin High School (math 26% / reading 33%, grade F, #127 of 254 statewide, top 58%, 1,651 students, 50% FRL).
- Market conditions: 155 active listings in the ZIP; 946 units permitted in Hardin County in 2024 (464 in 5+ unit buildings).
Forward outlook
- Local home prices are declining (-3.0%/yr); year-one equity from $1k of loan paydown is wiped out by about $5k of value loss. Plan a longer hold.
- Hardin County population projected at -16% by 2050 — secular population decline; favor cash flow + early exit over multi-decade hold.
Negotiation context
- It's been on market 15 days — a 2% lower offer ($158k) is reasonable based on typical stale-listing flexibility.
- 3 sale attempts since 8y ago with the ask held roughly flat each time — persistent listings suggest the price (not the market) is what's stuck; bring a comps-based counter.
- Current owner paid $65k; list at $160k implies a 145% gain — meaningful room to come down on a strong offer.
Risks & watch-outs
- Climate carrying-cost: extreme-heat days projected 7→19/yr by 2055 (HVAC capex compounding) — expect insurance premiums to compound above CPI over the hold.
Questions for the listing agent
- Built in 1963 — when were the roof, HVAC, electrical panel, plumbing, and water heater last replaced?
- Is there a deadline driving the sale (1031 exchange, divorce, estate, relocation)? That informs how much negotiation room exists.
- What's the average days-on-market for RENTAL listings here right now (not sales)? A rising rental-DOM trend means longer vacancies and softer asking-rent achievability than the comps imply.
- What's the recent tenant-quality profile in this submarket — average credit score on applications, eviction rate, late-payment / NSF rate, and stable-employment percentage? A property-management company in the area should have these aggregated.
- How much new for-sale + rental construction is in the pipeline within 1–3 miles? Heavy new supply typically softens prices + rents 12–24 months out; constrained supply supports both.
Investment metrics
- 1% rule
- 1.06% ✓
- Cap rate
- 9.16%
- Cash-on-cash
- 10.23%
- DSCR
- 1.46
- GRM
- 7.8
CMA / ARV
No comps found within radius.
Projected returns pro-forma
-3.0% appreciation · 3.0% rent growth · sell at horizon
- IRR
- -1.0%
- Equity multiple
- 0.96×
- Total profit
- $-1,656
- Equity at exit
- $23,842
- IRR
- 8.7%
- Equity multiple
- 1.66×
- Total profit
- $29,614
- Equity at exit
- $13,825
Cash invested: $44,772 (down + closing). Projections, not guarantees.
Landlord ↔ Tenant lean methodology
- Overall (STATE)
- 83 Strongly Landlord-Friendly
- State Kentucky
- 83 Strongly Landlord-Friendly · R+16
- County
- — inherits STATE
- City
- — inherits STATE
ZIP-level market 40175
- Home prices YoY
- -6.3%
- Active inventory
- 155
- Price-to-rent
- 7.8×
Monthly cashflow live
- Estimated rent
- $1,699 medium interval (Pro) →
- Mortgage (P&I)
- −$839
- Tax from tax record
- −$55 /mo · $659/yr
- Insurance
- −$67
- HOA
- −$0
- Vacancy / Maint / Mgmt
- −$357
- Net cashflow
- $382
Break-even live
UW: 25.0% down · 7.5% · 30yr · 1.5% tax · 5.0% vac · 8.0% maint · 8.0% mgmt
Financing live
Cash to close
- Down payment
- $39,975
- Closing costs
- $4,797
- Reserves months
- —
- Total cash needed
- —
Loan-product check · same deal, 3 products live
Conventional
25% down · 7.5% · 30yr
- Down + closing
- —
- Monthly P&I
- —
- Monthly cashflow
- —
- DSCR
- —
- Eligible?
- —
Personal DTI + credit; lowest rate.
DSCR
20% down · 8.5% · 30yr
- Down + closing
- —
- Monthly P&I
- —
- Monthly cashflow
- —
- DSCR
- —
- Eligible?
- —
No personal income docs; deal must DSCR.
Hard money
10% down · 12.0% · 12mo
- Down + closing
- —
- Monthly P&I
- —
- Monthly cashflow
- —
- DSCR
- —
- Eligible?
- —
Short-term bridge; refi at stabilization.
Listing history 11 events
-
2026-05-09status Pending
-
2026-05-02price $159,900
-
2026-04-20$164,900 Active
-
2019-02-12soldstatus $65,250
-
2019-02-12soldstatus $65,250
-
2019-02-11soldstatus $65,250 271-char remark
Show marketing remark (271 chars)
Cute home located in a quiet neighborhood in the city of Vine Grove. Home is very close to Vine Grove Elementary School and James T. Alton Middle School. Fresh paint. New Carpet. New Ceramic Tiles. Fenced Yard. Partially Finished Walk-out Basement. Great Price! Must SEE!
-
2018-08-11$59,900 271-char remark
Show marketing remark (271 chars)
Cute home located in a quiet neighborhood in the city of Vine Grove. Home is very close to Vine Grove Elementary School and James T. Alton Middle School. Fresh paint. New Carpet. New Ceramic Tiles. Fenced Yard. Partially Finished Walk-out Basement. Great Price! Must SEE!
-
2018-07-16soldstatus $27,900 466-char remark
Show marketing remark (466 chars)
2 bedrooms on the main level and 2 bedrooms located in the walkout basement. Home has a fenced yard. See attachment for PAS requirements and WFHM offer submittal information in MLS document section. Please submit all offers to the listing broker/agent. To report any concerns with a listing broker/agent, or to report any property condition or other concern needing escalation (including concerns related to a previously submitted offer), please call: 1-877-617-5274
-
2018-05-24$27,900 466-char remark
Show marketing remark (466 chars)
2 bedrooms on the main level and 2 bedrooms located in the walkout basement. Home has a fenced yard. See attachment for PAS requirements and WFHM offer submittal information in MLS document section. Please submit all offers to the listing broker/agent. To report any concerns with a listing broker/agent, or to report any property condition or other concern needing escalation (including concerns related to a previously submitted offer), please call: 1-877-617-5274
-
2005-08-01soldstatus $56,000
-
2005-08-01soldstatus $56,000
ⓘ Source: listings_history table (triggers on properties + properties_extension) + one-shot
backfill from property_details.listing_events for pre-trigger history.
Tax reassessment forecast KY · Resets to sale price
- Current annual tax
- $659 · $55/mo
- Projected year-2 tax
- $1,375 · $115/mo
- Expected delta
- +$717/yr (+$60/mo · 108.8%)
ⓘ Screening estimate from a state-policy table — verify with the county assessor before closing.
Climate risk First Street
- Flood 1/10 Low FEMA zone X (unshaded) · 0% chance over 30 yrs
- Wildfire 2/10 Low
- Heat 5/10 Major 7 d/yr ≥105°F today · 19 d/yr by 30 yrs out
- Wind 2/10 Low 4% chance of damaging wind over 30 yrs
- Air quality 2/10 Low 0 unhealthy d/yr today · 1 by 30 yrs out
Nearby sold comps map
Loading sold comps map…
Walkable amenities ~0.75 mi
Loading nearby amenities…
Taxation est. · year 1
- Rental income
- $20,383
- − Mortgage interest
- −$8,957
- − Property taxes
- −$659
- − Insurance
- −$800
- − Repairs & maintenance
- −$1,631
- − Management
- −$1,631
- − Depreciation
- −$4,652
- Taxable income
- $2,055
- Est. tax owed @ 24.0%
- −$493
- After-tax cash flow
- $4,089/yr
For passive investors: Depreciation is non-cash, so a rental often shows a tax loss while cash-flowing — sheltering income. Rental losses are passive: they offset passive income freely, and up to $25,000/yr can offset ordinary (W-2) income if you actively participate and your MAGI is under $100k (phasing out to $0 by $150k); unused losses carry forward. On sale, claimed depreciation is recaptured at up to 25%, and gains may owe capital-gains tax (a 1031 exchange can defer both). Figures are a year-1 estimate at your 24.0% rate — not tax advice; consult a CPA.
Schools (NCES district)
- District
- Hardin County
- NCES district ID
- 2102490
- Math proficiency
- 30% ▼ -13.00%
- Reading proficiency
- 43% ▼ -10.00%
- Median HH income
- $50,728
- Composite
- 31.61/100
- National rank
- #5945
- State rank
- #47 of 165 in KY
Livability — Vine Grove
- Score
- 72/100
- State rank
- #124
- US rank
- #5837
Category grades
Schools grade is shown separately in the Schools card above.
Census & demographics
- Census place
- Vine Grove, KY
- Population (ZIP)
- 16,283
Population outlook (Hardin County) Hauer SSP2
- Today (2025)
- 105,573 people
- By 2030
- 103,563 · -1.9%
- By 2040
- 97,077 · -8.0%
- By 2050
- 88,367 · -16.3%
- By 2075
- 65,405 · -38.0%
- By 2100
- 42,245 · -60.0%
Race, ethnicity, and origin ACS 2023
- Neighborhood character
- Predominantly White (81%)
- Race & ethnicity
- White 81% Black 9% Two or more races 7% Hispanic / Latino 2% Asian 2%
- Common ancestry
- Italian 2% Slovak 2% Serbian 1%
- Foreign-born
- 3% · South Korea, Canada
- Languages at home
- 95% English-only · Spanish 2% Tagalog/Filipino 1% German/W. Germanic 1%
Political lean MEDSL · Hardin
- 2024 margin
- Strong R (+29.3) · D 34.5% · R 63.8% · Other 1.7%
- 2008→2024 swing
- -8.7pp toward R · 2008: -20.6pp · 2024: -29.3pp
- All cycles
- 2024: R+29.3 2020: R+24.0 2016: R+30.2 2012: R+20.8 2008: R+20.6
Not yet ingested
- Civics
- —
Market trends
- HPI YoY
- ▼ -16.55%
- Current HPI
- 246.3715
- Rent YoY
- —
- Metro
- —
- State GDP YoY
- ▲ 1.81%
- F500 in state
- 4
Industry mix (Fortune 500 HQ in KY)
| Industry | F500 HQs | Revenue |
|---|---|---|
| Healthcare | 1 | $118B |
|
||
| Food / Beverage | 1 | $7B |
|
||
Price history
+185.5% since first listed11 events — show timeline
- 2026-05-09 Pending — HKARMLS
- 2026-05-02 Price Changed $159,900 HKARMLS
- 2026-04-20 Listed $164,900 HKARMLS
- 2019-02-12 Sold (Public Records) $65,250 Public Records
- 2019-02-12 Sold (Public Records) $65,250 Public Records
- 2019-02-11 Sold (MLS) $65,250 HKARMLS
- 2018-08-11 Listed $59,900 HKARMLS
- 2018-07-16 Sold (MLS) $27,900 Metro Search MLS
- 2018-05-24 Listed $27,900 Metro Search MLS
- 2005-08-01 Sold (Public Records) $56,000 Public Records
- 2005-08-01 Sold (Public Records) $56,000 Public Records
Property tax history
+3.8%/yrLatest (2025): $659 · +1.8% YoY. Source: county tax records.
Cash-flow waterfall
monthlySold comps — $/sqft
last 12 mo · ≤1 miLoading sold comps…