17375 Collins Ave #1505 · Sunny Isles Beach, FL
Flood risk 1/10 · Minimal
- FEMA flood zone
- X (unshaded)
- Chance of flooding over 30 yrs
- 0.0%
- Est. flood insurance / yr
- $507 – $1,088
Fire risk 1/10 · Minimal
- Est. fire insurance / yr
- $947 – $1,759
Heat risk 10/10 · Severe
- Hot days now (above 103°F)
- 7 days/yr
- Hot days in 30 yrs
- 26 days/yr
Wind risk 10/10 · Severe
- Chance of severe wind over 30 yrs
- 99.0%
Air-quality risk 2/10 · Minimal
- Unhealthy air days now
- 1 days/yr
- Unhealthy air days in 30 yrs
- 2 days/yr
Risk factors via First Street. Map © Google.
Why this score? — see what drove the C grade
The composite is a weighted blend of 9 inputs, each scored 0–100. Each bar is that input's sub-score; the figure is the points it added to the 100-point composite (weight × sub-score).
- Cash flow +20.8/30.0
- ARV discount +7.5/15.0
- DSCR +6.6/10.0
- 1% rule +6.0/10.0
- Appreciation +5.3/10.0
- Livability +4.3/5.0
- Schools +4.2/10.0
- Rent growth +2.7/5.0
- Condition / age +2.5/5.0
$398,000
🖨 Deal sheet 📄 Offer letter ✓ Due diligence
Listing remarks MLS
COMPLETLY UPDATED UNIT!!! OVER $50K in renovations. Porcelain floors, granite kitchen counter tops, new furniture. Incredible ocean and city views. unit is the largest one bedroom in the building . .almost 1000sqft (93 mt2). bathroom with Jacuzzi, bidet and separate shower. optional rental program with double tree Hilton. Located in the heart of Sunny Isles. Bring your client, nothing to do we other units in the building. Flexibility on price. Wont last!
Key facts
- Dining and shopping
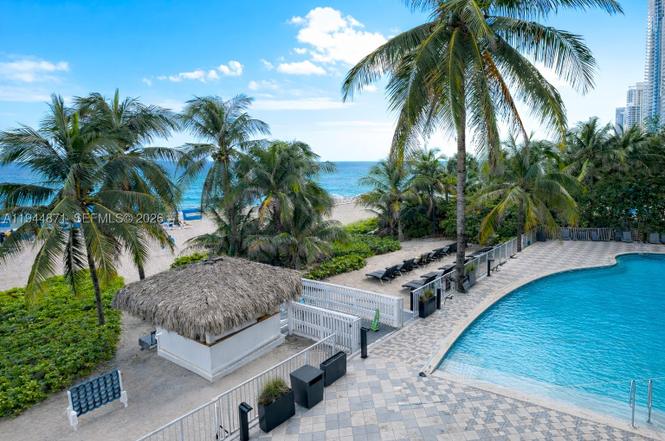
- Steps from the ocean
- Porcelain flooring
Tags
Property features AI
Finance
- Financial info: Lease considered; No pets allowed
- HOA & community: Monthly association fee of $100; Association covers common areas; Community amenities include pool, sauna, business center and beach rights
Exterior
- Parking: 1 covered garage space; Guest parking available
- Security: Door man; Closed-circuit cameras; Secured lobby
- Utilities: Water: connected; Sewer: connected; Power: connected
- Home design: Attached property; Entry located on level 15; 15th-floor entry; High-rise building (27 stories)
- Construction: Block construction; Resale property
- Exterior features: Oceanfront with ocean access; Association pool; Sauna; Beach rights; Lobby secured
Interior
- Kitchen: Electric range; Microwave; Dishwasher; Refrigerator
- Bathrooms: 1 full bathroom
- Heating & cooling: Central heating; Central air conditioning
- Interior features: Wet bar; Other interior features
- Laundry & utility: Dryer
Neighborhood map
What this means for you Summary
Snapshot
- This is a 1-bed/1.0-bath condo listed at $398k.
Deal economics
- At list price, monthly cash flow is $548 ($7k/yr) — positive.
- The deal already cash-flows at list — no discount required.
- Meets the 1% rule at list price ($4k rent vs $398k).
- Recommended offer: $386k (3.0% below list) — sets the bar for market timing.
- Cap rate 7.9% vs local median 0.8% in Sunny Isles Beach — top-decile yield for the area; either an underpriced asset or a hidden risk that comps aren't pricing in. Stress-test before assuming the spread holds.
Location & tenants
- Location reads 86/100 on livability (#20 in FL, #434 nationally) — a professional / high-income tenant draw. Strengths: schools A+, amenities A+, health & safety A+; Watch: housing C-, cost of living F.
- Miami-Dade (suburban): math 45% / reading 54% proficiency, ranked #40 of 73 in FL (top 55%) — families likely to look elsewhere, expect single-tenant / working-renter base with shorter leases; 64% free/reduced lunch — lower-income household profile, screen leases tightly.
- Market conditions: Rents flat; 1870 active listings in the ZIP; 10,051 units permitted in Miami-Dade County in 2024 (7,758 in 5+ unit buildings).
- At $4,374/mo this rent would consume 78% of the median local household income ($67k/yr) (locally 3106% of renters already pay >50% of income on rent) — very limited rent-growth headroom before tenants either downsize or default.
Forward outlook
- In year one you build about $5k of equity ($3k loan paydown + $2k appreciation (0.5% local appreciation)).
- Miami-Dade County population projected at +28% by 2050 — long-run rental-demand tailwind backs the buy-and-hold thesis.
- At projected returns (0.5% appreciation + 0.9% rent growth), your $111k cash investment doubles in ~9 years — after that, you're playing with house money.
- By year 7, paydown + projected appreciation supports a ~$36k cash-out refi (75% LTV) — recoverable capital for the next deal without selling this one.
Negotiation context
- It's been on market 49 days — a 3% lower offer ($386k) is reasonable based on typical stale-listing flexibility.
- 22 sale attempts since 13y ago; this cycle's ask is 10956% above the opening price — seller raised mid-cycle; expect resistance to lowballs.
Risks & watch-outs
- Climate carrying-cost: severe wind risk, 99% chance of damaging wind over 30y; extreme-heat days projected 7→26/yr by 2055 (HVAC capex compounding) — expect insurance premiums to compound above CPI over the hold.
Questions for the listing agent
- It's been on market 49 days. Have you received any prior offers? Is the seller open to a 3% concession, seller financing, or rate buy-down credit?
- What does the HOA fee cover, when was the last increase, and are there any pending special assessments or reserve-fund shortfalls?
- Any open or pending special assessments — roof, HVAC, plumbing, elevator, façade? What's the per-unit balance and payoff schedule, and is the seller paying it off at close or rolling it to the buyer?
- Is there a deadline driving the sale (1031 exchange, divorce, estate, relocation)? That informs how much negotiation room exists.
- Schools are A-rated — typically a magnet for longer-tenancy family renters. What's the average tenant stay here, and is there a school-zone premium baked into asking?
- What's the average days-on-market for RENTAL listings here right now (not sales)? A rising rental-DOM trend means longer vacancies and softer asking-rent achievability than the comps imply.
- What's the recent tenant-quality profile in this submarket — average credit score on applications, eviction rate, late-payment / NSF rate, and stable-employment percentage? A property-management company in the area should have these aggregated.
- How much new apartment / multifamily construction is in the pipeline within 1–3 miles? Heavy new supply (>2% of stock underway) typically softens rents 12–24 months out; light construction supports rent growth.
Investment metrics
- 1% rule
- 1.10% ✓
- Cap rate
- 7.95%
- Cash-on-cash
- 5.90%
- DSCR
- 1.26
- GRM
- 7.6
CMA / ARV
No comps found within radius.
Projected returns pro-forma
0.53% appreciation · 0.94% rent growth · sell at horizon
- IRR
- 4.5%
- Equity multiple
- 1.22×
- Total profit
- $24,502
- Equity at exit
- $126,163
- IRR
- 7.9%
- Equity multiple
- 1.86×
- Total profit
- $95,691
- Equity at exit
- $160,392
Cash invested: $111,440 (down + closing). Projections, not guarantees.
Landlord ↔ Tenant lean methodology
- Overall (STATE)
- 87 Strongly Landlord-Friendly
- State Florida
- 87 Strongly Landlord-Friendly · R+3
- County
- — inherits STATE
- City
- — inherits STATE
ZIP-level market 33160
- Home prices YoY
- 0.2%
- Rents YoY
- 0.9%
- Active inventory
- 1870
- Price-to-rent
- 7.6×
Monthly cashflow live
- Estimated rent
- $4,374 medium interval (Pro) →
- Mortgage (P&I)
- −$2,087
- Tax from tax record
- −$555 /mo · $6,657/yr
- Insurance
- −$166
- HOA
- −$100
- Vacancy / Maint / Mgmt
- −$919
- Net cashflow
- $548
Break-even live
UW: 25.0% down · 7.5% · 30yr · 1.5% tax · 5.0% vac · 8.0% maint · 8.0% mgmt
Financing live
Cash to close
- Down payment
- $99,500
- Closing costs
- $11,940
- Reserves months
- —
- Total cash needed
- —
Loan-product check · same deal, 3 products live
Conventional
25% down · 7.5% · 30yr
- Down + closing
- —
- Monthly P&I
- —
- Monthly cashflow
- —
- DSCR
- —
- Eligible?
- —
Personal DTI + credit; lowest rate.
DSCR
20% down · 8.5% · 30yr
- Down + closing
- —
- Monthly P&I
- —
- Monthly cashflow
- —
- DSCR
- —
- Eligible?
- —
No personal income docs; deal must DSCR.
Hard money
10% down · 12.0% · 12mo
- Down + closing
- —
- Monthly P&I
- —
- Monthly cashflow
- —
- DSCR
- —
- Eligible?
- —
Short-term bridge; refi at stabilization.
HOA detail condo
- Monthly dues
- $100 · $1,200/yr
- Assessments
- None detected in remarks — confirm with the listing agent.
Listing history 6 events
-
2026-06-18days on market $398,000 Active 49 DOM
-
2026-06-17days on market $398,000 Active 48 DOM
-
2026-06-16days on market $398,000 Active 47 DOM
-
2026-06-15days on market $398,000 Active 46 DOM
-
2026-06-13remarks 461-char remark
-
2026-06-13$398,000 Active 44 DOM
ⓘ Source: listings_history table (triggers on properties + properties_extension) + one-shot
backfill from property_details.listing_events for pre-trigger history.
Tax reassessment forecast FL · Resets to sale price
- Current annual tax
- $6,657 · $555/mo
- Projected year-2 tax
- $6,657 · $555/mo
- Expected delta
- $0/yr ($0/mo · 0.0%)
ⓘ Screening estimate from a state-policy table — verify with the county assessor before closing.
Climate risk First Street
- Flood 1/10 Low FEMA zone X (unshaded) · 0% chance over 30 yrs
- Wildfire 1/10 Low
- Heat 10/10 Extreme 7 d/yr ≥103°F today · 26 d/yr by 30 yrs out
- Wind 10/10 Extreme 99% chance of damaging wind over 30 yrs
- Air quality 2/10 Low 1 unhealthy d/yr today · 2 by 30 yrs out
Nearby sold comps map
Loading sold comps map…
Walkable amenities ~0.75 mi
Loading nearby amenities…
Taxation est. · year 1
- Rental income
- $52,493
- − Mortgage interest
- −$22,294
- − Property taxes
- −$6,657
- − Insurance
- −$1,990
- − Repairs & maintenance
- −$4,199
- − Management
- −$4,199
- − HOA
- −$1,200
- − Depreciation
- −$11,578
- Taxable income
- $375
- Est. tax owed @ 24.0%
- −$90
- After-tax cash flow
- $6,487/yr
For passive investors: Depreciation is non-cash, so a rental often shows a tax loss while cash-flowing — sheltering income. Rental losses are passive: they offset passive income freely, and up to $25,000/yr can offset ordinary (W-2) income if you actively participate and your MAGI is under $100k (phasing out to $0 by $150k); unused losses carry forward. On sale, claimed depreciation is recaptured at up to 25%, and gains may owe capital-gains tax (a 1031 exchange can defer both). Figures are a year-1 estimate at your 24.0% rate — not tax advice; consult a CPA.
Schools (NCES district)
- District
- Miami-Dade
- NCES district ID
- 1200390
- Math proficiency
- 45% ▼ -16.00%
- Reading proficiency
- 54% ▼ -5.00%
- Median HH income
- $43,928
- Composite
- 41.76/100
- National rank
- #3397
- State rank
- #40 of 73 in FL
Livability — Sunny Isles Beach
- Score
- 86/100
- State rank
- #20
- US rank
- #434
Category grades
Schools grade is shown separately in the Schools card above.
Census & demographics
- Census place
- Sunny Isles Beach, FL
- County
- Miami-Dade County · 2,697,751 people
- Metro
- Miami-Fort Lauderdale-Pompano Beach, FL
- Population (ZIP)
- 43,718
- Household income
- $67,040
- Rent vs Own
- Severe rent burden
- 3106.0
Population outlook (Miami-Dade County) Hauer SSP2
- Today (2025)
- 3,126,439 people
- By 2030
- 3,325,765 · +6.4%
- By 2040
- 3,697,561 · +18.3%
- By 2050
- 4,012,134 · +28.3%
- By 2075
- 4,605,612 · +47.3%
- By 2100
- 4,866,598 · +55.7%
Race, ethnicity, and origin ACS 2023
- Neighborhood character
- Diverse neighborhood (Simpson 0.59)
- Race & ethnicity
- Hispanic / Latino 46% White 44% Two or more races 27% Black 4% Asian 2%
- Hispanic origin (detail)
- Mexican 1% Puerto Rican 3% Cuban 8% Dominican 1% Salvadoran 4%
- Common ancestry
- Scotch-Irish 8% Hispanic 3% Subsaharan African 3%
- Foreign-born
- 61% · Canada, Jamaica, Dominican Republic
- Languages at home
- 29% English-only · Spanish 45% Russian/Polish/Slavic 12% Other Indo-European 5%
Political lean MEDSL · Miami-Dade
- 2024 margin
- R (+11.4) · D 43.9% · R 55.4%
- 2008→2024 swing
- -27.6pp toward R · 2008: 16.1pp · 2024: -11.4pp
- All cycles
- 2024: R+11.4 2020: D+7.3 2016: D+29.6 2012: D+23.7 2008: D+16.1
Not yet ingested
- Civics
- —
Market trends
- HPI YoY
- ▲ 0.53%
- Current HPI
- 284.9293
- Rent YoY
- ▲ 0.94%
- Metro
- Miami-Fort Lauderdale-Pompano Beach, FL
- State GDP YoY
- ▲ 3.28%
- F500 in state
- 36
Industry mix (Fortune 500 HQ in FL)
| Industry | F500 HQs | Revenue |
|---|---|---|
| Industrial Technology | 2 | $29B |
|
||
| Insurance | 2 | $17B |
|
||
| Retail | 1 | $60B |
|
||
| Technology Distribution | 1 | $58B |
|
||
| Homebuilding | 1 | $35B |
|
||
| Technology Manufacturing | 1 | $35B |
|
||
Price history
-99.1% since first listed50 events — show timeline
- 2026-06-10 Relisted — MARMLS
- 2026-05-16 Relisted — MARMLS
- 2026-05-15 Listed for Rent $3,600 MARMLS
- 2026-05-08 Rental Removed $3,600 MARMLS
- 2026-05-08 Listed for Rent $3,600 MARMLS
- 2026-04-30 Relisted — MARMLS
- 2026-04-27 Rental Removed $3,600 MARMLS
- 2026-04-26 Listed for Rent $3,600 MARMLS
- 2026-04-15 Relisted — MARMLS
- 2026-03-31 Relisted — MARMLS
- 2026-03-19 Relisted — MARMLS
- 2026-03-02 Rental Removed $3,600 MARMLS
- 2026-03-02 Listed for Rent $3,600 MARMLS
- 2026-02-05 Rental Removed $3,600 MARMLS
- 2026-01-16 Listed $398,000 MARMLS
- 2026-01-01 Listed for Rent $3,600 MARMLS
- 2025-12-21 Rental Removed $3,600 MARMLS
- 2025-12-18 Listed for Rent $3,600 MARMLS
- 2025-11-26 Rental Removed $3,600 MARMLS
- 2025-11-03 Listed for Rent $3,600 MARMLS
- 2025-10-02 Rental Removed $3,600 MARMLS
- 2025-08-07 Listed for Rent $3,600 MARMLS
- 2024-10-21 Rental Removed $3,600 MARMLS
- 2024-09-13 Price Changed $3,600 MARMLS
- 2024-07-12 Price Changed $3,850 MARMLS
- 2024-07-03 Price Changed $3,950 MARMLS
- 2024-05-15 Price Changed $4,100 MARMLS
- 2024-03-19 Listed for Rent $4,500 MARMLS
- 2024-01-16 Rental Removed $4,500 MARMLS
- 2024-01-09 Listed for Rent $4,500 MARMLS
- 2024-01-01 Rental Removed $4,500 MARMLS
- 2023-12-21 Listed for Rent $4,500 MARMLS
- 2018-05-16 Listing Removed — MARMLS
- 2018-05-15 Listed $395,000 MARMLS
- 2017-09-28 Sold (Public Records) $395,500 Public Records
- 2017-09-26 Sold (MLS) $395,500 MARMLS
- 2017-08-28 Pending — MARMLS
- 2017-06-21 Price Changed $398,999 MARMLS
- 2017-05-08 Price Changed $399,000 MARMLS
- 2016-08-18 Price Changed $409,998 MARMLS
- 2015-12-08 Price Changed $409,999 MARMLS
- 2015-10-12 Listed $419,000 MARMLS
- 2014-01-14 Sold (MLS) $350,000 MARMLS
- 2014-01-13 Listing Removed — MARMLS
- 2013-12-30 Sold (Public Records) $350,000 Public Records
- 2013-11-27 Pending — MARMLS
- 2013-10-29 Relisted — MARMLS
- 2013-10-23 Pending — MARMLS
- 2013-10-01 Listed $365,000 MARMLS
- 2005-10-04 Sold (Public Records) $395,000 Public Records
Property tax history
+3.6%/yrLatest (2025): $6,657 · -0.7% YoY. Source: county tax records.
Cash-flow waterfall
monthlySold comps — $/sqft
last 12 mo · ≤1 miLoading sold comps…