 Duplex
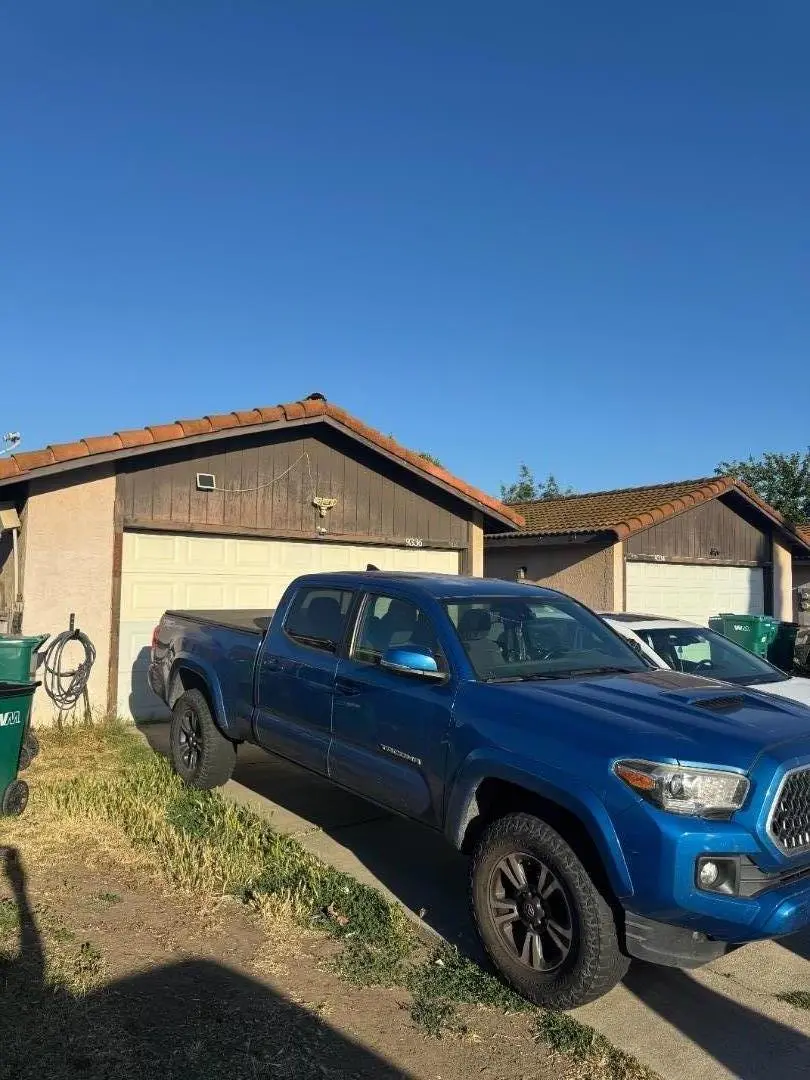
9334 Fox Creek Dr · Stockton, CA
Flood risk 1/10 · Minimal
- FEMA flood zone
- X
- Chance of flooding over 30 yrs
- 0.0%
- Est. flood insurance / yr
- $507 – $1,088
Fire risk 3/10 · Minor
- Est. fire insurance / yr
- $659 – $1,223
Heat risk 7/10 · Major
- Hot days now (above 102°F)
- 7 days/yr
- Hot days in 30 yrs
- 15 days/yr
Wind risk 1/10 · Minimal
- Chance of severe wind over 30 yrs
- —
Air-quality risk 10/10 · Severe
- Unhealthy air days now
- 30 days/yr
- Unhealthy air days in 30 yrs
- 30 days/yr
Risk factors via First Street. Map © Google.
Why this score? — see what drove the D+ grade
The composite is a weighted blend of 9 inputs, each scored 0–100. Each bar is that input's sub-score; the figure is the points it added to the 100-point composite (weight × sub-score).
- Cash flow +19.0/30.0
- ARV discount +7.5/15.0
- DSCR +6.0/10.0
- Rent growth +4.3/5.0
- 1% rule +3.7/10.0
- Livability +2.9/5.0
- Schools +2.7/10.0
- Condition / age +2.5/5.0
- Appreciation +0.0/10.0
$525,000
🖨 Deal sheet 📄 Offer letter ✓ Due diligence
Multi-family units
County records classify this as Multi-Family (2-4 Unit). Listing-text estimate: 2 units. confirmed
Listing remarks MLS
Rare North Stockton duplex 9334 & 9336 Fox Creek Drive is your next smart investment opportunity. Each unit offers 3 bedrooms, 2 full baths, and 1,118 sq ft of living space, for a total of 2,236 sq ft. Built in 1980, the property features attached 2-car garages, private backyards, and separate entrances for true tenant independence. Both units are occupied month-to-month at below-market rents; comparable units on the same street rent for $2,500/month, offering immediate upside to $5,000/month in gross rent. Sitting on a 6,132 sq ft lot, the stucco exterior and Spanish tile roof keep maintenance costs to a minimum. Current ownership has averaged just $1,500/year in maintenance since 2018, a truly passive-friendly asset. Located in Wagner Heights, North Stockton, with quick access to Hwy 99, Lodi Unified schools, parks, and shopping. Don't miss this turnkey income property with clear value-add rental upside in a stable North Stockton neighborhood.** 1,240 characters.** Under the limit with room to spare. Comparable sale 9419 & 9421 Fox Creek Dr. Sold in 3 days on the MLS and closed on 4-16-26 for $ 565,000,00. Here is a great opportunity for a buyer to live in one unit and rent out the other to pay some of the expenses.
Key facts
- Separate entrances
- Private backyards
- 6,213 sq ft lot
Tags
Property features AI
Finance
- Other: Primary meters for electric, gas, and water noted; City transfer tax applies
- Financial info: Annual rental income: $34,200; Annual gross income: $34,200; Gross scheduled income: $34,200; Gross rent multiplier: 15.35; Total expenses: $10,069; Tenant pays gas utilities; Trash expense: $916; Utility expenses: $3,216; Landscape expense: $1,200; Unit 1 rent: $1,450; Unit 2 rent: $1,400
Exterior
- Parking: Attached garage; On-street parking
- Security: Other security features (see remarks)
- Utilities: Primary electric, gas, and water meters; Sewer in street
- Home design: Duplex (2 units) in one building; Single-story; Individual ownership
- Construction: Wood frame construction; Concrete perimeter and slab foundation; Built as one building
- Exterior features: Tile roof; Fenced yard; Low-maintenance landscaping; Regular lot; R2 zoning; Security features (see remarks)
Interior
- Kitchen: 220V outlet; Electric cooktop; Formica countertops; Exhaust fan; Garbage disposal
- Bedrooms: Unit 1: 3 bedrooms; Unit 2: 3 bedrooms
- Flooring: Carpet; Vinyl/linoleum
- Bathrooms: Unit 1: 2 full bathrooms; Unit 2: 2 full bathrooms
- Heating & cooling: Central forced air heating (gas); Central forced air cooling; Ceiling fan
- Interior features: Additional room (see remarks); Washer and dryer included; Carpet and vinyl/linoleum flooring
- Laundry & utility: Washer and dryer; Individual electric meters; Individual gas meters; Individual water meter
Neighborhood map
What this means for you Summary
Snapshot
- This is a 2 × 3-bed/2.0-bath units multifamily listed at $525k.
Deal economics
- At list price, monthly cash flow is $550 ($7k/yr) — positive. Per door: $275/mo.
- The deal already cash-flows at list — no discount required.
- To meet the 1% rule (rent ≥ 1% of price), the offer needs to be $459k (12.5% below list).
- Recommended offer: $459k (12.5% below list) — sets the bar for 1% rule.
- Cap rate 7.6% vs local median 3.6% in Stockton — top-decile yield for the area; either an underpriced asset or a hidden risk that comps aren't pricing in. Stress-test before assuming the spread holds.
Location & tenants
- Location reads 57/100 on livability (#734 in CA) — a working-class tenant base; expect higher turnover. Strengths: housing A+, health & safety A, amenities A-; Watch: employment C-, schools D-, crime F.
- Lodi Unified (urban): math 24% / reading 36% proficiency, ranked #325 of 517 in CA (top 63%) — families likely to look elsewhere, expect single-tenant / working-renter base with shorter leases.
- Market conditions: Rents rising fast (+7.1%/yr); 102 active listings in the ZIP; 3,779 units permitted in San Joaquin County in 2024 (0 in 5+ unit buildings).
- At $4,592/mo this rent would consume 81% of the median local household income ($68k/yr) (locally 1817% of renters already pay >50% of income on rent) — very limited rent-growth headroom before tenants either downsize or default.
Forward outlook
- Local home prices are declining (-3.0%/yr); year-one equity from $4k of loan paydown is wiped out by about $16k of value loss. Plan a longer hold.
- San Joaquin County population projected at +17% by 2050 — long-run rental-demand tailwind backs the buy-and-hold thesis.
Negotiation context
- Only 10 days on market — expect competitive offers; lowballing is unlikely to land.
- 2 sale attempts with the ask held roughly flat each time — persistent listings suggest the price (not the market) is what's stuck; bring a comps-based counter.
- Current owner paid $440k; 19% above their basis — modest negotiation headroom, anchor on the comps not their cost.
Risks & watch-outs
- Climate carrying-cost: extreme-heat days projected 7→15/yr by 2055 (HVAC capex compounding) — expect insurance premiums to compound above CPI over the hold.
Questions for the listing agent
- Can we see the unit-by-unit rent roll, current vacancy, and any below-market leases? What's the average tenancy length?
- What capital expenditures (roof, boiler, parking lot, exteriors) have been made in the last 5 years, and what's planned in the next 2?
- Is there a deadline driving the sale (1031 exchange, divorce, estate, relocation)? That informs how much negotiation room exists.
- Schools are D-rated, which usually means shorter tenancies and higher turnover. Who's the typical renter profile here, and what's been the actual vacancy rate?
- Crime grade is F in this area — have there been break-ins, vandalism, or insurance claims at this property in the last 3 years? What carrier currently insures it and at what premium?
- The area grade is low — what's the realistic commute time and amenity access for the typical tenant pool here? Any planned neighborhood developments (good or bad) we should know about?
- What's the average days-on-market for RENTAL listings here right now (not sales)? A rising rental-DOM trend means longer vacancies and softer asking-rent achievability than the comps imply.
- What's the recent tenant-quality profile in this submarket — average credit score on applications, eviction rate, late-payment / NSF rate, and stable-employment percentage? A property-management company in the area should have these aggregated.
- How much new apartment / multifamily construction is in the pipeline within 1–3 miles? Heavy new supply (>2% of stock underway) typically softens rents 12–24 months out; light construction supports rent growth.
Investment metrics
- 1% rule
- 0.87% ✗
- Cap rate
- 7.55%
- Cash-on-cash
- 4.49%
- DSCR
- 1.20
- GRM
- 9.5
CMA / ARV
No comps found within radius.
Projected returns pro-forma
-3.0% appreciation · 7.09% rent growth · sell at horizon
- IRR
- -5.4%
- Equity multiple
- 0.79×
- Total profit
- $-30,613
- Equity at exit
- $78,279
- IRR
- 8.1%
- Equity multiple
- 1.72×
- Total profit
- $105,232
- Equity at exit
- $45,392
Cash invested: $147,000 (down + closing). Projections, not guarantees.
Landlord ↔ Tenant lean methodology
- Overall (STATE)
- 18 Strongly Tenant-Friendly
- State California
- 18 Strongly Tenant-Friendly · D+13
- County
- — inherits STATE
- City
- — inherits STATE
ZIP-level market 95210
- Rents YoY
- 7.1%
- Active inventory
- 102
- Price-to-rent
- 19.1×
Monthly cashflow live
- Estimated rent
- $4,592 high interval (Pro) →
- Mortgage (P&I)
- −$2,753
- Tax from tax record
- −$105 /mo · $1,265/yr
- Insurance
- −$219
- HOA
- −$0
- Vacancy / Maint / Mgmt
- −$964
- Net cashflow
- $550
Break-even live
2-unit breakdown (identical units grouped — click to expand)
| Units | Beds | Baths | Est. rent |
|---|---|---|---|
| 2× units | 3 | 2 | $4,592 |
| #1 | 3 | 2 | $2,296 |
| #2 | 3 | 2 | $2,296 |
| Total (2 units) | $4,592 | ||
UW: 25.0% down · 7.5% · 30yr · 1.5% tax · 5.0% vac · 8.0% maint · 8.0% mgmt
Financing live
Cash to close
- Down payment
- $131,250
- Closing costs
- $15,750
- Reserves months
- —
- Total cash needed
- —
Loan-product check · same deal, 3 products live
Conventional
25% down · 7.5% · 30yr
- Down + closing
- —
- Monthly P&I
- —
- Monthly cashflow
- —
- DSCR
- —
- Eligible?
- —
Personal DTI + credit; lowest rate.
DSCR
20% down · 8.5% · 30yr
- Down + closing
- —
- Monthly P&I
- —
- Monthly cashflow
- —
- DSCR
- —
- Eligible?
- —
No personal income docs; deal must DSCR.
Hard money
10% down · 12.0% · 12mo
- Down + closing
- —
- Monthly P&I
- —
- Monthly cashflow
- —
- DSCR
- —
- Eligible?
- —
Short-term bridge; refi at stabilization.
Listing history 8 events
-
2026-06-18days on market $525,000 Active 10 DOM
-
2026-06-17days on market $525,000 Active 9 DOM
-
2026-06-16days on market $525,000 Active 8 DOM
-
2026-06-15days on market $525,000 Active 7 DOM
-
2026-06-14days on market $525,000 Active 5 DOM
-
2026-06-10days on market $525,000 Active 2 DOM
-
2026-06-09remarks 695-char remark
-
2026-06-09$525,000 Active 1 DOM
ⓘ Source: listings_history table (triggers on properties + properties_extension) + one-shot
backfill from property_details.listing_events for pre-trigger history.
Tax reassessment forecast CA · Resets to sale price
- Current annual tax
- $1,265 · $105/mo
- Projected year-2 tax
- $3,990 · $332/mo
- Expected delta
- +$2,725/yr (+$227/mo · 215.5%)
ⓘ Screening estimate from a state-policy table — verify with the county assessor before closing.
Climate risk First Street
- Flood 1/10 Low FEMA zone X · 0% chance over 30 yrs
- Wildfire 3/10 Moderate
- Heat 7/10 Severe 7 d/yr ≥102°F today · 15 d/yr by 30 yrs out
- Wind 1/10 Low
- Air quality 10/10 Extreme 30 unhealthy d/yr today · 30 by 30 yrs out
Nearby sold comps map
Loading sold comps map…
Walkable amenities ~0.75 mi
Loading nearby amenities…
Taxation est. · year 1
- Rental income
- $55,104
- − Mortgage interest
- −$29,408
- − Property taxes
- −$1,265
- − Insurance
- −$2,625
- − Repairs & maintenance
- −$4,408
- − Management
- −$4,408
- − Depreciation
- −$15,273
- Taxable loss
- −$2,283
- Est. tax savings @ 24.0%
- +$548
- After-tax cash flow
- $7,153/yr
For passive investors: Depreciation is non-cash, so a rental often shows a tax loss while cash-flowing — sheltering income. Rental losses are passive: they offset passive income freely, and up to $25,000/yr can offset ordinary (W-2) income if you actively participate and your MAGI is under $100k (phasing out to $0 by $150k); unused losses carry forward. On sale, claimed depreciation is recaptured at up to 25%, and gains may owe capital-gains tax (a 1031 exchange can defer both). Figures are a year-1 estimate at your 24.0% rate — not tax advice; consult a CPA.
Schools (NCES district)
- District
- Lodi Unified
- NCES district ID
- 0622230
- Math proficiency
- 24% ▼ -8.00%
- Reading proficiency
- 36% ▼ -8.00%
- Median HH income
- $57,165
- Composite
- 26.84/100
- National rank
- #7108
- State rank
- #325 of 517 in CA
Livability — Stockton
- Score
- 57/100
- State rank
- #734
- US rank
- #21638
Category grades
Schools grade is shown separately in the Schools card above.
Census & demographics
- Census place
- Stockton, CA
- County
- San Joaquin County · 729,570 people
- City population
- 332,006
- Metro
- Stockton, CA
- Population (ZIP)
- 41,549
- Household income
- $67,991
- Rent vs Own
- Severe rent burden
- 1817.0
Population outlook (San Joaquin County) Hauer SSP2
- Today (2025)
- 796,965 people
- By 2030
- 828,849 · +4.0%
- By 2040
- 885,611 · +11.1%
- By 2050
- 929,798 · +16.7%
- By 2075
- 994,578 · +24.8%
- By 2100
- 971,291 · +21.9%
Race, ethnicity, and origin ACS 2023
- Neighborhood character
- Highly diverse neighborhood (Simpson 0.73)
- Race & ethnicity
- Hispanic / Latino 38% Asian 31% Two or more races 21% White 13% Black 11% Pacific Islander 1%
- Hispanic origin (detail)
- Mexican 34%
- Common ancestry
- Italian 1% Russian 1%
- Foreign-born
- 27% · Canada, Vietnam, China
- Languages at home
- 49% English-only · Spanish 25% Other Asian/Pacific 12% Other Indo-European 6%
Political lean MEDSL · San Joaquin
- 2024 margin
- Toss-up / Even · D 48.0% · R 48.9% · Other 3.0%
- 2008→2024 swing
- -11.6pp toward R · 2008: 10.7pp · 2024: -0.9pp
- All cycles
- 2024: R+0.9 2020: D+13.9 2016: D+12.9 2012: D+8.9 2008: D+10.7
Not yet ingested
- Civics
- —
Market trends
- HPI YoY
- ▼ -283.31%
- Current HPI
- 349.495
- Rent YoY
- ▲ 7.09%
- Metro
- Stockton, CA
- State GDP YoY
- ▲ 3.21%
- F500 in state
- 116
Industry mix (Fortune 500 HQ in CA)
| Industry | F500 HQs | Revenue |
|---|---|---|
| Technology | 27 | $1,492B |
|
||
| Financial Services | 3 | $174B |
|
||
| Retail | 3 | $44B |
|
||
| Insurance | 3 | $26B |
|
||
| Media / Entertainment | 2 | $115B |
|
||
| Pharmaceuticals / Biotech | 2 | $62B |
|
||
Price history
+480.1% since first listed8 events — show timeline
- 2026-06-08 Listed $525,000 MLSListings
- 2026-06-08 Listed $525,000 bridgeMLS, Bay East AOR, or Contra Costa AOR
- 2006-10-02 Sold (Public Records) $440,000 Public Records
- 1996-06-24 Sold (Public Records) $83,000 Public Records
- 1996-06-24 Sold (Public Records) $83,000 Public Records
- 1992-09-18 Sold (Public Records) $125,000 Public Records
- 1992-09-18 Sold (Public Records) $125,000 Public Records
- 1988-03-25 Sold (Public Records) $90,500 Public Records
Property tax history
-7.8%/yrLatest (2025): $1,265 · +1.9% YoY. Source: county tax records.
Cash-flow waterfall
monthlySold comps — $/sqft
last 12 mo · ≤1 miLoading sold comps…