 10-Plex
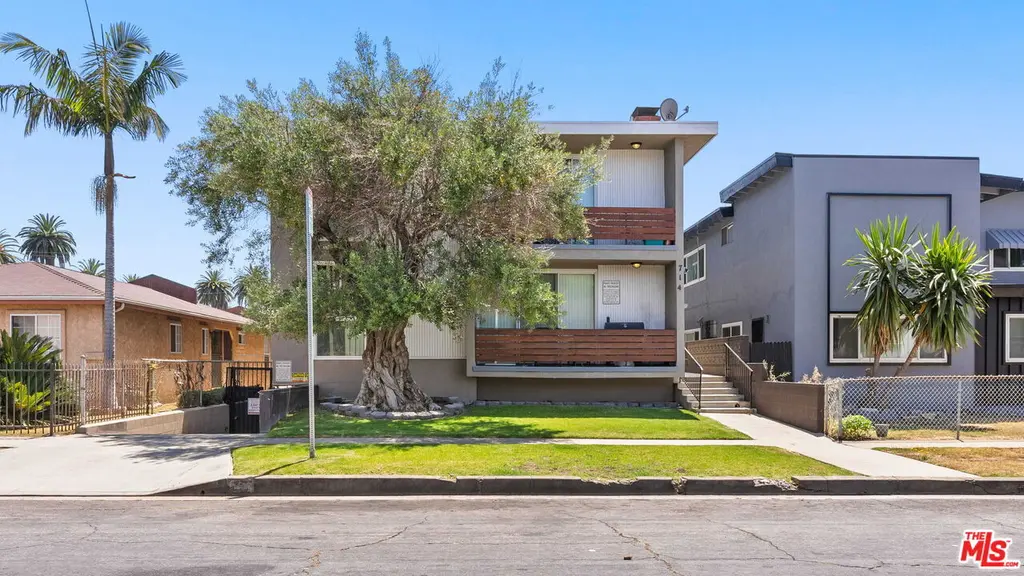
714 Myrtle Ave · Inglewood, CA
Flood risk 1/10 · Minimal
- FEMA flood zone
- X (unshaded)
- Chance of flooding over 30 yrs
- 0.0%
- Est. flood insurance / yr
- $507 – $1,088
Fire risk 1/10 · Minimal
- Est. fire insurance / yr
- $659 – $1,223
Heat risk 5/10 · Moderate
- Hot days now (above 86°F)
- 7 days/yr
- Hot days in 30 yrs
- 21 days/yr
Wind risk 1/10 · Minimal
- Chance of severe wind over 30 yrs
- —
Air-quality risk 5/10 · Moderate
- Unhealthy air days now
- 7 days/yr
- Unhealthy air days in 30 yrs
- 7 days/yr
Risk factors via First Street. Map © Google.
Why this score? — see what drove the D+ grade
The composite is a weighted blend of 9 inputs, each scored 0–100. Each bar is that input's sub-score; the figure is the points it added to the 100-point composite (weight × sub-score).
- Cash flow +25.2/30.0
- DSCR +8.3/10.0
- 1% rule +6.2/10.0
- Livability +3.2/5.0
- Rent growth +2.5/5.0
- Condition / age +2.5/5.0
- Schools +1.8/10.0
- ARV discount +0.0/15.0
- Appreciation +0.0/10.0
$3,100,000
🖨 Deal sheet (PDF) 📄 Offer letter ✓ Due diligence
Multi-family units
County records classify this as Multi-Family (5+ Unit). Listing-text estimate: 10 units. confirmed
5+ unit building — per-unit beds/baths from public records are typically unavailable; the breakdown below (if shown) is an estimate from the listing text.
Listing remarks MLS
We are pleased to present 714 Myrtle Ave, a rare turnkey investment opportunity located in the heart of Inglewood's thriving SoFi Stadium district - one of the most rapidly appreciating rental markets in Los Angeles. The 10-unit property has undergone significant upgrades, with 9 of the 10 units already renovated, offering investors strong in-place income with minimal deferred maintenance and the ability to capture additional upside through the remaining unit. The asset features an exceptional unit mix with large, well-designed floor plans averaging approximately 960 square feet, providing a competitive advantage in attracting and retaining quality tenants. Interior renovations include modern finishes such as quartz countertops, stainless steel appliances, and dishwashers, aligning the property with today's renter expectations and supporting premium rental rates. Positioned near major entertainment, employment, and retail hubs, 714 Myrtle Ave offers a compelling combination of stability, quality, and long-term appreciation potential in one of Southern California's most dynamic growth corridors. For more information, please reach out.
Key facts
- 9 units renovated
- Large floor plans
- Significant upgrades
Tags
Neighborhood map
What this means for you Summary
Snapshot
- This is a 10 × 18-bed/16.0-bath units multifamily listed at $3.10M.
Deal economics
- At list price, monthly cash flow is $7k ($83k/yr) — positive. Per door: $695/mo.
- The deal already cash-flows at list — no discount required.
- Meets the 1% rule at list price ($35k rent vs $3.10M).
- Recommended offer: $2.91M (6.0% below list) — sets the bar for market timing.
- Cap rate 9.0% vs local median 2.6% in Inglewood — top-decile yield for the area; either an underpriced asset or a hidden risk that comps aren't pricing in. Stress-test before assuming the spread holds.
Location & tenants
- Location reads 64/100 on livability (#431 in CA) — a middle-class / working-renter tenant base. Strengths: commute A+, housing B; Watch: health & safety C-, schools D, crime F.
- Inglewood Unified (suburban): math 14% / reading 27% proficiency, ranked #457 of 517 in CA (top 88%) — low school quality limits family demand, transient renter base, plan for 1-2y turnover; 74% free/reduced lunch — lower-income household profile, screen leases tightly.
- Market conditions: Rents soft (-0.0%/yr); 43 active listings in the ZIP; 19,697 units permitted in Los Angeles County in 2024 (9,426 in 5+ unit buildings).
- At $34,650/mo this rent would consume 632% of the median local household income ($66k/yr) (locally 3084% of renters already pay >50% of income on rent) — very limited rent-growth headroom before tenants either downsize or default.
Forward outlook
- Local home prices are declining (-3.0%/yr); year-one equity from $21k of loan paydown is wiped out by about $93k of value loss. Plan a longer hold.
- Los Angeles County population projected at +9% by 2050 — modest demand growth; plan on rents tracking national, not racing it.
Negotiation context
- It's been on market 64 days — a 6% lower offer ($2.91M) is reasonable based on typical stale-listing flexibility.
- 5 sale attempts since 9y ago with the ask held roughly flat each time — persistent listings suggest the price (not the market) is what's stuck; bring a comps-based counter.
- Current owner paid $2.10M; 48% above their basis — modest negotiation headroom, anchor on the comps not their cost.
Risks & watch-outs
- Climate carrying-cost: extreme-heat days projected 7→21/yr by 2055 (HVAC capex compounding) — expect insurance premiums to compound above CPI over the hold.
Questions for the listing agent
- It's been on market 64 days. Have you received any prior offers? Is the seller open to a 6% concession, seller financing, or rate buy-down credit?
- Can we see the unit-by-unit rent roll, current vacancy, and any below-market leases? What's the average tenancy length?
- What capital expenditures (roof, boiler, parking lot, exteriors) have been made in the last 5 years, and what's planned in the next 2?
- Built in 1964 — when were the roof, HVAC, electrical panel, plumbing, and water heater last replaced?
- Why hasn't it sold? Are there any deal-killer items the seller is aware of (foundation, flood, title, zoning, code violations)?
- Is there a deadline driving the sale (1031 exchange, divorce, estate, relocation)? That informs how much negotiation room exists.
- Schools are D-rated, which usually means shorter tenancies and higher turnover. Who's the typical renter profile here, and what's been the actual vacancy rate?
- Crime grade is F in this area — have there been break-ins, vandalism, or insurance claims at this property in the last 3 years? What carrier currently insures it and at what premium?
- The area grade is low — what's the realistic commute time and amenity access for the typical tenant pool here? Any planned neighborhood developments (good or bad) we should know about?
- What's the average days-on-market for RENTAL listings here right now (not sales)? A rising rental-DOM trend means longer vacancies and softer asking-rent achievability than the comps imply.
- What's the recent tenant-quality profile in this submarket — average credit score on applications, eviction rate, late-payment / NSF rate, and stable-employment percentage? A property-management company in the area should have these aggregated.
- How much new apartment / multifamily construction is in the pipeline within 1–3 miles? Heavy new supply (>2% of stock underway) typically softens rents 12–24 months out; light construction supports rent growth.
Investment metrics
- 1% rule
- 1.12% ✓
- Cap rate
- 8.98%
- Cash-on-cash
- 9.60%
- DSCR
- 1.43
- GRM
- 7.5
CMA / ARV
- ARV (median comp)
- $2,447,665
- List price
- $3,100,000
- Delta
- 26.65%
- Verdict
- OVERPRICED
- Comps
- 18 within 1.0 mi
Projected returns pro-forma
-3.0% appreciation · 0.0% rent growth · sell at horizon
- IRR
- -5.2%
- Equity multiple
- 0.81×
- Total profit
- $-161,608
- Equity at exit
- $462,220
- IRR
- 0.7%
- Equity multiple
- 1.04×
- Total profit
- $36,089
- Equity at exit
- $268,031
Cash invested: $868,000 (down + closing). Projections, not guarantees.
Landlord ↔ Tenant lean methodology
- Overall (STATE)
- 18 Strongly Tenant-Friendly
- State California
- 18 Strongly Tenant-Friendly · D+13
- County
- — inherits STATE
- City
- — inherits STATE
ZIP-level market 90301
- Rents YoY
- -0.0%
- Active inventory
- 43
- Price-to-rent
- 74.6×
Monthly cashflow live
- Estimated rent
- $34,650 medium interval (Pro) →
- Mortgage (P&I)
- −$16,257
- Tax from tax record
- −$2,880 /mo · $34,556/yr
- Insurance
- −$1,292
- HOA
- −$0
- Vacancy / Maint / Mgmt
- −$7,276
- Net cashflow
- $6,945
Break-even live
Sensitivity live
| Price | -10% $8,700 | -5% $7,823 | +0% $6,945 | +5% $6,068 | +10% $5,191 |
|---|---|---|---|---|---|
| Rent | -10% $4,208 | -5% $5,577 | +0% $6,945 | +5% $8,314 | +10% $9,683 |
| Rate | -1.0pp $8,507 | -0.5pp $7,734 | base $6,945 | +0.5pp $6,142 | +1.0pp $5,325 |
10-unit breakdown (identical units grouped — click to expand)
| Units | Beds | Baths | Est. rent |
|---|---|---|---|
| 10× units | 18 | 16 | $34,650 |
| #1 | 18 | 16 | $3,465 |
| #2 | 18 | 16 | $3,465 |
| #3 | 18 | 16 | $3,465 |
| #4 | 18 | 16 | $3,465 |
| #5 | 18 | 16 | $3,465 |
| #6 | 18 | 16 | $3,465 |
| #7 | 18 | 16 | $3,465 |
| #8 | 18 | 16 | $3,465 |
| #9 | 18 | 16 | $3,465 |
| #10 | 18 | 16 | $3,465 |
| Total (10 units) | $34,650 | ||
UW: 25.0% down · 7.5% · 30yr · 1.5% tax · 5.0% vac · 8.0% maint · 8.0% mgmt
Financing live
Cash to close
- Down payment
- $775,000
- Closing costs
- $93,000
- Reserves months
- —
- Total cash needed
- —
Loan-product check · same deal, 3 products live
Conventional
25% down · 7.5% · 30yr
- Down + closing
- —
- Monthly P&I
- —
- Monthly cashflow
- —
- DSCR
- —
- Eligible?
- —
Personal DTI + credit; lowest rate.
DSCR
20% down · 8.5% · 30yr
- Down + closing
- —
- Monthly P&I
- —
- Monthly cashflow
- —
- DSCR
- —
- Eligible?
- —
No personal income docs; deal must DSCR.
Hard money
10% down · 12.0% · 12mo
- Down + closing
- —
- Monthly P&I
- —
- Monthly cashflow
- —
- DSCR
- —
- Eligible?
- —
Short-term bridge; refi at stabilization.
Listing history 26 events
-
2026-06-18days on market $3,100,000 Active 64 DOM
-
2026-06-17days on market $3,100,000 Active 63 DOM
-
2026-06-16days on market $3,100,000 Active 62 DOM
-
2026-06-15days on market $3,100,000 Active 61 DOM
-
2026-06-13days on market $3,100,000 Active 59 DOM
-
2026-06-13days on market $3,100,000 Active 58 DOM
-
2026-06-09days on market $3,100,000 Active 55 DOM
-
2026-06-08days on market $3,100,000 Active 54 DOM
-
2026-06-07days on market $3,100,000 Active 53 DOM
-
2026-06-04days on market $3,100,000 Active 50 DOM
-
2026-06-03days on market $3,100,000 Active 49 DOM
-
2026-06-02days on market $3,100,000 Active 48 DOM
-
2026-06-01days on market $3,100,000 Active 47 DOM
-
2026-05-31days on market $3,100,000 Active 46 DOM
-
2026-04-13$3,100,000 Active 1151-char remark
Show marketing remark (1151 chars)
We are pleased to present 714 Myrtle Ave, a rare turnkey investment opportunity located in the heart of Inglewood's thriving SoFi Stadium district - one of the most rapidly appreciating rental markets in Los Angeles. The 10-unit property has undergone significant upgrades, with 9 of the 10 units already renovated, offering investors strong in-place income with minimal deferred maintenance and the ability to capture additional upside through the remaining unit. The asset features an exceptional unit mix with large, well-designed floor plans averaging approximately 960 square feet, providing a competitive advantage in attracting and retaining quality tenants. Interior renovations include modern finishes such as quartz countertops, stainless steel appliances, and dishwashers, aligning the property with today's renter expectations and supporting premium rental rates. Positioned near major entertainment, employment, and retail hubs, 714 Myrtle Ave offers a compelling combination of stability, quality, and long-term appreciation potential in one of Southern California's most dynamic growth corridors. For more information, please reach out.
-
2024-03-15price
-
2024-03-14status Active
-
2023-08-17Active
-
2017-06-22soldstatus $2,100,000
-
2017-06-20soldstatus $2,100,000
-
2017-06-20soldstatus $2,100,000 Closed Sale
-
2017-04-06status Pending Sale
-
2017-01-30historical Active Under Contract
-
2017-01-28$2,100,000 Active
-
2017-01-27$2,100,000
-
1983-07-15soldstatus $77,000
ⓘ Source: listings_history table (triggers on properties + properties_extension) + one-shot
backfill from property_details.listing_events for pre-trigger history.
Tax reassessment forecast CA · Resets to sale price
- Current annual tax
- $34,556 · $2,880/mo
- Projected year-2 tax
- $34,556 · $2,880/mo
- Expected delta
- $0/yr ($0/mo · 0.0%)
ⓘ Screening estimate from a state-policy table — verify with the county assessor before closing.
Climate risk First Street
- Flood 1/10 Low FEMA zone X (unshaded) · 0% chance over 30 yrs
- Wildfire 1/10 Low
- Heat 5/10 Major 7 d/yr ≥86°F today · 21 d/yr by 30 yrs out
- Wind 1/10 Low
- Air quality 5/10 Major 7 unhealthy d/yr today · 7 by 30 yrs out
Nearby sold comps map
Loading sold comps map…
Walkable amenities ~0.75 mi
Loading nearby amenities…
Taxation est. · year 1
- Rental income
- $415,800
- − Mortgage interest
- −$173,648
- − Property taxes
- −$34,556
- − Insurance
- −$15,500
- − Repairs & maintenance
- −$33,264
- − Management
- −$33,264
- − Depreciation
- −$90,182
- Taxable income
- $35,386
- Est. tax owed @ 24.0%
- −$8,493
- After-tax cash flow
- $74,853/yr
For passive investors: Depreciation is non-cash, so a rental often shows a tax loss while cash-flowing — sheltering income. Rental losses are passive: they offset passive income freely, and up to $25,000/yr can offset ordinary (W-2) income if you actively participate and your MAGI is under $100k (phasing out to $0 by $150k); unused losses carry forward. On sale, claimed depreciation is recaptured at up to 25%, and gains may owe capital-gains tax (a 1031 exchange can defer both). Figures are a year-1 estimate at your 24.0% rate — not tax advice; consult a CPA.
Schools (NCES district)
- District
- Inglewood Unified
- NCES district ID
- 0618390
- Math proficiency
- 14% ▼ -5.00%
- Reading proficiency
- 27% ▼ -3.00%
- Median HH income
- $46,746
- Composite
- 17.97/100
- National rank
- #8987
- State rank
- #457 of 517 in CA
Livability — Inglewood
- Score
- 64/100
- State rank
- #431
- US rank
- #14599
Category grades
Schools grade is shown separately in the Schools card above.
Census & demographics
- Census place
- Inglewood, CA
- County
- Los Angeles County · 9,444,647 people
- City population
- 127,928
- Metro
- Los Angeles-Long Beach-Anaheim, CA
- Population (ZIP)
- 36,060
- Household income
- $65,806
- Rent vs Own
- Severe rent burden
- 3084.0
Population outlook (Los Angeles County) Hauer SSP2
- Today (2025)
- 10,940,515 people
- By 2030
- 11,256,481 · +2.9%
- By 2040
- 11,729,929 · +7.2%
- By 2050
- 11,948,407 · +9.2%
- By 2075
- 11,818,114 · +8.0%
- By 2100
- 10,842,928 · -0.9%
Race, ethnicity, and origin ACS 2023
- Neighborhood character
- Diverse neighborhood (Simpson 0.58)
- Race & ethnicity
- Hispanic / Latino 57% Black 30% Two or more races 17% White 6% Asian 3% Native American 1%
- Hispanic origin (detail)
- Mexican 43%
- Common ancestry
- Lithuanian 1% British 1% Hispanic 1%
- Foreign-born
- 34% · Canada
- Languages at home
- 41% English-only · Spanish 50% Other Asian/Pacific 1% French/Haitian/Cajun 1%
Political lean MEDSL · Los Angeles
- 2024 margin
- Solid D (+32.9) · D 64.8% · R 31.9% · Other 3.3%
- 2008→2024 swing
- -7.4pp toward R · 2008: 40.4pp · 2024: 32.9pp
- All cycles
- 2024: D+32.9 2020: D+44.2 2016: D+48.0 2012: D+40.0 2008: D+40.4
Not yet ingested
- Civics
- —
Market trends
- HPI YoY
- ▼ -393.54%
- Current HPI
- 532.3738
- Rent YoY
- ▬ -0.01%
- Metro
- Los Angeles-Long Beach-Anaheim, CA
- State GDP YoY
- ▲ 3.21%
- F500 in state
- 116
Industry mix (Fortune 500 HQ in CA)
| Industry | F500 HQs | Revenue |
|---|---|---|
| Technology | 27 | $1,492B |
|
||
| Financial Services | 3 | $174B |
|
||
| Retail | 3 | $44B |
|
||
| Insurance | 3 | $26B |
|
||
| Media / Entertainment | 2 | $115B |
|
||
| Pharmaceuticals / Biotech | 2 | $62B |
|
||
Price history
+3926.0% since first listed12 events — show timeline
- 2026-04-13 Listed $3,100,000 TheMLS
- 2024-03-15 Price Changed — TheMLS
- 2024-03-14 Relisted — TheMLS
- 2023-08-17 Listed — TheMLS
- 2017-06-22 Sold (Public Records) $2,100,000 Public Records
- 2017-06-20 Sold (MLS) $2,100,000 CRMLS
- 2017-06-20 Sold (MLS) $2,100,000 SDMLS
- 2017-04-06 Pending — CRMLS
- 2017-01-30 Contingent — CRMLS
- 2017-01-28 Listed $2,100,000 CRMLS
- 2017-01-27 Listed $2,100,000 SDMLS
- 1983-07-15 Sold (Public Records) $77,000 Public Records
Property tax history
+8.3%/yrLatest (2025): $34,556 · +7.5% YoY. Source: county tax records.
Cash-flow waterfall
monthlySold comps — $/sqft
last 12 mo · ≤1 miLoading sold comps…