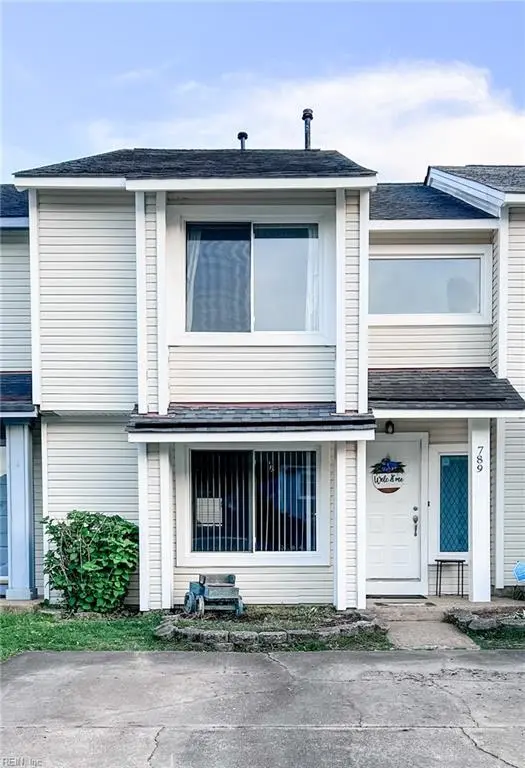
789 Quesnel Dr · Virginia Beach, VA
Flood risk 4/10 · Minor
- FEMA flood zone
- X (unshaded)
- Chance of flooding over 30 yrs
- 0.13%
- Est. flood insurance / yr
- $507 – $1,088
Fire risk 4/10 · Minor
- Est. fire insurance / yr
- $666 – $1,236
Heat risk 9/10 · Severe
- Hot days now (above 102°F)
- 7 days/yr
- Hot days in 30 yrs
- 18 days/yr
Wind risk 8/10 · Major
- Chance of severe wind over 30 yrs
- 99.0%
Air-quality risk 2/10 · Minimal
- Unhealthy air days now
- 1 days/yr
- Unhealthy air days in 30 yrs
- 2 days/yr
Risk factors via First Street. Map © Google.
Why this score? — see what drove the D grade
The composite is a weighted blend of 9 inputs, each scored 0–100. Each bar is that input's sub-score; the figure is the points it added to the 100-point composite (weight × sub-score).
- Cash flow +11.9/30.0
- ARV discount +7.5/15.0
- Schools +6.4/10.0
- Rent growth +4.2/5.0
- Livability +4.2/5.0
- DSCR +3.5/10.0
- 1% rule +2.8/10.0
- Condition / age +2.5/5.0
- Appreciation +0.0/10.0
$338,900
🖨 Deal sheet (PDF) 📄 Offer letter ✓ Due diligence
Listing remarks
Welcome to this beautifully maintained townhome in sought-after Ocean Lakes! This 3-bed, 2.1-bath home features a great open floor plan with spacious living areas. The updated kitchen shines & features a GAS stove and stainless appliances. Enjoy cozy evenings by the wood-burning fireplace or unwind in a warm, inviting atmosphere. Fenced backyard with attached storage—providing that added storage convenience. The exterior has been freshly cleaned, and the home is ideally located just minutes from shopping, dining, and the best of coastal living.
Key facts
- Open floor plan
- Gas stove
- Updated kitchen
Tags
Property features AI
Finance
- HOA & community: Has HOA (Ocean Lakes Homeowners Association); HOA dues $35 monthly
Exterior
- Parking: Driveway parking spaces
- Utilities: City/County water; City/County sewer; Gas water heater; Natural gas
- Home design: Attached property; Transitional style; 2 stories; 2 living levels; Simple ownership
- Construction: Vinyl siding; Asphalt shingle roof; Slab foundation
- Exterior features: Back yard fenced; Playgrounds (community); Pool (community); Tennis courts (community)
Interior
- Kitchen: Gas range; Refrigerator; Dishwasher; Breakfast area
- Bedrooms: 1 bedroom with ensuite; Master bedroom with bath
- Flooring: Carpet; Ceramic; Laminate
- Bathrooms: 2 full bathrooms; 1 half bathroom
- Heating & cooling: Natural gas heating; Central air conditioning
- Interior features: Ceiling fan; Wood-burning fireplace
- Laundry & utility: Washer hookup; Dryer hookup; Utility closet
Neighborhood map
What this means for you Summary
Snapshot
- This is a 3-bed/2.5-bath townhouse listed at $339k.
Deal economics
- At list price, monthly cash flow is $-90 ($-1k/yr) — negative.
- To cash-flow at today's rent, offer at most $323k (4.7% below list).
- To meet the 1% rule (rent ≥ 1% of price), the offer needs to be $265k (21.7% below list).
- Recommended offer: $265k (21.7% below list) — sets the bar for 1% rule.
- Cap rate 6.0% vs local median 3.5% in Virginia Beach — top-decile yield for the area; either an underpriced asset or a hidden risk that comps aren't pricing in. Stress-test before assuming the spread holds.
Location & tenants
- Location reads 83/100 on livability (#38 in VA, #880 nationally) — a professional / high-income tenant draw. Strengths: amenities A+, employment A+, housing A+; Watch: cost of living C-, commute F.
- Va Beach City Public School District (urban): math 69% / reading 78% proficiency, ranked #10 of 131 in VA (top 8%) — strong family-tenant draw, lease renewals of 3-5y typical.
- Zoned schools: Ocean Lakes Elementary (math 68% / reading 76%, grade A-, #273 of 1,108 statewide, top 27%, 571 students, 31% FRL); Corporate Landing Middle (math 66% / reading 77%, grade A, #72 of 342 statewide, top 22%, 1,054 students, 46% FRL); Ocean Lakes High (math 73% / reading 89%, grade A, #52 of 319 statewide, top 17%, 1,855 students, 29% FRL).
- Market conditions: Rents rising fast (+6.6%/yr); 209 active listings in the ZIP; 19 comparable units currently listed for rent nearby; rentals at typical pace (median 22d on market — plan ~3-4 weeks tenant-placement turnaround); solid renter incomes; 666 units permitted in Virginia Beach city in 2024 (347 in 5+ unit buildings).
- This rent runs 31% of the median local income ($103k/yr) — at the standard rent-burdened threshold; future hikes will face affordability resistance.
Forward outlook
- Local home prices are declining (-3.0%/yr); year-one equity from $2k of loan paydown is wiped out by about $10k of value loss. Plan a longer hold.
- Virginia Beach County population projected at +6% by 2050 — modest demand growth; plan on rents tracking national, not racing it.
Negotiation context
- It's been on market 53 days — a 3% lower offer ($329k) is reasonable based on typical stale-listing flexibility.
- 3 sale attempts since 8y ago with the ask held roughly flat each time — persistent listings suggest the price (not the market) is what's stuck; bring a comps-based counter.
- Current owner paid $185k; list at $339k implies a 83% gain — meaningful room to come down on a strong offer.
Risks & watch-outs
- Climate carrying-cost: severe wind risk, 99% chance of damaging wind over 30y; extreme-heat days projected 7→18/yr by 2055 (HVAC capex compounding) — expect insurance premiums to compound above CPI over the hold.
Questions for the listing agent
- What do current leases actually rent for vs. the listed asking? Can we see a recent rent roll and the last 12 months of T-12 income?
- It's been on market 53 days. Have you received any prior offers? Is the seller open to a 22% concession, seller financing, or rate buy-down credit?
- What does the HOA fee cover, when was the last increase, and are there any pending special assessments or reserve-fund shortfalls?
- Is there a deadline driving the sale (1031 exchange, divorce, estate, relocation)? That informs how much negotiation room exists.
- Schools are A-rated — typically a magnet for longer-tenancy family renters. What's the average tenant stay here, and is there a school-zone premium baked into asking?
- The area grade is low — what's the realistic commute time and amenity access for the typical tenant pool here? Any planned neighborhood developments (good or bad) we should know about?
- What's the average days-on-market for RENTAL listings here right now (not sales)? A rising rental-DOM trend means longer vacancies and softer asking-rent achievability than the comps imply.
- What's the recent tenant-quality profile in this submarket — average credit score on applications, eviction rate, late-payment / NSF rate, and stable-employment percentage? A property-management company in the area should have these aggregated.
- How much new for-sale + rental construction is in the pipeline within 1–3 miles? Heavy new supply typically softens prices + rents 12–24 months out; constrained supply supports both.
Investment metrics
- 1% rule
- 0.78% ✗
- Cap rate
- 5.98%
- Cash-on-cash
- -1.13%
- DSCR
- 0.95
- GRM
- 10.6
CMA / ARV
- ARV (on-the-fly)
- $339,020
- Comps found
- 12
Show comp detail 12 sales within ~0.75 mi
| Address | Dist | Beds/Ba | Sqft | Sold | Price | $/sf | Match |
|---|---|---|---|---|---|---|---|
| 1635 Mantane Arch | 0.19mi | 3/2.5 | 1,544 (+0%) | 4mo | $280,000 | $181 | 88 |
| 1648 Sword Dancer Dr | 0.26mi | 3/2.5 | 1,544 (+0%) | 0mo | $270,000 | $175 | 87 |
| 1614 Sword Dancer Dr | 0.19mi | 3/2.5 | 1,560 (+1%) | 3mo | $350,000 | $224 | 87 |
| 740 Quesnel Dr | 0.08mi | 3/2.5 | 1,427 (-7%) | 1mo | $329,500 | $231 | 83 |
| 798 Quesnel Dr | 0.03mi | 3/2.5 | 1,696 (+10%) | 1mo | $362,000 | $213 | 81 |
| 776 Goodard Dr | 0.17mi | 3/2.5 | 1,428 (-7%) | 2mo | $315,000 | $221 | 78 |
| 1623 Slidell Ln | 0.08mi | 3/2.5 | 1,692 (+10%) | 3mo | $345,000 | $204 | 78 |
| 725 Hecate Dr | 0.13mi | 3/2.5 | 1,696 (+10%) | 1mo | $372,500 | $220 | 77 |
| 1531 Sword Dancer Dr | 0.19mi | 3/2.5 | 1,692 (+10%) | 2mo | $345,000 | $204 | 73 |
| 736 Hecate Dr | 0.11mi | 2/2.5 (-1) | 1,389 (-10%) | 1mo | $300,000 | $216 | 73 |
| 1563 Sword Dancer Dr | 0.11mi | 2/2.5 (-1) | 1,400 (-9%) | 2mo | $325,000 | $232 | 73 |
| 1702 Purchase Arch | 0.22mi | 2/2.5 (-1) | 1,312 (-15%) | 1mo | $299,900 | $229 | 59 |
Match score weights: distance 35% · size 25% · config 20% · recency 20%. Top-matched comps best support the ARV.
Projected returns pro-forma
-3.0% appreciation · 6.62% rent growth · sell at horizon
- IRR
- -14.5%
- Equity multiple
- 0.47×
- Total profit
- $-50,662
- Equity at exit
- $50,531
- IRR
- -1.0%
- Equity multiple
- 0.92×
- Total profit
- $-7,409
- Equity at exit
- $29,302
Cash invested: $94,892 (down + closing). Projections, not guarantees.
Landlord ↔ Tenant lean methodology
- Overall (STATE)
- 55 Moderately Landlord-Leaning
- State Virginia
- 55 Moderately Landlord-Leaning · D+2
- County
- — inherits STATE
- City
- — inherits STATE
ZIP-level market 23454
- Rents YoY
- 6.6%
- Active inventory
- 209
- Price-to-rent
- 10.6×
Monthly cashflow live
- Estimated rent
- $2,653 high interval (Pro) →
- Mortgage (P&I)
- −$1,777
- Tax from tax record
- −$232 /mo · $2,788/yr
- Insurance
- −$141
- HOA
- −$35
- Vacancy / Maint / Mgmt
- −$557
- Net cashflow
- $-90
Break-even live
Sensitivity live
| Price | -10% $102 | -5% $6 | +0% $-90 | +5% $-185 | +10% $-281 |
|---|---|---|---|---|---|
| Rent | -10% $-299 | -5% $-194 | +0% $-90 | +5% $15 | +10% $120 |
| Rate | -1.0pp $81 | -0.5pp $-3 | base $-90 | +0.5pp $-177 | +1.0pp $-267 |
UW: 25.0% down · 7.5% · 30yr · 1.5% tax · 5.0% vac · 8.0% maint · 8.0% mgmt
Financing live
Cash to close
- Down payment
- $84,725
- Closing costs
- $10,167
- Reserves months
- —
- Total cash needed
- —
Loan-product check · same deal, 3 products live
Conventional
25% down · 7.5% · 30yr
- Down + closing
- —
- Monthly P&I
- —
- Monthly cashflow
- —
- DSCR
- —
- Eligible?
- —
Personal DTI + credit; lowest rate.
DSCR
20% down · 8.5% · 30yr
- Down + closing
- —
- Monthly P&I
- —
- Monthly cashflow
- —
- DSCR
- —
- Eligible?
- —
No personal income docs; deal must DSCR.
Hard money
10% down · 12.0% · 12mo
- Down + closing
- —
- Monthly P&I
- —
- Monthly cashflow
- —
- DSCR
- —
- Eligible?
- —
Short-term bridge; refi at stabilization.
Rent comps 19 comps
| Address | Beds | Baths | Sqft | Rent | $/sqft | DOM | Units | Dist |
|---|---|---|---|---|---|---|---|---|
| 792 Quesnel Dr Unit 1 Virginia Beach, VA | 3.0 | 2.5 | 1616 | $2,295 | $1.42 | 9d | 1 | 0.03mi |
| 762 Quesnel Dr Virginia Beach, VA | 3.0 | 2.5 | 1541 | $3,600 | $2.34 | 25d | 1 | 0.09mi |
| 520 Hillshire Way Virginia Beach, VA | 4.0 | 2.5 | 1634 | $2,900 | $1.77 | 25d | 1 | 0.17mi |
| 1631 Sword Dancer Dr Virginia Beach, VA | 3.0 | 2.0 | 1180 | $2,500 | $2.12 | 25d | 1 | 0.20mi |
| 1631 Sword Dancer Dr Virginia Beach, VA | 3.0 | 2.0 | 1180 | $2,500 | $2.12 | 14d | 1 | 0.20mi |
| 501 Hillshire Way Virginia Beach, VA | 3.0 | 2.5 | 1459 | $2,745 | $1.88 | 25d | 1 | 0.22mi |
| 1671 Ocean Bay Dr Virginia Beach, VA | 2.0 | 2.5 | 1354 | $2,100 | $1.55 | 25d | 1 | 0.23mi |
| 1676 Da Vinci Dr Virginia Beach, VA | 2.0 | 1.0 | 1512 | $1,595 | $1.05 | 14d | 1 | 0.47mi |
| 1676 Da Vinci Dr Virginia Beach, VA | 2.0 | 1.0 | 1512 | $1,595 | $1.05 | 6d | 1 | 0.47mi |
| 1473 Levy Ct Virginia Beach, VA | 3.0 | 2.5 | 1831 | $2,795 | $1.53 | 5d | 1 | 0.53mi |
| 512 Fieldstone Glen Way Virginia Beach, VA | 3.0 | 2.5 | 2100 | $2,550 | $1.21 | 25d | 1 | 0.65mi |
| 1808 Haviland Dr Virginia Beach, VA | 4.0 | 2.5 | 1993 | $3,500 | $1.76 | 25d | 1 | 0.84mi |
| 1836 Haviland Dr Virginia Beach, VA | 4.0 | 2.5 | 1993 | $2,895 | $1.45 | 19d | 1 | 0.89mi |
| 1828 Blairmore Arch Virginia Beach, VA | 3.0 | 2.0 | 1300 | $3,000 | $2.31 | 25d | 1 | 1.06mi |
| 1221 Garth Ct Virginia Beach, VA | 3.0 | 2.5 | 1614 | $2,600 | $1.61 | 16d | 1 | 1.24mi |
| 1584 Boles Pl Virginia Beach, VA | 3.0 | 2.5 | 1902 | $2,450 | $1.29 | 6d | 1 | 1.35mi |
| 1230 Gunn Hall Dr Virginia Beach, VA | 3.0 | 2.5 | 1764 | $2,650 | $1.50 | 25d | 1 | 1.37mi |
| 1149 Balch Pl Virginia Beach, VA | 3.0 | 2.5 | 1450 | $2,495 | $1.72 | 22d | 1 | 1.39mi |
| 1149 Balch Pl Virginia Beach, VA | 3.0 | 2.5 | 1450 | $2,495 | $1.72 | 6d | 1 | 1.39mi |
HOA detail
- Monthly dues
- $35 · $420/yr
- Likely covers
- gas
Listing history 12 events
-
2026-06-07statusdays on market $338,900 Under Contract 53 DOM
-
2026-06-03days on market $338,900 Active Under Contract 50 DOM
-
2026-06-02days on market $338,900 Active Under Contract 49 DOM
-
2026-06-01days on market $338,900 Active Under Contract 48 DOM
-
2026-05-31days on market $338,900 Active Under Contract 47 DOM
-
2026-05-08status Active
-
2026-04-29historical Active Under Contract
-
2026-04-14$338,900 Active
-
2018-08-20status Under Contract
-
2018-08-07$209,900 Active
-
2015-07-21soldstatus $185,000
-
2003-11-14soldstatus $98,000
ⓘ Source: listings_history table (triggers on properties + properties_extension) + one-shot
backfill from property_details.listing_events for pre-trigger history.
Tax reassessment forecast VA · Resets to sale price
- Current annual tax
- $2,788 · $232/mo
- Projected year-2 tax
- $2,788 · $232/mo
- Expected delta
- $0/yr ($0/mo · 0.0%)
ⓘ Screening estimate from a state-policy table — verify with the county assessor before closing.
Climate risk First Street
- Flood 4/10 Moderate FEMA zone X (unshaded) · 13% chance over 30 yrs
- Wildfire 4/10 Moderate
- Heat 9/10 Extreme 7 d/yr ≥102°F today · 18 d/yr by 30 yrs out
- Wind 8/10 Severe 99% chance of damaging wind over 30 yrs
- Air quality 2/10 Low 1 unhealthy d/yr today · 2 by 30 yrs out
Nearby sold comps map
Loading sold comps map…
Walkable amenities ~0.75 mi
Loading nearby amenities…
Taxation est. · year 1
- Rental income
- $31,841
- − Mortgage interest
- −$18,984
- − Property taxes
- −$2,788
- − Insurance
- −$1,694
- − Repairs & maintenance
- −$2,547
- − Management
- −$2,547
- − HOA
- −$420
- − Depreciation
- −$9,859
- Taxable loss
- −$6,999
- Est. tax savings @ 24.0%
- +$1,680
- After-tax cash flow
- $605/yr
For passive investors: Depreciation is non-cash, so a rental often shows a tax loss while cash-flowing — sheltering income. Rental losses are passive: they offset passive income freely, and up to $25,000/yr can offset ordinary (W-2) income if you actively participate and your MAGI is under $100k (phasing out to $0 by $150k); unused losses carry forward. On sale, claimed depreciation is recaptured at up to 25%, and gains may owe capital-gains tax (a 1031 exchange can defer both). Figures are a year-1 estimate at your 24.0% rate — not tax advice; consult a CPA.
Schools (NCES district)
- District
- Va Beach City Public School District
- NCES district ID
- 5103840
- Math proficiency
- 69% ▼ -19.00%
- Reading proficiency
- 78% ▼ -7.00%
- Median HH income
- $66,452
- Composite
- 63.81/100
- National rank
- #594
- State rank
- #10 of 131 in VA
Livability — Virginia Beach
- Score
- 83/100
- State rank
- #38
- US rank
- #880
Category grades
Schools grade is shown separately in the Schools card above.
Census & demographics
- Census place
- Virginia Beach, VA
- County
- Virginia Beach City · 448,227 people
- City population
- 448,227
- Metro
- Virginia Beach-Norfolk-Newport News, VA-NC
- Population (ZIP)
- 58,178
- Household income
- $102,796
- Rent vs Own
- Severe rent burden
- 1696.0
Population outlook (Virginia Beach County) Hauer SSP2
- Today (2025)
- 480,401 people
- By 2030
- 491,221 · +2.3%
- By 2040
- 504,882 · +5.1%
- By 2050
- 508,847 · +5.9%
- By 2075
- 504,831 · +5.1%
- By 2100
- 465,867 · -3.0%
Race, ethnicity, and origin ACS 2023
- Neighborhood character
- Predominantly White (69%)
- Race & ethnicity
- White 69% Black 13% Two or more races 9% Hispanic / Latino 7% Asian 4%
- Hispanic origin (detail)
- Mexican 2% Puerto Rican 2%
- Common ancestry
- Romanian 3% Lithuanian 3% Slovak 3%
- Foreign-born
- 7% · Canada, China
- Languages at home
- 90% English-only · Spanish 4% Tagalog/Filipino 1% Chinese 1%
Political lean MEDSL · Virginia Beach
- 2024 margin
- Toss-up / Even · D 50.7% · R 48.0% · Other 1.3%
- 2008→2024 swing
- +3.4pp toward D · 2008: -0.7pp · 2024: 2.6pp
- All cycles
- 2024: D+2.6 2020: D+5.4 2016: R+4.5 2012: R+2.5 2008: R+0.7
Not yet ingested
- Civics
- —
Market trends
- HPI YoY
- ▼ -385.89%
- Current HPI
- 328.85
- Rent YoY
- ▲ 6.62%
- Metro
- Virginia Beach-Norfolk-Newport News, VA-NC
- State GDP YoY
- ▲ 2.40%
- F500 in state
- 50
Industry mix (Fortune 500 HQ in VA)
| Industry | F500 HQs | Revenue |
|---|---|---|
| Aerospace / Defense | 4 | $236B |
|
||
| Technology / Defense | 3 | $32B |
|
||
| Financial Services | 2 | $176B |
|
||
| Utilities | 2 | $27B |
|
||
| Insurance | 2 | $25B |
|
||
| Technology | 2 | $15B |
|
||
Price history
+245.8% since first listed7 events — show timeline
- 2026-05-08 Relisted — REINMLS
- 2026-04-29 Contingent — REINMLS
- 2026-04-14 Listed $338,900 REINMLS
- 2018-08-20 Pending — REINMLS
- 2018-08-07 Listed $209,900 REINMLS
- 2015-07-21 Sold (Public Records) $185,000 Public Records
- 2003-11-14 Sold (Public Records) $98,000 Public Records
Property tax history
+4.4%/yrLatest (2025): $2,788 · +7.7% YoY. Source: county tax records.
Cash-flow waterfall
monthlySold comps — $/sqft
last 12 mo · ≤1 miLoading sold comps…