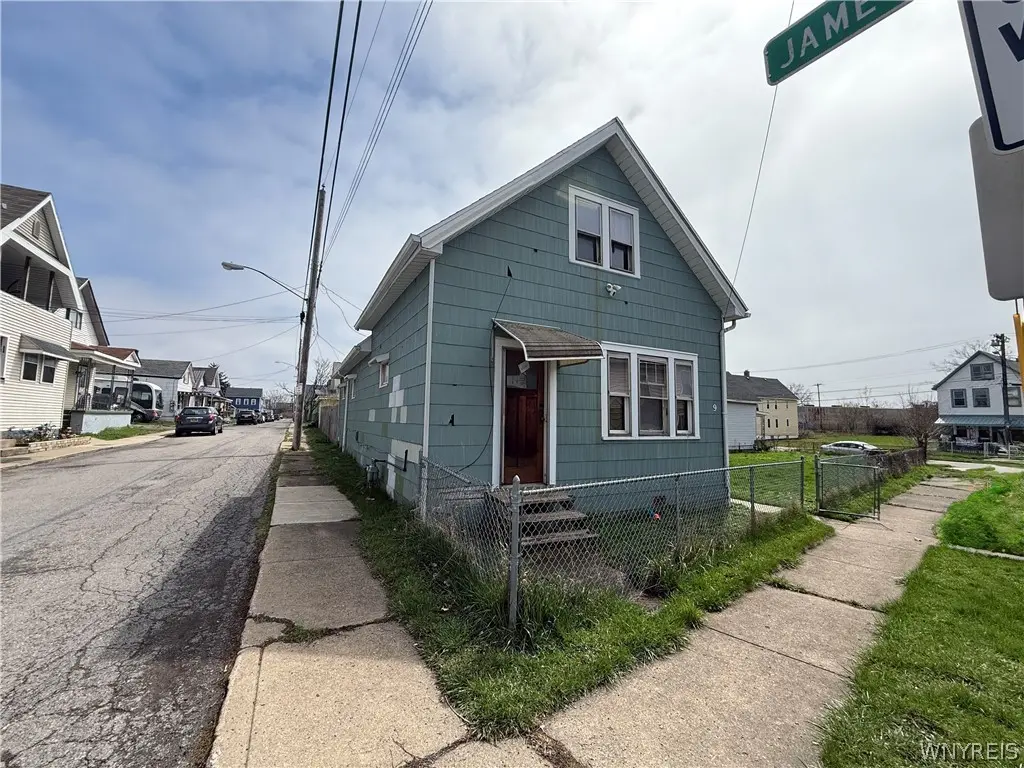
884 E Eagle St Unit N · Buffalo, NY
Flood risk 5/10 · Moderate
- FEMA flood zone
- X (unshaded)
- Chance of flooding over 30 yrs
- 0.5%
- Est. flood insurance / yr
- $507 – $1,088
Fire risk 1/10 · Minimal
- Est. fire insurance / yr
- $691 – $1,283
Heat risk 3/10 · Minor
- Hot days now (above 92°F)
- 7 days/yr
- Hot days in 30 yrs
- 15 days/yr
Wind risk 1/10 · Minimal
- Chance of severe wind over 30 yrs
- —
Air-quality risk 3/10 · Minor
- Unhealthy air days now
- 2 days/yr
- Unhealthy air days in 30 yrs
- 3 days/yr
Risk factors via First Street. Map © Google.
Why this score? — see what drove the A grade
The composite is a weighted blend of 9 inputs, each scored 0–100. Each bar is that input's sub-score; the figure is the points it added to the 100-point composite (weight × sub-score).
- Cash flow +30.0/30.0
- ARV discount +15.0/15.0
- 1% rule +10.0/10.0
- DSCR +10.0/10.0
- Appreciation +10.0/10.0
- Rent growth +5.0/5.0
- Livability +3.9/5.0
- Schools +3.3/10.0
- Condition / age +2.5/5.0
$85,000
🖨 Deal sheet 📄 Offer letter ✓ Due diligence
Listing remarks MLS
Welcome to 884 East Eagle St. , a delightful three-bedroom, one-bathroom home that offers an excellent opportunity for both owner-occupants and savvy investors. Nestled on a desirable corner lot, this property boasts solid mechanics and is conveniently located near public transportation, shopping, entertainment, and a variety of restaurants. Step inside to discover a spacious layout that invites creativity and personalization. The home features three bedrooms, The full bathroom is well-maintained and ready for your personal touch. With some cosmetic updates, this property can truly shine and become a perfect investment. Whether you're looking to create your dream home or seeking a promising rental opportunity, 884 East Eagle St. offers the flexibility to meet your needs. Don't miss out on this fantastic opportunity to own a home in a prime location with endless potential.
Key facts
- Entertainment
- Shopping
- Corner lot
Tags
Neighborhood map
What this means for you Summary
Snapshot
- This is a 4-bed/1.5-bath single-family listed at $85k.
Deal economics
- At list price, monthly cash flow is $740 ($9k/yr) — positive.
- The deal already cash-flows at list — no discount required.
- Meets the 1% rule at list price ($2k rent vs $85k).
- Recommended offer: $84k (1.5% below list) — sets the bar for market timing.
- Cap rate 16.7% vs local median 8.0% in Buffalo — top-decile yield for the area; either an underpriced asset or a hidden risk that comps aren't pricing in. Stress-test before assuming the spread holds.
Location & tenants
- Location reads 77/100 on livability (#195 in NY, #3,011 nationally) — a middle-class / working-renter tenant base. Strengths: commute A+, housing A+, health & safety A+; Watch: crime F, employment D-.
- Buffalo City School District (urban): math 41% / reading 40% proficiency, ranked #535 of 590 in NY (top 91%) — families likely to look elsewhere, expect single-tenant / working-renter base with shorter leases; 75% free/reduced lunch — lower-income household profile, screen leases tightly.
- Market conditions: Rents rising fast (+12.7%/yr); 94 active listings in the ZIP; 3 comparable units currently listed for rent nearby; rentals at typical pace (median 24d on market — plan ~3-4 weeks tenant-placement turnaround); 1,244 units permitted in Erie County in 2024 (563 in 5+ unit buildings).
- This rent runs 37% of the median local income ($54k/yr) — at the standard rent-burdened threshold; future hikes will face affordability resistance.
Forward outlook
- In year one you build about $9k of equity ($588 loan paydown + $8k appreciation (10.0% local appreciation)).
- At projected returns (10.0% appreciation + 8.0% rent growth), your $24k cash investment doubles in ~2 years — after that, you're playing with house money.
- By year 4, paydown + projected appreciation supports a ~$32k cash-out refi (75% LTV) — recoverable capital for the next deal without selling this one.
Negotiation context
- It's been on market 25 days — a 2% lower offer ($84k) is reasonable based on typical stale-listing flexibility.
- 2 sale attempts with the ask held roughly flat each time — persistent listings suggest the price (not the market) is what's stuck; bring a comps-based counter.
- Current owner paid $60k; 42% above their basis — modest negotiation headroom, anchor on the comps not their cost.
Risks & watch-outs
- Watch-outs: built in 1900 — expect roof / HVAC / electrical / plumbing capex.
- Climate carrying-cost: moderate flood risk — expect insurance premiums to compound above CPI over the hold.
Questions for the listing agent
- Built in 1900 — when were the roof, HVAC, electrical panel, plumbing, and water heater last replaced?
- Is there a deadline driving the sale (1031 exchange, divorce, estate, relocation)? That informs how much negotiation room exists.
- Crime grade is F in this area — have there been break-ins, vandalism, or insurance claims at this property in the last 3 years? What carrier currently insures it and at what premium?
- What's the average days-on-market for RENTAL listings here right now (not sales)? A rising rental-DOM trend means longer vacancies and softer asking-rent achievability than the comps imply.
- What's the recent tenant-quality profile in this submarket — average credit score on applications, eviction rate, late-payment / NSF rate, and stable-employment percentage? A property-management company in the area should have these aggregated.
- How much new for-sale + rental construction is in the pipeline within 1–3 miles? Heavy new supply typically softens prices + rents 12–24 months out; constrained supply supports both.
Investment metrics
- 1% rule
- 1.98% ✓
- Cap rate
- 16.74%
- Cash-on-cash
- 37.32%
- DSCR
- 2.66
- GRM
- 4.2
CMA / ARV
- ARV (median comp)
- $145,997
- List price
- $85,000
- Delta
- -41.78%
- Verdict
- UNDERPRICED
- Comps
- 20 within 1.0 mi
Show comp detail 5 sales within ~0.75 mi
| Address | Dist | Beds/Ba | Sqft | Sold | Price | $/sf | Match |
|---|---|---|---|---|---|---|---|
| 703 Smith St | 0.15mi | 3/— (-1) | 1,064 (+1%) | 4mo | $43,000 | $40 | 83 |
| 95 Jones St | 0.44mi | 4/1.0 | 956 (-9%) | 5mo | $119,900 | $125 | 58 |
| 160 Selkirk St | 0.45mi | 4/1.0 | 1,171 (+11%) | 7mo | $150,000 | $128 | 53 |
| 17 Clifford St | 0.53mi | 3/1.0 (-1) | 1,040 (-1%) | 20mo | $55,000 | $53 | 50 |
| 32 Clifford St | 0.51mi | 5/1.0 (+1) | 1,112 (+6%) | 21mo | $158,000 | $142 | 43 |
Match score weights: distance 35% · size 25% · config 20% · recency 20%. Top-matched comps best support the ARV.
Projected returns pro-forma
10.0% appreciation · 8.0% rent growth · sell at horizon
- IRR
- 56.4%
- Equity multiple
- 5.30×
- Total profit
- $102,340
- Equity at exit
- $76,575
- IRR
- 52.0%
- Equity multiple
- 13.03×
- Total profit
- $286,356
- Equity at exit
- $165,136
Cash invested: $23,800 (down + closing). Projections, not guarantees.
Landlord ↔ Tenant lean methodology
- Overall (STATE)
- 15 Strongly Tenant-Friendly
- State New York
- 15 Strongly Tenant-Friendly · D+10
- County
- — inherits STATE
- City
- — inherits STATE
ZIP-level market 14210
- Home prices YoY
- 13.8%
- Rents YoY
- 12.7%
- Active inventory
- 94
- Price-to-rent
- 4.2×
Monthly cashflow live
- Estimated rent
- $1,680 medium interval (Pro) →
- Mortgage (P&I)
- −$446
- Tax est. 1.5%
- −$106 /mo · $1,275/yr
- Insurance
- −$35
- HOA
- −$0
- Vacancy / Maint / Mgmt
- −$353
- Net cashflow
- $740
Break-even live
UW: 25.0% down · 7.5% · 30yr · 1.5% tax · 5.0% vac · 8.0% maint · 8.0% mgmt
Financing live
Cash to close
- Down payment
- $21,250
- Closing costs
- $2,550
- Reserves months
- —
- Total cash needed
- —
Loan-product check · same deal, 3 products live
Conventional
25% down · 7.5% · 30yr
- Down + closing
- —
- Monthly P&I
- —
- Monthly cashflow
- —
- DSCR
- —
- Eligible?
- —
Personal DTI + credit; lowest rate.
DSCR
20% down · 8.5% · 30yr
- Down + closing
- —
- Monthly P&I
- —
- Monthly cashflow
- —
- DSCR
- —
- Eligible?
- —
No personal income docs; deal must DSCR.
Hard money
10% down · 12.0% · 12mo
- Down + closing
- —
- Monthly P&I
- —
- Monthly cashflow
- —
- DSCR
- —
- Eligible?
- —
Short-term bridge; refi at stabilization.
Rent comps 3 comps
| Address | Beds | Baths | Sqft | Rent | $/sqft | DOM | Units | Dist |
|---|---|---|---|---|---|---|---|---|
| 47 Lester St Unit Main Floor Buffalo, NY | 3.0 | 1.0 | 900 | $1,000 | $1.11 | 43d | 1 | 0.95mi |
| 225 Louisiana St Buffalo, NY | 1.0–3.0 | 1.0–2.0 | 1164 | $2,653 | $2.28 | 1d | 7 | 1.41mi |
| 1150 Bailey Ave Buffalo, NY | 4.0 | 1.5 | 1100 | $1,200 | $1.09 | 23d | 1 | 1.47mi |
Listing history 6 events
-
2026-05-17status Pending 884-char remark
Show marketing remark (884 chars)
Welcome to 884 East Eagle St. , a delightful three-bedroom, one-bathroom home that offers an excellent opportunity for both owner-occupants and savvy investors. Nestled on a desirable corner lot, this property boasts solid mechanics and is conveniently located near public transportation, shopping, entertainment, and a variety of restaurants. Step inside to discover a spacious layout that invites creativity and personalization. The home features three bedrooms, The full bathroom is well-maintained and ready for your personal touch. With some cosmetic updates, this property can truly shine and become a perfect investment. Whether you're looking to create your dream home or seeking a promising rental opportunity, 884 East Eagle St. offers the flexibility to meet your needs. Don't miss out on this fantastic opportunity to own a home in a prime location with endless potential.
-
2026-04-22$85,000 Active 884-char remark
Show marketing remark (884 chars)
Welcome to 884 East Eagle St. , a delightful three-bedroom, one-bathroom home that offers an excellent opportunity for both owner-occupants and savvy investors. Nestled on a desirable corner lot, this property boasts solid mechanics and is conveniently located near public transportation, shopping, entertainment, and a variety of restaurants. Step inside to discover a spacious layout that invites creativity and personalization. The home features three bedrooms, The full bathroom is well-maintained and ready for your personal touch. With some cosmetic updates, this property can truly shine and become a perfect investment. Whether you're looking to create your dream home or seeking a promising rental opportunity, 884 East Eagle St. offers the flexibility to meet your needs. Don't miss out on this fantastic opportunity to own a home in a prime location with endless potential.
-
2026-04-22historical
Show marketing remark (884 chars)
Welcome to 884 East Eagle St. , a delightful three-bedroom, one-bathroom home that offers an excellent opportunity for both owner-occupants and savvy investors. Nestled on a desirable corner lot, this property boasts solid mechanics and is conveniently located near public transportation, shopping, entertainment, and a variety of restaurants. Step inside to discover a spacious layout that invites creativity and personalization. The home features three bedrooms, The full bathroom is well-maintained and ready for your personal touch. With some cosmetic updates, this property can truly shine and become a perfect investment. Whether you're looking to create your dream home or seeking a promising rental opportunity, 884 East Eagle St. offers the flexibility to meet your needs. Don't miss out on this fantastic opportunity to own a home in a prime location with endless potential.
-
2026-03-18price $99,999
-
2026-02-09$109,900 Active
-
2023-07-07soldstatus $60,000
ⓘ Source: listings_history table (triggers on properties + properties_extension) + one-shot
backfill from property_details.listing_events for pre-trigger history.
Climate risk First Street
- Flood 5/10 Major FEMA zone X (unshaded) · 50% chance over 30 yrs
- Wildfire 1/10 Low
- Heat 3/10 Moderate 7 d/yr ≥92°F today · 15 d/yr by 30 yrs out
- Wind 1/10 Low
- Air quality 3/10 Moderate 2 unhealthy d/yr today · 3 by 30 yrs out
Nearby sold comps map
Loading sold comps map…
Walkable amenities ~0.75 mi
Loading nearby amenities…
Taxation est. · year 1
- Rental income
- $20,166
- − Mortgage interest
- −$4,761
- − Property taxes
- −$1,275
- − Insurance
- −$425
- − Repairs & maintenance
- −$1,613
- − Management
- −$1,613
- − Depreciation
- −$2,473
- Taxable income
- $8,005
- Est. tax owed @ 24.0%
- −$1,921
- After-tax cash flow
- $6,961/yr
For passive investors: Depreciation is non-cash, so a rental often shows a tax loss while cash-flowing — sheltering income. Rental losses are passive: they offset passive income freely, and up to $25,000/yr can offset ordinary (W-2) income if you actively participate and your MAGI is under $100k (phasing out to $0 by $150k); unused losses carry forward. On sale, claimed depreciation is recaptured at up to 25%, and gains may owe capital-gains tax (a 1031 exchange can defer both). Figures are a year-1 estimate at your 24.0% rate — not tax advice; consult a CPA.
Schools (NCES district)
- District
- Buffalo City School District
- NCES district ID
- 3605850
- Math proficiency
- 41% ▲ 11.00%
- Reading proficiency
- 40% ▲ 7.00%
- Median HH income
- $31,665
- Composite
- 33.17/100
- National rank
- #5544
- State rank
- #535 of 590 in NY
Livability — Buffalo
- Score
- 77/100
- State rank
- #195
- US rank
- #3011
Category grades
Schools grade is shown separately in the Schools card above.
Census & demographics
- Census place
- Buffalo, NY
- County
- Erie County · 714,559 people
- City population
- 440,021
- Metro
- Buffalo-Cheektowaga, NY
- Population (ZIP)
- 15,563
- Household income
- $54,197
- Rent vs Own
- Severe rent burden
- 959.0
Population outlook (Erie County) Hauer SSP2
- Today (2025)
- 933,037 people
- By 2030
- 935,181 · +0.2%
- By 2040
- 928,531 · -0.5%
- By 2050
- 905,725 · -2.9%
- By 2075
- 834,037 · -10.6%
- By 2100
- 708,033 · -24.1%
Race, ethnicity, and origin ACS 2023
- Neighborhood character
- Predominantly White (79%)
- Race & ethnicity
- White 79% Two or more races 8% Black 8% Hispanic / Latino 7% Asian 1%
- Hispanic origin (detail)
- Puerto Rican 6%
- Common ancestry
- Romanian 21% Lithuanian 2% Serbian 1%
- Foreign-born
- 2% · Canada, China
- Languages at home
- 95% English-only · Spanish 2% Arabic 1% Other Indo-European 1%
Political lean MEDSL · Erie
- 2024 margin
- Lean D (+9.7) · D 54.8% · R 45.2%
- 2008→2024 swing
- -7.9pp toward R · 2008: 17.5pp · 2024: 9.7pp
- All cycles
- 2024: D+9.7 2020: D+14.7 2016: D+4.8 2012: D+15.6 2008: D+17.5
Not yet ingested
- Civics
- —
Market trends
- HPI YoY
- ▲ 52.34%
- Current HPI
- 431.7951
- Rent YoY
- ▲ 12.67%
- Metro
- Buffalo-Cheektowaga, NY
- State GDP YoY
- ▲ 2.60%
- F500 in state
- 92
Industry mix (Fortune 500 HQ in NY)
| Industry | F500 HQs | Revenue |
|---|---|---|
| Financial Services | 10 | $950B |
|
||
| Consumer Goods | 9 | $162B |
|
||
| Insurance | 4 | $225B |
|
||
| Telecommunications | 2 | $144B |
|
||
| Pharmaceuticals | 2 | $112B |
|
||
| Media / Entertainment | 2 | $69B |
|
||
Price history
+41.7% since first listed6 events — show timeline
- 2026-05-17 Pending — WNYREIS
- 2026-04-22 Listing Removed — WNYREIS
- 2026-04-22 Listed $85,000 WNYREIS
- 2026-03-18 Price Changed $99,999 WNYREIS
- 2026-02-09 Listed $109,900 WNYREIS
- 2023-07-07 Sold (Public Records) $60,000 Public Records
Property tax history
+9.3%/yrLatest (2025): $151 · +0.0% YoY. Source: county tax records.
Cash-flow waterfall
monthlySold comps — $/sqft
last 12 mo · ≤1 miLoading sold comps…