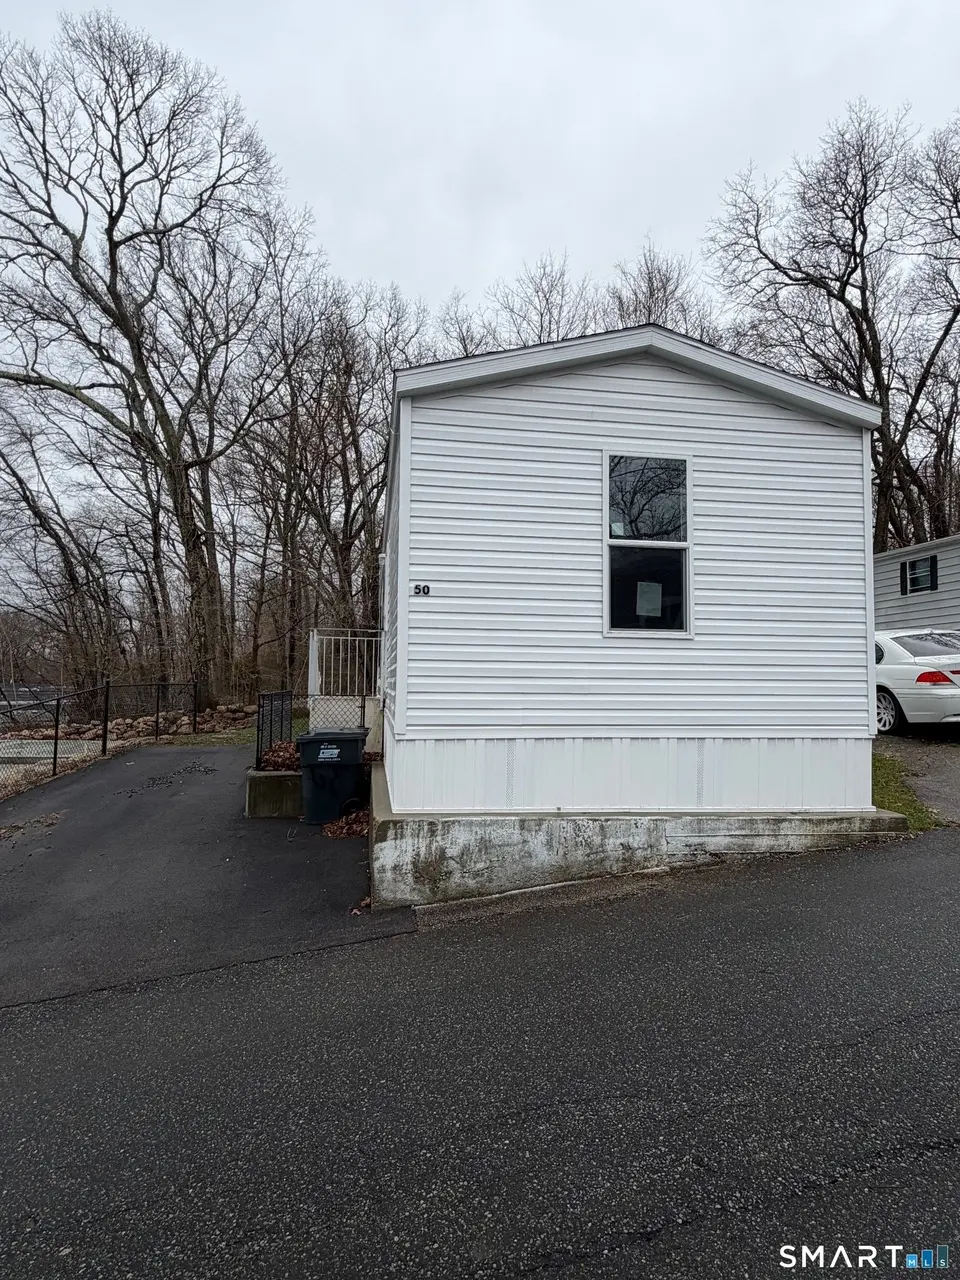
435 High St #50 · Groton, CT
Flood risk No data
- FEMA flood zone
- —
- Chance of flooding over 30 yrs
- —
- Est. flood insurance / yr
- —
Fire risk No data
- Est. fire insurance / yr
- —
Heat risk No data
- Hot days now (above threshold)
- —
- Hot days in 30 yrs
- —
Wind risk No data
- Chance of severe wind over 30 yrs
- —
Air-quality risk No data
- Unhealthy air days now
- —
- Unhealthy air days in 30 yrs
- —
Risk factors via First Street. Map © Google.
Why this score? — see what drove the B grade
The composite is a weighted blend of 9 inputs, each scored 0–100. Each bar is that input's sub-score; the figure is the points it added to the 100-point composite (weight × sub-score).
- Cash flow +30.0/30.0
- ARV discount +11.9/15.0
- 1% rule +10.0/10.0
- DSCR +10.0/10.0
- Schools +3.6/10.0
- Livability +3.6/5.0
- Rent growth +2.5/5.0
- Condition / age +2.5/5.0
- Appreciation +0.0/10.0
$125,000
🖨 Deal sheet (PDF) 📄 Offer letter ✓ Due diligence
Listing remarks MLS
Never lived in 2024 manufactured home in a mobile home community. Back patio to enjoy! Minutes from I95 and Downtown Mystic. Military/EB/Pfizer discounts available! Brand New Driveway!
Key facts
- Downtown mystic
- Brand new driveway
- Minutes from i95
Tags
Neighborhood map
What this means for you Summary
Snapshot
- This is a 3-bed/1.5-bath manufactured listed at $125k.
Deal economics
- At list price, monthly cash flow is $524 ($6k/yr) — positive.
- The deal already cash-flows at list — no discount required.
- Meets the 1% rule at list price ($3k rent vs $125k).
- Recommended offer: $118k (6.0% below list) — sets the bar for market timing.
- Cap rate 11.3% vs local median 4.0% in Groton — top-decile yield for the area; either an underpriced asset or a hidden risk that comps aren't pricing in. Stress-test before assuming the spread holds.
Location & tenants
- Location reads 71/100 on livability (#90 in CT) — a middle-class / working-renter tenant base. Strengths: crime A, housing A, health & safety A; Watch: employment C-, amenities F, commute F.
- Groton School District (suburban): math 32% / reading 50% proficiency, ranked #96 of 153 in CT (top 63%) — families likely to look elsewhere, expect single-tenant / working-renter base with shorter leases.
- Zoned schools: Northeast Academy Magnet School (math 42% / reading 62%, grade C-, #213 of 553 statewide, top 41%, 391 students, 27% FRL); Groton Middle School (math 28% / reading 47%, grade F, #112 of 175 statewide, top 66%, 907 students, 47% FRL); Robert E. Fitch High School (math 37% / reading 61%, grade D, #90 of 194 statewide, top 46%, 1,005 students, 43% FRL).
- Market conditions: 84 active listings in the ZIP; 5 comparable units currently listed for rent nearby; rentals at typical pace (median 23d on market — plan ~3-4 weeks tenant-placement turnaround); high-income renter base; 487 units permitted in Southeastern Connecticut Planning Region in 2024 (244 in 5+ unit buildings).
Forward outlook
- Local home prices are declining (-3.0%/yr); year-one equity from $864 of loan paydown is wiped out by about $4k of value loss. Plan a longer hold.
- At projected returns (-3.0% appreciation + 3.0% rent growth), your $35k cash investment doubles in ~7 years — after that, you're playing with house money.
Negotiation context
- It's been on market 73 days — a 6% lower offer ($118k) is reasonable based on typical stale-listing flexibility.
- 2 sale attempts since 3y ago with the ask held roughly flat each time — persistent listings suggest the price (not the market) is what's stuck; bring a comps-based counter.
Risks & watch-outs
- Watch-outs: HOA is 24% of rent.
Questions for the listing agent
- It's been on market 73 days. Have you received any prior offers? Is the seller open to a 6% concession, seller financing, or rate buy-down credit?
- What does the HOA fee cover, when was the last increase, and are there any pending special assessments or reserve-fund shortfalls?
- Why hasn't it sold? Are there any deal-killer items the seller is aware of (foundation, flood, title, zoning, code violations)?
- Is there a deadline driving the sale (1031 exchange, divorce, estate, relocation)? That informs how much negotiation room exists.
- What's the average days-on-market for RENTAL listings here right now (not sales)? A rising rental-DOM trend means longer vacancies and softer asking-rent achievability than the comps imply.
- What's the recent tenant-quality profile in this submarket — average credit score on applications, eviction rate, late-payment / NSF rate, and stable-employment percentage? A property-management company in the area should have these aggregated.
- How much new for-sale + rental construction is in the pipeline within 1–3 miles? Heavy new supply typically softens prices + rents 12–24 months out; constrained supply supports both.
Investment metrics
- 1% rule
- 2.01% ✓
- Cap rate
- 11.32%
- Cash-on-cash
- 17.97%
- DSCR
- 1.80
- GRM
- 4.1
CMA / ARV
- ARV (median comp)
- $138,556
- List price
- $125,000
- Delta
- -9.78%
- Verdict
- FAIR
- Comps
- 20 within 1.0 mi
Projected returns pro-forma
-3.0% appreciation · 3.0% rent growth · sell at horizon
- IRR
- 9.8%
- Equity multiple
- 1.39×
- Total profit
- $13,532
- Equity at exit
- $18,638
- IRR
- 19.1%
- Equity multiple
- 2.61×
- Total profit
- $56,418
- Equity at exit
- $10,808
Cash invested: $35,000 (down + closing). Projections, not guarantees.
Landlord ↔ Tenant lean methodology
- Overall (STATE)
- 27 Tenant-Leaning
- State Connecticut
- 27 Tenant-Leaning · D+7
- County
- — inherits STATE
- City
- — inherits STATE
ZIP-level market 06355
- Home prices YoY
- -17.8%
- Active inventory
- 84
- Price-to-rent
- 4.1×
Monthly cashflow live
- Estimated rent
- $2,516 high interval (Pro) →
- Mortgage (P&I)
- −$656
- Tax est. 1.5%
- −$156 /mo · $1,875/yr
- Insurance
- −$52
- HOA
- −$600
- Vacancy / Maint / Mgmt
- −$528
- Net cashflow
- $524
Break-even live
Sensitivity live
| Price | -10% $610 | -5% $567 | +0% $524 | +5% $481 | +10% $438 |
|---|---|---|---|---|---|
| Rent | -10% $325 | -5% $425 | +0% $524 | +5% $623 | +10% $723 |
| Rate | -1.0pp $587 | -0.5pp $556 | base $524 | +0.5pp $492 | +1.0pp $459 |
UW: 25.0% down · 7.5% · 30yr · 1.5% tax · 5.0% vac · 8.0% maint · 8.0% mgmt
Financing live
Cash to close
- Down payment
- $31,250
- Closing costs
- $3,750
- Reserves months
- —
- Total cash needed
- —
Loan-product check · same deal, 3 products live
Conventional
25% down · 7.5% · 30yr
- Down + closing
- —
- Monthly P&I
- —
- Monthly cashflow
- —
- DSCR
- —
- Eligible?
- —
Personal DTI + credit; lowest rate.
DSCR
20% down · 8.5% · 30yr
- Down + closing
- —
- Monthly P&I
- —
- Monthly cashflow
- —
- DSCR
- —
- Eligible?
- —
No personal income docs; deal must DSCR.
Hard money
10% down · 12.0% · 12mo
- Down + closing
- —
- Monthly P&I
- —
- Monthly cashflow
- —
- DSCR
- —
- Eligible?
- —
Short-term bridge; refi at stabilization.
Rent comps 5 comps
| Address | Beds | Baths | Sqft | Rent | $/sqft | DOM | Units | Dist |
|---|---|---|---|---|---|---|---|---|
| 45 W Main St Unit 2 Mystic, CT | 2.0 | 1.0 | 900 | $2,295 | $2.55 | 15d | 1 | 0.58mi |
| 12 Water St Mystic, CT | 1.0–2.0 | 1.0–2.0 | 912 | $2,800 | $3.07 | 15d | 3 | 0.61mi |
| 12 Water St Unit 408 Mystic, CT | 2.0 | 1.0 | 1075 | $2,800 | $2.60 | 23d | 1 | 0.64mi |
| 2 Lincoln Ave Apt 3 Mystic, CT | 2.0 | 1.0 | 900 | $1,875 | $2.08 | 23d | 1 | 1.02mi |
| 454 Cow Hill Rd Unit 2 Mystic, CT | 2.0 | 1.0 | 900 | $1,250 | $1.39 | 46d | 1 | 1.32mi |
HOA detail
- Monthly dues
- $600 · $7,200/yr
Listing history 21 events
-
2026-06-22days on market $125,000 Active 73 DOM
-
2026-06-19days on market $125,000 Active 71 DOM
-
2026-06-18days on market $125,000 Active 70 DOM
-
2026-06-17days on market $125,000 Active 69 DOM
-
2026-06-16days on market $125,000 Active 68 DOM
-
2026-06-15days on market $125,000 Active 67 DOM
-
2026-06-14days on market $125,000 Active 65 DOM
-
2026-06-13days on market $125,000 Active 64 DOM
-
2026-06-10days on market $125,000 Active 62 DOM
-
2026-06-09days on market $125,000 Active 61 DOM
-
2026-06-08days on market $125,000 Active 60 DOM
-
2026-06-07days on market $125,000 Active 59 DOM
-
2026-06-05days on market $125,000 Active 56 DOM
-
2026-06-03days on market $125,000 Active 55 DOM
-
2026-06-02days on market $125,000 Active 54 DOM
-
2026-06-01days on market $125,000 Active 53 DOM
-
2026-05-31days on market $125,000 Active 52 DOM
-
2026-05-30days on market $125,000 Active 51 DOM
-
2026-04-09$125,000 Active 185-char remark
Show marketing remark (185 chars)
Never lived in 2024 manufactured home in a mobile home community. Back patio to enjoy! Minutes from I95 and Downtown Mystic. Military/EB/Pfizer discounts available! Brand New Driveway!
-
2024-08-27historical
-
2023-10-03$127,000 Active
ⓘ Source: listings_history table (triggers on properties + properties_extension) + one-shot
backfill from property_details.listing_events for pre-trigger history.
Nearby sold comps map
Loading sold comps map…
Walkable amenities ~0.75 mi
Loading nearby amenities…
Taxation est. · year 1
- Rental income
- $30,197
- − Mortgage interest
- −$7,002
- − Property taxes
- −$1,875
- − Insurance
- −$625
- − Repairs & maintenance
- −$2,416
- − Management
- −$2,416
- − HOA
- −$7,200
- − Depreciation
- −$3,636
- Taxable income
- $5,027
- Est. tax owed @ 24.0%
- −$1,206
- After-tax cash flow
- $5,083/yr
For passive investors: Depreciation is non-cash, so a rental often shows a tax loss while cash-flowing — sheltering income. Rental losses are passive: they offset passive income freely, and up to $25,000/yr can offset ordinary (W-2) income if you actively participate and your MAGI is under $100k (phasing out to $0 by $150k); unused losses carry forward. On sale, claimed depreciation is recaptured at up to 25%, and gains may owe capital-gains tax (a 1031 exchange can defer both). Figures are a year-1 estimate at your 24.0% rate — not tax advice; consult a CPA.
Schools (NCES district)
- District
- Groton School District
- NCES district ID
- 0901770
- Math proficiency
- 32% ▼ -16.00%
- Reading proficiency
- 50% ▼ -10.00%
- Median HH income
- $60,709
- Composite
- 36.28/100
- National rank
- #4702
- State rank
- #96 of 153 in CT
Livability — Groton
- Score
- 71/100
- State rank
- #90
- US rank
- #7096
Category grades
Schools grade is shown separately in the Schools card above.
Census & demographics
- County
- New London County · 147,197 people
- City population
- 42,036
- Metro
- Norwich-New London, CT
- Population (ZIP)
- 12,173
- Household income
- $137,425
- Rent vs Own
- Severe rent burden
- 197.0
Population outlook (Southeastern Connecticut County) Hauer SSP2
- By 2040
- 293,442
Race, ethnicity, and origin ACS 2023
- Neighborhood character
- Predominantly White (83%)
- Race & ethnicity
- White 83% Two or more races 9% Asian 4% Hispanic / Latino 2% Black 2%
- Common ancestry
- Lithuanian 6% Romanian 6% Slovak 5%
- Foreign-born
- 7% · Canada, China
- Languages at home
- 94% English-only · Other Indo-European 2% Spanish 1% French/Haitian/Cajun 1%
Political lean MEDSL · Southeastern Connecticut
- 2024 margin
- D (+13.0) · D 55.6% · R 42.6% · Other 1.8%
- All cycles
- 2024: D+13.0
Not yet ingested
- Civics
- —
Market trends
- HPI YoY
- ▼ -62.46%
- Current HPI
- 287.7568
- Rent YoY
- —
- Metro
- Norwich-New London, CT
- State GDP YoY
- ▲ 1.06%
- F500 in state
- 38
Industry mix (Fortune 500 HQ in CT)
| Industry | F500 HQs | Revenue |
|---|---|---|
| Industrial Machinery | 4 | $38B |
|
||
| Insurance | 3 | $71B |
|
||
| Financial Services | 2 | $25B |
|
||
| Transportation / Logistics | 2 | $18B |
|
||
| Healthcare | 1 | $247B |
|
||
| Telecommunications | 1 | $55B |
|
||
Price history
-1.6% since first listed3 events — show timeline
- 2026-04-09 Listed $125,000 Smart MLS
- 2024-08-27 Listing Removed — Smart MLS
- 2023-10-03 Listed $127,000 Smart MLS
Property tax history
-0.1%/yrLatest (2021): $158 · +1.3% YoY. Source: county tax records.
Cash-flow waterfall
monthlySold comps — $/sqft
last 12 mo · ≤1 miLoading sold comps…