12931 N 2910 Rd · Hennessey, OK
Flood risk 5/10 · Moderate
- FEMA flood zone
- X (unshaded)
- Chance of flooding over 30 yrs
- 0.65%
- Est. flood insurance / yr
- $507 – $1,088
Fire risk 2/10 · Minimal
- Est. fire insurance / yr
- $2,463 – $4,575
Heat risk 6/10 · Moderate
- Hot days now (above 109°F)
- 7 days/yr
- Hot days in 30 yrs
- 19 days/yr
Wind risk 3/10 · Minor
- Chance of severe wind over 30 yrs
- 6.0%
Air-quality risk 2/10 · Minimal
- Unhealthy air days now
- 0 days/yr
- Unhealthy air days in 30 yrs
- 1 days/yr
Risk factors via First Street. Map © Google.
Why this score? — see what drove the B grade
The composite is a weighted blend of 9 inputs, each scored 0–100. Each bar is that input's sub-score; the figure is the points it added to the 100-point composite (weight × sub-score).
- Cash flow +29.1/30.0
- DSCR +10.0/10.0
- ARV discount +7.5/15.0
- Appreciation +7.0/10.0
- 1% rule +6.9/10.0
- Livability +3.6/5.0
- Rent growth +2.5/5.0
- Condition / age +2.5/5.0
- Schools +2.3/10.0
$98,000
🖨 Deal sheet 📄 Offer letter ✓ Due diligence
Listing remarks
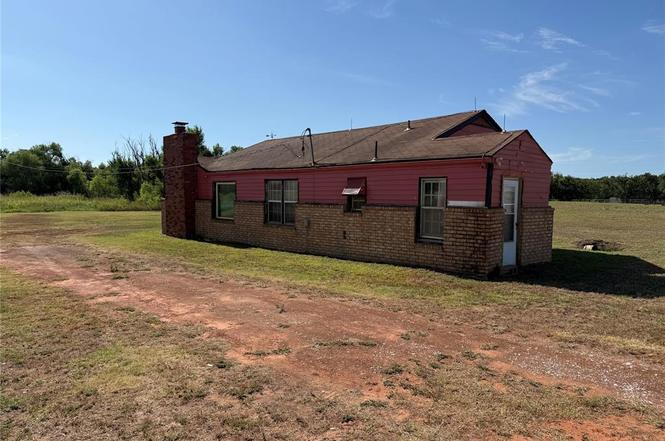
Here is a little farm located in Dover Oklahoma. The home is a 3/1 with 1,560 sqft. Enjoy the 4.05 acres of completely fenced yard and the peace and simplicity of country living!
Key facts
- Country living
- Fenced yard
- 4.05 acres
Tags
Property features AI
Finance
- Other: Vacant and available; Located on approximately 4.05 acres
- Financial info: Sold as-is; cash offers accepted; Not assumable
- HOA & community: No mandatory association dues
Exterior
- Parking: Gravel parking
- Utilities: Electricity available; Propane; Septic tank
- Home design: Single-family residence; One-story; North-facing; Residential property
- Construction: Brick and frame construction; Composition roof; Conventional foundation; Homestead eligible
- Exterior features: Covered patio; Metal fencing; Pasture/Ranch lot setting
Interior
- Bedrooms: 3 bedrooms
- Bathrooms: 1 full bathroom; 1 half bathroom
- Heating & cooling: Central electric heat
- Interior features: One living area; One dining area; Wood-burning fireplace
Neighborhood map
What this means for you Summary
Snapshot
- This is a 3-bed/1.0-bath single-family listed at $98k.
Deal economics
- At list price, monthly cash flow is $337 ($4k/yr) — positive.
- The deal already cash-flows at list — no discount required.
- Meets the 1% rule at list price ($1k rent vs $98k).
- Recommended offer: $86k (12.0% below list) — sets the bar for market timing.
Location & tenants
- Location reads 71/100 on livability (#32 in OK) — a middle-class / working-renter tenant base. Strengths: crime A+, cost of living A+, housing A+; Watch: health & safety C-, employment D+, amenities F.
- Dover (rural): math 20% / reading 25% proficiency, ranked #356 of 513 in OK (top 69%) — low school quality limits family demand, transient renter base, plan for 1-2y turnover; 68% free/reduced lunch — lower-income household profile, screen leases tightly.
- Zoned schools: Dover Es (math 17% / reading 22%, grade F, #479 of 845 statewide, top 63%, 119 students, 0% FRL); Dover Hs (math 24% / reading 24%, grade F, #150 of 447 statewide, top 48%, 52 students, 0% FRL) — zoned schools average 0% FRL vs 68% district-wide (68 pts lower); this property's tenant base skews higher-income than the district average.
- Market conditions: 14 active listings in the ZIP; 39 units permitted in Kingfisher County in 2024 (0 in 5+ unit buildings).
Forward outlook
- In year one you build about $5k of equity ($678 loan paydown + $4k appreciation (4.0% local appreciation)).
- Kingfisher County population projected at +17% by 2050 — long-run rental-demand tailwind backs the buy-and-hold thesis.
- At projected returns (4.0% appreciation + 3.0% rent growth), your $27k cash investment doubles in ~4 years — after that, you're playing with house money.
- By year 8, paydown + projected appreciation supports a ~$34k cash-out refi (75% LTV) — recoverable capital for the next deal without selling this one.
Negotiation context
- It's been on market 280 days — a 12% lower offer ($86k) is reasonable based on typical stale-listing flexibility.
- 2 sale attempts; this cycle's ask has dropped $22k (18%) from the opening price — seller is motivated, your offer sets the floor, not the list.
- Current owner paid $10k; list at $98k implies a 880% gain — meaningful room to come down on a strong offer.
Risks & watch-outs
- Watch-outs: built in 1940 — expect roof / HVAC / electrical / plumbing capex.
- Climate carrying-cost: moderate flood risk; extreme-heat days projected 7→19/yr by 2055 (HVAC capex compounding) — expect insurance premiums to compound above CPI over the hold.
Questions for the listing agent
- It's been on market 280 days. Have you received any prior offers? Is the seller open to a 12% concession, seller financing, or rate buy-down credit?
- Built in 1940 — when were the roof, HVAC, electrical panel, plumbing, and water heater last replaced?
- Why hasn't it sold? Are there any deal-killer items the seller is aware of (foundation, flood, title, zoning, code violations)?
- Is there a deadline driving the sale (1031 exchange, divorce, estate, relocation)? That informs how much negotiation room exists.
- Schools are D-rated, which usually means shorter tenancies and higher turnover. Who's the typical renter profile here, and what's been the actual vacancy rate?
- What's the average days-on-market for RENTAL listings here right now (not sales)? A rising rental-DOM trend means longer vacancies and softer asking-rent achievability than the comps imply.
- What's the recent tenant-quality profile in this submarket — average credit score on applications, eviction rate, late-payment / NSF rate, and stable-employment percentage? A property-management company in the area should have these aggregated.
- How much new for-sale + rental construction is in the pipeline within 1–3 miles? Heavy new supply typically softens prices + rents 12–24 months out; constrained supply supports both.
Investment metrics
- 1% rule
- 1.19% ✓
- Cap rate
- 10.42%
- Cash-on-cash
- 14.74%
- DSCR
- 1.66
- GRM
- 7.0
CMA / ARV
No comps found within radius.
Projected returns pro-forma
3.96% appreciation · 3.0% rent growth · sell at horizon
- IRR
- 23.4%
- Equity multiple
- 2.39×
- Total profit
- $38,278
- Equity at exit
- $49,431
- IRR
- 23.5%
- Equity multiple
- 4.65×
- Total profit
- $100,157
- Equity at exit
- $80,645
Cash invested: $27,440 (down + closing). Projections, not guarantees.
Landlord ↔ Tenant lean methodology
- Overall (STATE)
- 83 Strongly Landlord-Friendly
- State Oklahoma
- 83 Strongly Landlord-Friendly · R+20
- County
- — inherits STATE
- City
- — inherits STATE
ZIP-level market 73742
- Home prices YoY
- 1.1%
- Active inventory
- 14
- Price-to-rent
- 7.0×
Monthly cashflow live
- Estimated rent
- $1,167 medium interval (Pro) →
- Mortgage (P&I)
- −$514
- Tax from tax record
- −$30 /mo · $366/yr
- Insurance
- −$41
- HOA
- −$0
- Vacancy / Maint / Mgmt
- −$245
- Net cashflow
- $337
Break-even live
UW: 25.0% down · 7.5% · 30yr · 1.5% tax · 5.0% vac · 8.0% maint · 8.0% mgmt
Financing live
Cash to close
- Down payment
- $24,500
- Closing costs
- $2,940
- Reserves months
- —
- Total cash needed
- —
Loan-product check · same deal, 3 products live
Conventional
25% down · 7.5% · 30yr
- Down + closing
- —
- Monthly P&I
- —
- Monthly cashflow
- —
- DSCR
- —
- Eligible?
- —
Personal DTI + credit; lowest rate.
DSCR
20% down · 8.5% · 30yr
- Down + closing
- —
- Monthly P&I
- —
- Monthly cashflow
- —
- DSCR
- —
- Eligible?
- —
No personal income docs; deal must DSCR.
Hard money
10% down · 12.0% · 12mo
- Down + closing
- —
- Monthly P&I
- —
- Monthly cashflow
- —
- DSCR
- —
- Eligible?
- —
Short-term bridge; refi at stabilization.
Listing history 20 events
-
2026-06-18days on market $98,000 Active 280 DOM
-
2026-06-17days on market $98,000 Active 279 DOM
-
2026-06-16days on market $98,000 Active 278 DOM
-
2026-06-15days on market $98,000 Active 277 DOM
-
2026-06-13days on market $98,000 Active 275 DOM
-
2026-06-12days on market $98,000 Active 274 DOM
-
2026-06-09days on market $98,000 Active 271 DOM
-
2026-06-08days on market $98,000 Active 270 DOM
-
2026-06-08days on market $98,000 Active 269 DOM
-
2026-06-05days on market $98,000 Active 267 DOM
-
2026-06-04days on market $98,000 Active 265 DOM
-
2026-06-02days on market $98,000 Active 264 DOM
-
2026-06-01days on market $98,000 Active 263 DOM
-
2026-05-31days on market $98,000 Active 262 DOM
-
2026-05-15price $98,000
-
2026-02-28status Active
-
2026-02-16status Pending
-
2025-11-25price $114,000
-
2025-08-30$120,000 Active
-
1994-01-21soldstatus $10,000
ⓘ Source: listings_history table (triggers on properties + properties_extension) + one-shot
backfill from property_details.listing_events for pre-trigger history.
Tax reassessment forecast OK · Resets to sale price
- Current annual tax
- $366 · $30/mo
- Projected year-2 tax
- $882 · $73/mo
- Expected delta
- +$516/yr (+$43/mo · 141.0%)
ⓘ Screening estimate from a state-policy table — verify with the county assessor before closing.
Climate risk First Street
- Flood 5/10 Major FEMA zone X (unshaded) · 65% chance over 30 yrs
- Wildfire 2/10 Low
- Heat 6/10 Major 7 d/yr ≥109°F today · 19 d/yr by 30 yrs out
- Wind 3/10 Moderate 6% chance of damaging wind over 30 yrs
- Air quality 2/10 Low 0 unhealthy d/yr today · 1 by 30 yrs out
Nearby sold comps map
Loading sold comps map…
Walkable amenities ~0.75 mi
Loading nearby amenities…
Taxation est. · year 1
- Rental income
- $14,010
- − Mortgage interest
- −$5,490
- − Property taxes
- −$366
- − Insurance
- −$490
- − Repairs & maintenance
- −$1,121
- − Management
- −$1,121
- − Depreciation
- −$2,851
- Taxable income
- $2,572
- Est. tax owed @ 24.0%
- −$617
- After-tax cash flow
- $3,427/yr
For passive investors: Depreciation is non-cash, so a rental often shows a tax loss while cash-flowing — sheltering income. Rental losses are passive: they offset passive income freely, and up to $25,000/yr can offset ordinary (W-2) income if you actively participate and your MAGI is under $100k (phasing out to $0 by $150k); unused losses carry forward. On sale, claimed depreciation is recaptured at up to 25%, and gains may owe capital-gains tax (a 1031 exchange can defer both). Figures are a year-1 estimate at your 24.0% rate — not tax advice; consult a CPA.
Schools (NCES district)
- District
- Dover
- NCES district ID
- 4010050
- Math proficiency
- 20% ▲ 5.00%
- Reading proficiency
- 25% ▲ 5.00%
- Median HH income
- $50,870
- Composite
- 23.2/100
- National rank
- #13325
- State rank
- #356 of 513 in OK
Livability — Hennessey
- Score
- 71/100
- State rank
- #32
- US rank
- #6989
Category grades
Schools grade is shown separately in the Schools card above.
Census & demographics
- Population (ZIP)
- 3,808
Population outlook (Kingfisher County) Hauer SSP2
- Today (2025)
- 16,635 people
- By 2030
- 17,167 · +3.2%
- By 2040
- 18,317 · +10.1%
- By 2050
- 19,454 · +16.9%
- By 2075
- 23,115 · +39.0%
- By 2100
- 25,758 · +54.8%
Race, ethnicity, and origin ACS 2023
- Neighborhood character
- Majority White (62%)
- Race & ethnicity
- White 62% Hispanic / Latino 36% Two or more races 16% Native American 1%
- Hispanic origin (detail)
- Mexican 34%
- Common ancestry
- Slovak 4% Serbian 3% Iranian 2%
- Foreign-born
- 18% · Canada
- Languages at home
- 73% English-only · Spanish 25% German/W. Germanic 1%
Political lean MEDSL · Kingfisher
- 2024 margin
- Solid R (+71.4) · D 13.7% · R 85.1% · Other 1.3%
- 2008→2024 swing
- -3.0pp toward R · 2008: -68.4pp · 2024: -71.4pp
- All cycles
- 2024: R+71.4 2020: R+72.2 2016: R+71.3 2012: R+68.5 2008: R+68.4
Not yet ingested
- Civics
- —
Market trends
- HPI YoY
- ▲ 3.96%
- Current HPI
- 356.8932
- Rent YoY
- —
- Metro
- —
- State GDP YoY
- ▲ 1.55%
- F500 in state
- 6
Industry mix (Fortune 500 HQ in OK)
| Industry | F500 HQs | Revenue |
|---|---|---|
| Energy | 3 | $48B |
|
||
Price history
+880.0% since first listed6 events — show timeline
- 2026-05-15 Price Changed $98,000 MLSOK
- 2026-02-28 Relisted — MLSOK
- 2026-02-16 Pending — MLSOK
- 2025-11-25 Price Changed $114,000 MLSOK
- 2025-08-30 Listed $120,000 MLSOK
- 1994-01-21 Sold (Public Records) $10,000 Public Records
Property tax history
+6.2%/yrLatest (2025): $366 · +13.3% YoY. Source: county tax records.
Cash-flow waterfall
monthlySold comps — $/sqft
last 12 mo · ≤1 miLoading sold comps…