10352 Mayo Trail Rd · Catlettsburg, KY
Flood risk 8/10 · Major
- FEMA flood zone
- X (unshaded)
- Chance of flooding over 30 yrs
- 0.99%
- Est. flood insurance / yr
- $473 – $860
Fire risk 5/10 · Moderate
- Est. fire insurance / yr
- $839 – $1,559
Heat risk 4/10 · Minor
- Hot days now (above 101°F)
- 7 days/yr
- Hot days in 30 yrs
- 20 days/yr
Wind risk 2/10 · Minimal
- Chance of severe wind over 30 yrs
- 1.0%
Air-quality risk 2/10 · Minimal
- Unhealthy air days now
- 0 days/yr
- Unhealthy air days in 30 yrs
- 1 days/yr
Risk factors via First Street. Map © Google.
Why this score? — see what drove the D+ grade
The composite is a weighted blend of 9 inputs, each scored 0–100. Each bar is that input's sub-score; the figure is the points it added to the 100-point composite (weight × sub-score).
- Cash flow +15.5/30.0
- ARV discount +7.5/15.0
- Appreciation +6.5/10.0
- DSCR +4.8/10.0
- Livability +3.4/5.0
- 1% rule +3.1/10.0
- Rent growth +2.5/5.0
- Schools +2.5/10.0
- Condition / age +2.5/5.0
$119,900
🖨 Deal sheet 📄 Offer letter ✓ Due diligence
Listing remarks
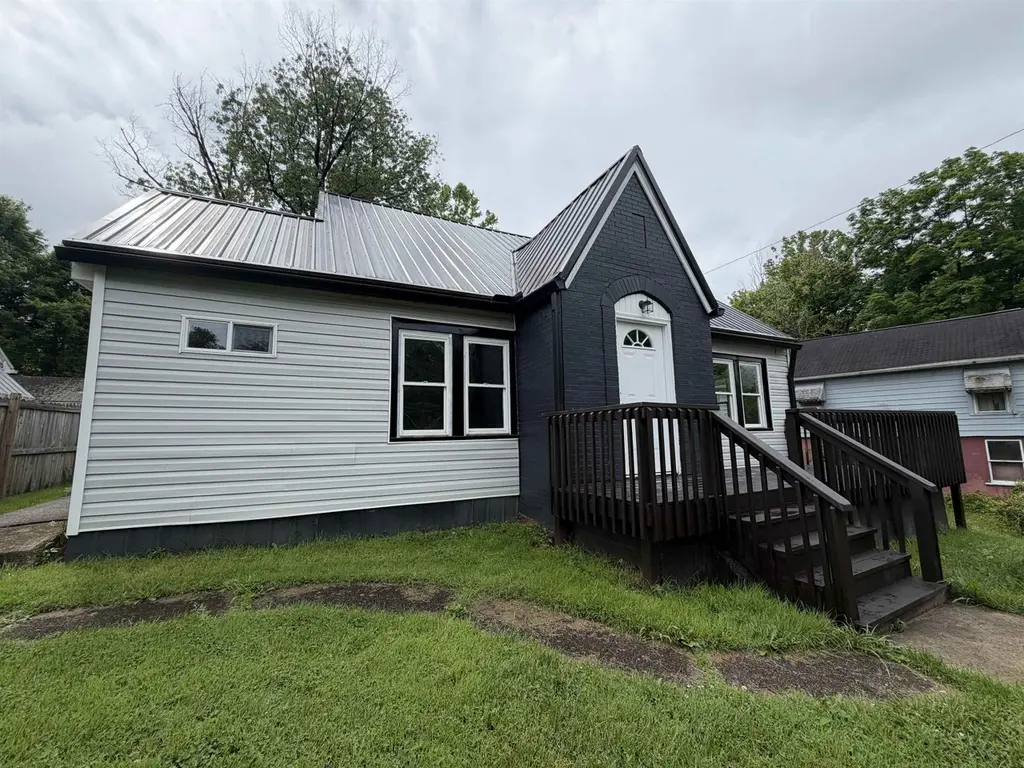
Completely renovated and move-in ready! This charming home at 10352 Mayo Trail Road in Catlettsburg has undergone a major transformation with updates throughout, including newer flooring, fresh paint, a freshly stained deck, roof, electrical, updated kitchen, appliances, bathroom, and HVAC system. Conveniently located just minutes from I-64, this property offers the perfect location for commuters or anyone wanting quick access to Huntington or Grayson. Enjoy the nice yard, side patio, and welcoming front deck—ideal for relaxing or entertaining. Inside, you’ll find spacious closets and additional storage space to fit your needs. Don’t miss your chance to own this beautifull
Key facts
- Updated appliances
- Newer flooring
- Fresh paint
Tags
Property features AI
Exterior
- Parking: No designated parking
- Home design: Single-family residence; One story
- Construction: Metal roof
- Exterior features: Deck; Porch; Level to rolling topography
Interior
- Kitchen: Includes dishwasher, microwave, electric range, refrigerator
- Bedrooms: Total of 6 rooms (bedroom count not specified)
- Bathrooms: 1 full bathroom
- Heating & cooling: Central air conditioning
- Interior features: Dishwasher; Dryer; Microwave; Electric range; Refrigerator; Washer; Basement
- Laundry & utility: Washer and dryer included
Neighborhood map
What this means for you Summary
Snapshot
- This is a 3-bed/1.0-bath single-family listed at $120k.
Deal economics
- At list price, monthly cash flow is $-8 ($-93/yr) — negative.
- To cash-flow at today's rent, offer at most $119k (1.1% below list).
- To meet the 1% rule (rent ≥ 1% of price), the offer needs to be $97k (19.2% below list).
- Recommended offer: $97k (19.2% below list) — sets the bar for 1% rule.
- Cap rate 6.8% vs local median 5.2% in Catlettsburg — meaningfully above typical; check what's discounted (condition, days-on-market, listing class) to confirm the premium yield is real.
Location & tenants
- Location reads 68/100 on livability (#187 in KY) — a middle-class / working-renter tenant base. Strengths: crime A+, cost of living A+, housing B+; Watch: schools D-, amenities F, commute F.
- Boyd County (suburban): math 20% / reading 37% proficiency, ranked #115 of 165 in KY (top 70%) — low school quality limits family demand, transient renter base, plan for 1-2y turnover.
- Market conditions: 46 active listings in the ZIP; 2 units permitted in Boyd County in 2024 (0 in 5+ unit buildings).
Forward outlook
- In year one you build about $5k of equity ($829 loan paydown + $4k appreciation (3.1% local appreciation)).
- Boyd County population projected at -17% by 2050 — secular population decline; favor cash flow + early exit over multi-decade hold.
- At projected returns (3.1% appreciation + 3.0% rent growth), your $34k cash investment doubles in ~7 years — after that, you're playing with house money.
- By year 8, paydown + projected appreciation supports a ~$33k cash-out refi (75% LTV) — recoverable capital for the next deal without selling this one.
Negotiation context
- It's been on market 23 days — a 2% lower offer ($118k) is reasonable based on typical stale-listing flexibility.
- 3 sale attempts since 4y ago with the ask held roughly flat each time — persistent listings suggest the price (not the market) is what's stuck; bring a comps-based counter.
- Current owner paid $15k; list at $120k implies a 699% gain — meaningful room to come down on a strong offer.
Risks & watch-outs
- Watch-outs: flood insurance adds $56/mo.
- Climate carrying-cost: severe flood risk; moderate wildfire risk — expect insurance premiums to compound above CPI over the hold.
Questions for the listing agent
- What do current leases actually rent for vs. the listed asking? Can we see a recent rent roll and the last 12 months of T-12 income?
- What's the actual annual flood-insurance premium (NFIP or private), and is the property in a SFHA with mandatory coverage?
- Is there a deadline driving the sale (1031 exchange, divorce, estate, relocation)? That informs how much negotiation room exists.
- Schools are D-rated, which usually means shorter tenancies and higher turnover. Who's the typical renter profile here, and what's been the actual vacancy rate?
- The area grade is low — what's the realistic commute time and amenity access for the typical tenant pool here? Any planned neighborhood developments (good or bad) we should know about?
- What's the average days-on-market for RENTAL listings here right now (not sales)? A rising rental-DOM trend means longer vacancies and softer asking-rent achievability than the comps imply.
- What's the recent tenant-quality profile in this submarket — average credit score on applications, eviction rate, late-payment / NSF rate, and stable-employment percentage? A property-management company in the area should have these aggregated.
- How much new for-sale + rental construction is in the pipeline within 1–3 miles? Heavy new supply typically softens prices + rents 12–24 months out; constrained supply supports both.
Investment metrics
- 1% rule
- 0.81% ✗
- Cap rate
- 6.77%
- Cash-on-cash
- 1.71%
- DSCR
- 1.08
- GRM
- 10.3
CMA / ARV
No comps found within radius.
Projected returns pro-forma
3.09% appreciation · 3.0% rent growth · sell at horizon
- IRR
- 7.5%
- Equity multiple
- 1.43×
- Total profit
- $14,477
- Equity at exit
- $54,492
- IRR
- 10.1%
- Equity multiple
- 2.54×
- Total profit
- $51,544
- Equity at exit
- $84,432
Cash invested: $33,572 (down + closing). Projections, not guarantees.
Landlord ↔ Tenant lean methodology
- Overall (STATE)
- 83 Strongly Landlord-Friendly
- State Kentucky
- 83 Strongly Landlord-Friendly · R+16
- County
- — inherits STATE
- City
- — inherits STATE
ZIP-level market 41129
- Home prices YoY
- 1.2%
- Active inventory
- 46
- Price-to-rent
- 10.3×
Monthly cashflow live
- Estimated rent
- $969 medium interval (Pro) →
- Mortgage (P&I)
- −$629
- Tax from tax record
- −$39 /mo · $464/yr
- Insurance
- −$50
- Flood insurance flood zone
- −$56 /mo · $666/yr
- HOA
- −$0
- Vacancy / Maint / Mgmt
- −$203
- Net cashflow
- $-8
Break-even live
UW: 25.0% down · 7.5% · 30yr · 1.5% tax · 5.0% vac · 8.0% maint · 8.0% mgmt
Financing live
Cash to close
- Down payment
- $29,975
- Closing costs
- $3,597
- Reserves months
- —
- Total cash needed
- —
Loan-product check · same deal, 3 products live
Conventional
25% down · 7.5% · 30yr
- Down + closing
- —
- Monthly P&I
- —
- Monthly cashflow
- —
- DSCR
- —
- Eligible?
- —
Personal DTI + credit; lowest rate.
DSCR
20% down · 8.5% · 30yr
- Down + closing
- —
- Monthly P&I
- —
- Monthly cashflow
- —
- DSCR
- —
- Eligible?
- —
No personal income docs; deal must DSCR.
Hard money
10% down · 12.0% · 12mo
- Down + closing
- —
- Monthly P&I
- —
- Monthly cashflow
- —
- DSCR
- —
- Eligible?
- —
Short-term bridge; refi at stabilization.
Listing history 24 events
-
2026-06-18days on market $119,900 Active 23 DOM
-
2026-06-17days on market $119,900 Active 22 DOM
-
2026-06-16days on market $119,900 Active 21 DOM
-
2026-06-15days on market $119,900 Active 20 DOM
-
2026-06-13days on market $119,900 Active 18 DOM
-
2026-06-12days on market $119,900 Active 17 DOM
-
2026-06-08days on market $119,900 Active 13 DOM
-
2026-06-07days on market $119,900 Active 12 DOM
-
2026-06-07days on market $119,900 Active 11 DOM
-
2026-06-04days on market $119,900 Active 8 DOM
-
2026-06-02days on market $119,900 Active 7 DOM
-
2026-06-01days on market $119,900 Active 6 DOM
-
2026-05-31days on market $119,900 Active 5 DOM
-
2026-05-31days on market $119,900 Active 4 DOM
-
2026-05-26$119,900 Active
-
2022-12-12soldstatus $15,000 Closed
-
2022-12-05historical Active Under Contract
-
2022-11-09price $20,000
-
2022-10-20price $22,500
-
2022-10-07status Active
-
2022-09-09historical Active Under Contract
-
2022-08-30$25,000 Active
-
2008-08-19soldstatus $30,000
-
2001-09-27soldstatus $25,000
ⓘ Source: listings_history table (triggers on properties + properties_extension) + one-shot
backfill from property_details.listing_events for pre-trigger history.
Tax reassessment forecast KY · Resets to sale price
- Current annual tax
- $464 · $39/mo
- Projected year-2 tax
- $1,031 · $86/mo
- Expected delta
- +$567/yr (+$47/mo · 122.4%)
ⓘ Screening estimate from a state-policy table — verify with the county assessor before closing.
Climate risk First Street
- Flood 8/10 Severe FEMA zone X (unshaded) · 99% chance over 30 yrs
- Wildfire 5/10 Major
- Heat 4/10 Moderate 7 d/yr ≥101°F today · 20 d/yr by 30 yrs out
- Wind 2/10 Low 100% chance of damaging wind over 30 yrs
- Air quality 2/10 Low 0 unhealthy d/yr today · 1 by 30 yrs out
Nearby sold comps map
Loading sold comps map…
Walkable amenities ~0.75 mi
Loading nearby amenities…
Taxation est. · year 1
- Rental income
- $11,623
- − Mortgage interest
- −$6,716
- − Property taxes
- −$464
- − Insurance
- −$1,266
- − Repairs & maintenance
- −$930
- − Management
- −$930
- − Depreciation
- −$3,488
- Taxable loss
- −$2,171
- Est. tax savings @ 24.0%
- +$521
- After-tax cash flow
- $428/yr
For passive investors: Depreciation is non-cash, so a rental often shows a tax loss while cash-flowing — sheltering income. Rental losses are passive: they offset passive income freely, and up to $25,000/yr can offset ordinary (W-2) income if you actively participate and your MAGI is under $100k (phasing out to $0 by $150k); unused losses carry forward. On sale, claimed depreciation is recaptured at up to 25%, and gains may owe capital-gains tax (a 1031 exchange can defer both). Figures are a year-1 estimate at your 24.0% rate — not tax advice; consult a CPA.
Schools (NCES district)
- District
- Boyd County
- NCES district ID
- 2100620
- Math proficiency
- 20% ▼ -18.00%
- Reading proficiency
- 37% ▼ -17.00%
- Median HH income
- $47,479
- Composite
- 24.65/100
- National rank
- #7625
- State rank
- #115 of 165 in KY
Livability — Catlettsburg
- Score
- 68/100
- State rank
- #187
- US rank
- #9459
Category grades
Schools grade is shown separately in the Schools card above.
Census & demographics
- Population (ZIP)
- 8,417
Population outlook (Boyd County) Hauer SSP2
- Today (2025)
- 46,137 people
- By 2030
- 44,585 · -3.4%
- By 2040
- 41,442 · -10.2%
- By 2050
- 38,313 · -17.0%
- By 2075
- 31,077 · -32.6%
- By 2100
- 23,432 · -49.2%
Race, ethnicity, and origin ACS 2023
- Neighborhood character
- Predominantly White (96%)
- Race & ethnicity
- White 96% Two or more races 2% Black 2%
- Common ancestry
- Slovak 2% Serbian 1% Iranian 1%
- Foreign-born
- 0% · Canada
Political lean MEDSL · Boyd
- 2024 margin
- Solid R (+38.5) · D 30.0% · R 68.6% · Other 1.4%
- 2008→2024 swing
- -26.2pp toward R · 2008: -12.3pp · 2024: -38.5pp
- All cycles
- 2024: R+38.5 2020: R+33.2 2016: R+37.0 2012: R+16.3 2008: R+12.3
Not yet ingested
- Civics
- —
Market trends
- HPI YoY
- ▲ 3.09%
- Current HPI
- 265.4897
- Rent YoY
- —
- Metro
- —
- State GDP YoY
- ▲ 1.81%
- F500 in state
- 4
Industry mix (Fortune 500 HQ in KY)
| Industry | F500 HQs | Revenue |
|---|---|---|
| Healthcare | 1 | $118B |
|
||
| Food / Beverage | 1 | $7B |
|
||
Price history
+379.6% since first listed10 events — show timeline
- 2026-05-26 Listed $119,900 AABOR
- 2022-12-12 Sold (MLS) $15,000 AABOR
- 2022-12-05 Contingent — AABOR
- 2022-11-09 Price Changed $20,000 AABOR
- 2022-10-20 Price Changed $22,500 AABOR
- 2022-10-07 Relisted — AABOR
- 2022-09-09 Contingent — AABOR
- 2022-08-30 Listed $25,000 AABOR
- 2008-08-19 Sold (Public Records) $30,000 Public Records
- 2001-09-27 Sold (Public Records) $25,000 Public Records
Property tax history
+53.6%/yrLatest (2025): $464 · -0.7% YoY. Source: county tax records.
Cash-flow waterfall
monthlySold comps — $/sqft
last 12 mo · ≤1 miLoading sold comps…