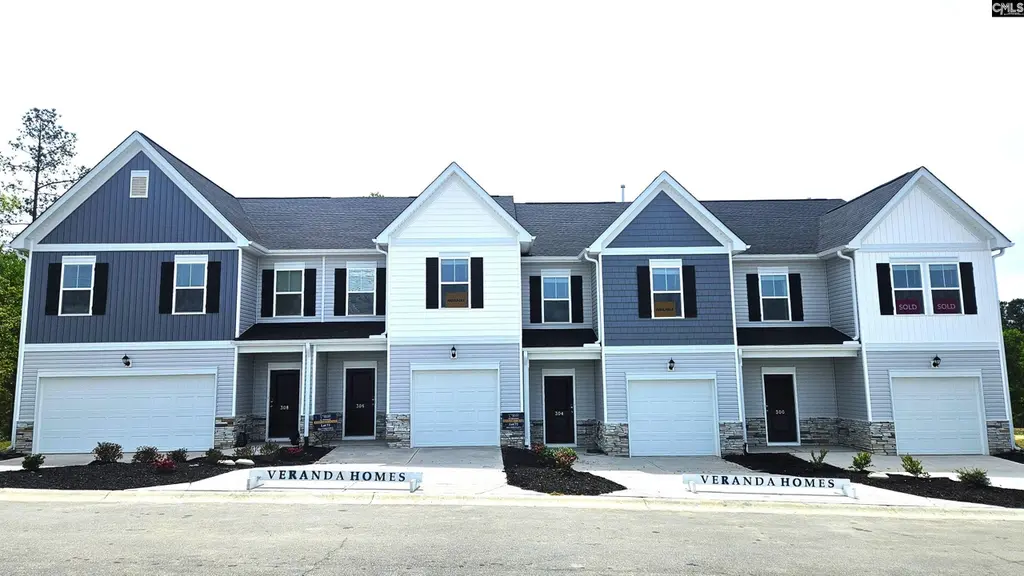
300 Frog Leap Rd · Blythewood, SC
Flood risk No data
- FEMA flood zone
- —
- Chance of flooding over 30 yrs
- —
- Est. flood insurance / yr
- —
Fire risk No data
- Est. fire insurance / yr
- —
Heat risk No data
- Hot days now (above threshold)
- —
- Hot days in 30 yrs
- —
Wind risk No data
- Chance of severe wind over 30 yrs
- —
Air-quality risk No data
- Unhealthy air days now
- —
- Unhealthy air days in 30 yrs
- —
Risk factors via First Street. Map © Google.
Why this score? — see what drove the D- grade
The composite is a weighted blend of 9 inputs, each scored 0–100. Each bar is that input's sub-score; the figure is the points it added to the 100-point composite (weight × sub-score).
- Cash flow +8.2/30.0
- ARV discount +7.5/15.0
- Appreciation +5.0/10.0
- Condition / age +4.0/5.0
- Schools +3.6/10.0
- Livability +3.5/5.0
- 1% rule +3.1/10.0
- Rent growth +2.5/5.0
- DSCR +2.2/10.0
$269,900
🖨 Deal sheet 📄 Offer letter ✓ Due diligence
Listing remarks
Enjoy a spare bedroom on main level with ensuite private full bathroom. Master bedroom & guest bedrooms on second floor just off loft area. Tiled laundry room on 2nd floor next to master bedroom. Master bedroom is uniquely large in this plan. Master bathroom has tiled flooring, white shaker cabinets, quartz countertops. Ceiling fans in master bedroom & great room. Kitchen incl. Whirlpool stainless steel fridge, dishwasher, disposal, built in microwave & gas cooking stove. White shaker cabinets, quartz countertops, tiled backsplash & undermount sink with pull out faucet in kitchen. Recessed can lighting in kitchen. Tons of countertop space with overhang for additional
Key facts
- $123 HOA
- Garage
- Community pool
Neighborhood map
What this means for you Summary
Snapshot
- This is a 4-bed/3.5-bath townhouse listed at $270k. Condition is rated good.
Deal economics
- At list price, monthly cash flow is $-257 ($-3k/yr) — negative.
- To cash-flow at today's rent, offer at most $233k (13.8% below list).
- To meet the 1% rule (rent ≥ 1% of price), the offer needs to be $219k (18.8% below list).
- Recommended offer: $219k (18.8% below list) — sets the bar for 1% rule.
Location & tenants
- Location reads 70/100 on livability (#58 in SC) — a middle-class / working-renter tenant base. Strengths: crime A+, employment A+, housing A+; Watch: amenities F, commute F, health & safety F.
- Richland 02 (suburban): math 35% / reading 47% proficiency, ranked #29 of 80 in SC (top 36%) — families likely to look elsewhere, expect single-tenant / working-renter base with shorter leases.
- Zoned schools: Lake Carolina Elementary Lower Campus (494 students, 49% FRL); Blythewood High (math 72% / reading 92%, grade A, #19 of 196 statewide, top 10%, 2,094 students, 39% FRL).
- Zoned-school proficiency averages 82% at this address vs 41% district-wide (+41 pts) — the actual schools serving this property are materially stronger than the Richland 02 average implies; a family-tenant draw the district grade alone would hide.
- Market conditions: 11 active listings in the ZIP; 7 comparable units currently listed for rent nearby; rentals leasing fast (median 4d on market — plan ~1-2 weeks tenant-placement turnaround); 3,472 units permitted in Richland County in 2024 (1,096 in 5+ unit buildings).
Forward outlook
- In year one you build about $10k of equity ($2k loan paydown + $8k appreciation (3.0% local appreciation)).
- Richland County population projected at +30% by 2050 — long-run rental-demand tailwind backs the buy-and-hold thesis.
- By year 4, paydown + projected appreciation supports a ~$34k cash-out refi (75% LTV) — recoverable capital for the next deal without selling this one.
Negotiation context
- Only 1 days on market — expect competitive offers; lowballing is unlikely to land.
- 2 sale attempts with the ask held roughly flat each time — persistent listings suggest the price (not the market) is what's stuck; bring a comps-based counter.
Questions for the listing agent
- What do current leases actually rent for vs. the listed asking? Can we see a recent rent roll and the last 12 months of T-12 income?
- What does the HOA fee cover, when was the last increase, and are there any pending special assessments or reserve-fund shortfalls?
- Is there a deadline driving the sale (1031 exchange, divorce, estate, relocation)? That informs how much negotiation room exists.
- Schools are B-rated — typically a magnet for longer-tenancy family renters. What's the average tenant stay here, and is there a school-zone premium baked into asking?
- The area grade is low — what's the realistic commute time and amenity access for the typical tenant pool here? Any planned neighborhood developments (good or bad) we should know about?
- What's the average days-on-market for RENTAL listings here right now (not sales)? A rising rental-DOM trend means longer vacancies and softer asking-rent achievability than the comps imply.
- What's the recent tenant-quality profile in this submarket — average credit score on applications, eviction rate, late-payment / NSF rate, and stable-employment percentage? A property-management company in the area should have these aggregated.
- How much new for-sale + rental construction is in the pipeline within 1–3 miles? Heavy new supply typically softens prices + rents 12–24 months out; constrained supply supports both.
Investment metrics
- 1% rule
- 0.81% ✗
- Cap rate
- 5.15%
- Cash-on-cash
- -4.07%
- DSCR
- 0.82
- GRM
- 10.3
CMA / ARV
No comps found within radius.
Projected returns pro-forma
3.0% appreciation · 3.0% rent growth · sell at horizon
- IRR
- 3.7%
- Equity multiple
- 1.22×
- Total profit
- $16,278
- Equity at exit
- $121,359
- IRR
- 7.0%
- Equity multiple
- 2.07×
- Total profit
- $81,045
- Equity at exit
- $187,028
Cash invested: $75,572 (down + closing). Projections, not guarantees.
Landlord ↔ Tenant lean methodology
- Overall (STATE)
- 90 Strongly Landlord-Friendly
- State South Carolina
- 90 Strongly Landlord-Friendly · R+6
- County
- — inherits STATE
- City
- — inherits STATE
ZIP-level market 29016-0000
- Active inventory
- 11
- Price-to-rent
- 10.3×
Monthly cashflow live
- Estimated rent
- $2,192 high interval (Pro) →
- Mortgage (P&I)
- −$1,415
- Tax est. 1.5%
- −$337 /mo · $4,048/yr
- Insurance
- −$112
- HOA
- −$123
- Vacancy / Maint / Mgmt
- −$460
- Net cashflow
- $-257
Break-even live
UW: 25.0% down · 7.5% · 30yr · 1.5% tax · 5.0% vac · 8.0% maint · 8.0% mgmt
Financing live
Cash to close
- Down payment
- $67,475
- Closing costs
- $8,097
- Reserves months
- —
- Total cash needed
- —
Loan-product check · same deal, 3 products live
Conventional
25% down · 7.5% · 30yr
- Down + closing
- —
- Monthly P&I
- —
- Monthly cashflow
- —
- DSCR
- —
- Eligible?
- —
Personal DTI + credit; lowest rate.
DSCR
20% down · 8.5% · 30yr
- Down + closing
- —
- Monthly P&I
- —
- Monthly cashflow
- —
- DSCR
- —
- Eligible?
- —
No personal income docs; deal must DSCR.
Hard money
10% down · 12.0% · 12mo
- Down + closing
- —
- Monthly P&I
- —
- Monthly cashflow
- —
- DSCR
- —
- Eligible?
- —
Short-term bridge; refi at stabilization.
Rent comps 7 comps
| Address | Beds | Baths | Sqft | Rent | $/sqft | DOM | Units | Dist |
|---|---|---|---|---|---|---|---|---|
| 20 Helton Dr Columbia, SC | 1.0–3.0 | 1.0–2.0 | 1167 | $1,899 | $1.63 | 3d | 38 | 0.16mi |
| 223 Sunny Hill DR Blythewood, SC | 3.0 | 3.5 | 1892 | $2,495 | $1.32 | 3d | 1 | 0.20mi |
| 416 Sandfarm Trl Blythewood, SC | 3.0 | 2.5 | 1664 | $2,025 | $1.22 | 23d | 1 | 0.40mi |
| 416 Sandfarm Trl Blythewood, SC | 3.0 | 2.5 | 1664 | $2,025 | $1.22 | 14d | 1 | 0.40mi |
| 7 Back Bay Ct Columbia, SC | 4.0 | 2.5 | 2438 | $2,370 | $0.97 | 3d | 1 | 0.48mi |
| 5 Glendevon Ct Columbia, SC | 5.0 | 2.5 | 2050 | $2,500 | $1.22 | 23d | 1 | 0.95mi |
| 3 Long Glen Ct Columbia, SC | 3.0 | 2.0 | 1314 | $1,849 | $1.41 | 3d | 1 | 1.25mi |
HOA detail
- Monthly dues
- $123 · $1,476/yr
- Likely covers
- gaspool
Listing history 4 events
-
2026-04-13status Pending
-
2026-04-10$269,900 Active
-
2026-04-01historical
-
2026-03-27$261,900
ⓘ Source: listings_history table (triggers on properties + properties_extension) + one-shot
backfill from property_details.listing_events for pre-trigger history.
Nearby sold comps map
Loading sold comps map…
Walkable amenities ~0.75 mi
Loading nearby amenities…
Taxation est. · year 1
- Rental income
- $26,303
- − Mortgage interest
- −$15,119
- − Property taxes
- −$4,048
- − Insurance
- −$1,350
- − Repairs & maintenance
- −$2,104
- − Management
- −$2,104
- − HOA
- −$1,476
- − Depreciation
- −$7,852
- Taxable loss
- −$7,750
- Est. tax savings @ 24.0%
- +$1,860
- After-tax cash flow
- $-1,219/yr
For passive investors: Depreciation is non-cash, so a rental often shows a tax loss while cash-flowing — sheltering income. Rental losses are passive: they offset passive income freely, and up to $25,000/yr can offset ordinary (W-2) income if you actively participate and your MAGI is under $100k (phasing out to $0 by $150k); unused losses carry forward. On sale, claimed depreciation is recaptured at up to 25%, and gains may owe capital-gains tax (a 1031 exchange can defer both). Figures are a year-1 estimate at your 24.0% rate — not tax advice; consult a CPA.
Condition & rehab AI · 13 photos
This townhouse is in good condition with fresh paint and flooring. Minor updates like painting and replacing carpet can significantly enhance its value.
Value-add opportunities
- Both Paint exterior — Fresh paint enhances curb appeal and value
- Both Replace carpet in bedrooms — Carpet is worn and could be replaced with hardwood or tile
- Both Install smart home devices — Modernizes home and adds value
Renovation cost estimate screening
Value-add ROI direction
- Both Paint exterior — Fresh paint enhances curb appeal and value ↑
- Both Replace carpet in bedrooms — Carpet is worn and could be replaced with hardwood or tile ↑
- Both Install smart home devices — Modernizes home and adds value ↑
ⓘ Cost ranges are severity-bucket heuristics (US national rule-of-thumb). Get contractor quotes + a written scope before underwriting a rehab budget.
Schools (NCES district)
- District
- Richland 02
- NCES district ID
- 4503390
- Math proficiency
- 35% ▼ -15.00%
- Reading proficiency
- 47% ▼ -5.00%
- Median HH income
- $59,684
- Composite
- 36.2/100
- National rank
- #4730
- State rank
- #29 of 80 in SC
Livability — Blythewood
- Score
- 70/100
- State rank
- #58
- US rank
- #7406
Category grades
Schools grade is shown separately in the Schools card above.
Census & demographics
No demographic data for this ZIP.
Market trends
- HPI YoY
- —
- Current HPI
- —
- Rent YoY
- —
- Metro
- —
- State GDP YoY
- ▲ 4.51%
- F500 in state
- 2
Industry mix (Fortune 500 HQ in SC)
| Industry | F500 HQs | Revenue |
|---|---|---|
| Packaging | 1 | $7B |
|
||
Price history
+3.1% since first listed4 events — show timeline
- 2026-04-13 Pending — Consolidated MLS
- 2026-04-10 Listed $269,900 Consolidated MLS
- 2026-04-01 Delisted — Consolidated MLS
- 2026-03-27 Listed $261,900 Consolidated MLS
Cash-flow waterfall
monthlySold comps — $/sqft
last 12 mo · ≤1 miLoading sold comps…