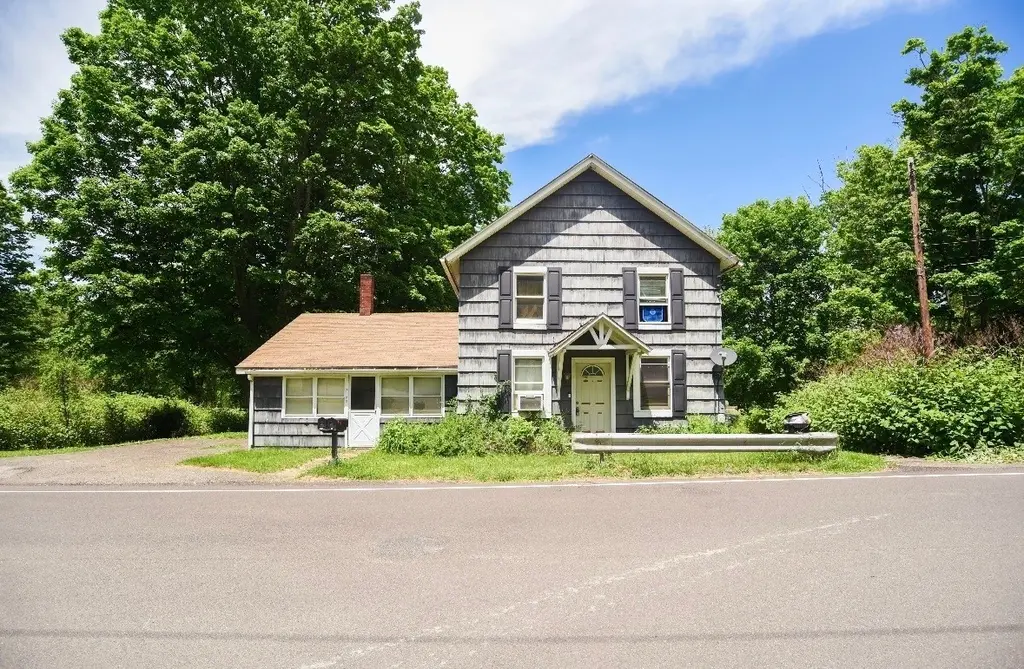
2100 Owego Rd Rd · Endicott, NY
Flood risk 7/10 · Major
- FEMA flood zone
- X
- Chance of flooding over 30 yrs
- 0.99%
- Est. flood insurance / yr
- $473 – $860
Fire risk 3/10 · Minor
- Est. fire insurance / yr
- $691 – $1,283
Heat risk 3/10 · Minor
- Hot days now (above 93°F)
- 8 days/yr
- Hot days in 30 yrs
- 17 days/yr
Wind risk 2/10 · Minimal
- Chance of severe wind over 30 yrs
- 1.0%
Air-quality risk 2/10 · Minimal
- Unhealthy air days now
- 0 days/yr
- Unhealthy air days in 30 yrs
- 1 days/yr
Risk factors via First Street. Map © Google.
Why this score? — see what drove the D+ grade
The composite is a weighted blend of 9 inputs, each scored 0–100. Each bar is that input's sub-score; the figure is the points it added to the 100-point composite (weight × sub-score).
- Cash flow +14.1/30.0
- ARV discount +7.5/15.0
- 1% rule +5.7/10.0
- Schools +5.7/10.0
- DSCR +4.3/10.0
- Livability +3.5/5.0
- Rent growth +2.5/5.0
- Condition / age +2.5/5.0
- Appreciation +0.0/10.0
$195,000
🖨 Deal sheet (PDF) 📄 Offer letter ✓ Due diligence
Listing remarks
Rare Ross Corners investment opportunity!! This property features two single family rental homes on one lot, in a neighborhood where multifamily properties are a rare find. Both tenants are long term, meaning the next owner can step into a stable, low maintenance investment. Tenants pay all utilities including water, helping keep your monthly expenses low and your headaches even lower. House A furnace replaced in 2025, house B is connected to private septic, and a brand new back porch was added this spring! The long term tenants have treated the property like home for years, creating a “set it and forget it” desirable rental setup.
Key facts
- Furnace replaced
- Long term tenants
- Private septic
Tags
Property features AI
Finance
- Other: Zoned residential
- Financial info: Unit 1 rent: $1,050; Unit 2 rent: $1,000
Exterior
- Parking: Driveway
- Utilities: Public water; Public sewer and septic tank; Cable available
- Home design: Duplex residential income property
- Construction: Aluminum siding; Shake siding; Above-grade finished area approximately 2,510
- Exterior features: Porch; Lot is level to sloped down
Interior
- Kitchen: Oven; Range; Refrigerator
- Bedrooms: Unit 1: 4 bedrooms; Unit 2: 4 bedrooms
- Flooring: Carpet; Laminate; Vinyl
- Bathrooms: 2 full bathrooms (total on property); Unit 1: 1 bathroom; Unit 2: 1 bathroom
- Heating & cooling: Forced air heating; Ceiling fan(s)
- Interior features: Gas water heater; Oven; Range; Refrigerator; Carpet, laminate and vinyl flooring; Partial basement
- Laundry & utility: Washer hookup; Electric dryer hookup
Neighborhood map
What this means for you Summary
Snapshot
- This is a 4-bed/1.0-bath other listed at $195k.
Deal economics
- At list price, monthly cash flow is $-28 ($-335/yr) — negative.
- To cash-flow at today's rent, offer at most $190k (2.5% below list).
- Meets the 1% rule at list price ($2k rent vs $195k).
- Recommended offer: $190k (2.5% below list) — sets the bar for cash-flow.
Location & tenants
- Location reads 70/100 on livability (#438 in NY) — a middle-class / working-renter tenant base. Strengths: cost of living A+, health & safety A+, housing A; Watch: amenities D, crime F, commute F.
- Vestal Central School District (suburban): math 63% / reading 68% proficiency, ranked #168 of 590 in NY (top 28%) — acceptable for families but not a draw, mixed tenant base, ~2y average lease; only 17% free/reduced lunch — higher-income household profile.
- Zoned schools: Clayton Avenue Elementary School (math 52% / reading 62%, grade C+, #842 of 2,108 statewide, top 43%, 248 students, 49% FRL); Vestal Middle School (math 45% / reading 64%, grade B-, #214 of 729 statewide, top 31%, 781 students, 31% FRL); Vestal Senior High School (math 100%, 1,000 students, 26% FRL) — zoned schools average 35% FRL vs 17% district-wide (18 pts higher); higher-poverty schools than district average — tighter screening recommended.
- Market conditions: 90 active listings in the ZIP; 340 units permitted in Broome County in 2024 (269 in 5+ unit buildings).
Forward outlook
- Local home prices are declining (-3.0%/yr); year-one equity from $1k of loan paydown is wiped out by about $6k of value loss. Plan a longer hold.
- Broome County population projected at -13% by 2050 — secular population decline; favor cash flow + early exit over multi-decade hold.
Negotiation context
- It's been on market 23 days — a 2% lower offer ($192k) is reasonable based on typical stale-listing flexibility.
- 9 sale attempts since 16y ago; this cycle's ask has dropped $15k (7%) from the opening price — seller is motivated, your offer sets the floor, not the list.
- Current owner paid $65k; list at $195k implies a 200% gain — meaningful room to come down on a strong offer.
Risks & watch-outs
- Watch-outs: property tax is 3.1% of price; flood insurance adds $56/mo; built in 1890 — expect roof / HVAC / electrical / plumbing capex.
- Climate carrying-cost: major flood risk — expect insurance premiums to compound above CPI over the hold.
Questions for the listing agent
- What do current leases actually rent for vs. the listed asking? Can we see a recent rent roll and the last 12 months of T-12 income?
- Built in 1890 — when were the roof, HVAC, electrical panel, plumbing, and water heater last replaced?
- Property tax is high relative to price — has the assessment been appealed recently, and will the sale trigger a re-assessment?
- What's the actual annual flood-insurance premium (NFIP or private), and is the property in a SFHA with mandatory coverage?
- Is there a deadline driving the sale (1031 exchange, divorce, estate, relocation)? That informs how much negotiation room exists.
- Schools are D-rated, which usually means shorter tenancies and higher turnover. Who's the typical renter profile here, and what's been the actual vacancy rate?
- Crime grade is F in this area — have there been break-ins, vandalism, or insurance claims at this property in the last 3 years? What carrier currently insures it and at what premium?
- The area grade is low — what's the realistic commute time and amenity access for the typical tenant pool here? Any planned neighborhood developments (good or bad) we should know about?
- What's the average days-on-market for RENTAL listings here right now (not sales)? A rising rental-DOM trend means longer vacancies and softer asking-rent achievability than the comps imply.
- What's the recent tenant-quality profile in this submarket — average credit score on applications, eviction rate, late-payment / NSF rate, and stable-employment percentage? A property-management company in the area should have these aggregated.
- How much new for-sale + rental construction is in the pipeline within 1–3 miles? Heavy new supply typically softens prices + rents 12–24 months out; constrained supply supports both.
Investment metrics
- 1% rule
- 1.07% ✓
- Cap rate
- 6.46%
- Cash-on-cash
- 0.61%
- DSCR
- 1.03
- GRM
- 7.8
CMA / ARV
No comps found within radius.
Projected returns pro-forma
-3.0% appreciation · 3.0% rent growth · sell at horizon
- IRR
- -17.2%
- Equity multiple
- 0.39×
- Total profit
- $-33,149
- Equity at exit
- $29,075
- IRR
- -8.9%
- Equity multiple
- 0.45×
- Total profit
- $-30,224
- Equity at exit
- $16,860
Cash invested: $54,600 (down + closing). Projections, not guarantees.
Landlord ↔ Tenant lean methodology
- Overall (STATE)
- 15 Strongly Tenant-Friendly
- State New York
- 15 Strongly Tenant-Friendly · D+10
- County
- — inherits STATE
- City
- — inherits STATE
ZIP-level market 13850
- Home prices YoY
- -33.5%
- Active inventory
- 90
- Price-to-rent
- 7.8×
Monthly cashflow live
- Estimated rent
- $2,079 medium interval (Pro) →
- Mortgage (P&I)
- −$1,023
- Tax from tax record
- −$511 /mo · $6,131/yr
- Insurance
- −$81
- Flood insurance flood zone
- −$56 /mo · $666/yr
- HOA
- −$0
- Vacancy / Maint / Mgmt
- −$437
- Net cashflow
- $-28
Break-even live
Sensitivity live
| Price | -10% $82 | -5% $27 | +0% $-28 | +5% $-83 | +10% $-138 |
|---|---|---|---|---|---|
| Rent | -10% $-192 | -5% $-110 | +0% $-28 | +5% $54 | +10% $136 |
| Rate | -1.0pp $70 | -0.5pp $22 | base $-28 | +0.5pp $-78 | +1.0pp $-130 |
UW: 25.0% down · 7.5% · 30yr · 1.5% tax · 5.0% vac · 8.0% maint · 8.0% mgmt
Financing live
Cash to close
- Down payment
- $48,750
- Closing costs
- $5,850
- Reserves months
- —
- Total cash needed
- —
Loan-product check · same deal, 3 products live
Conventional
25% down · 7.5% · 30yr
- Down + closing
- —
- Monthly P&I
- —
- Monthly cashflow
- —
- DSCR
- —
- Eligible?
- —
Personal DTI + credit; lowest rate.
DSCR
20% down · 8.5% · 30yr
- Down + closing
- —
- Monthly P&I
- —
- Monthly cashflow
- —
- DSCR
- —
- Eligible?
- —
No personal income docs; deal must DSCR.
Hard money
10% down · 12.0% · 12mo
- Down + closing
- —
- Monthly P&I
- —
- Monthly cashflow
- —
- DSCR
- —
- Eligible?
- —
Short-term bridge; refi at stabilization.
Listing history 27 events
-
2026-06-21days on market $195,000 Active 23 DOM
-
2026-06-19days on market $195,000 Active 21 DOM
-
2026-06-18price $195,000 Active 20 DOM
-
2026-06-18days on market $210,000 Active 20 DOM
-
2026-06-17days on market $210,000 Active 19 DOM
-
2026-06-16days on market $210,000 Active 18 DOM
-
2026-06-15days on market $210,000 Active 17 DOM
-
2026-06-14days on market $210,000 Active 15 DOM
-
2026-06-13days on market $210,000 Active 14 DOM
-
2026-06-10days on market $210,000 Active 12 DOM
-
2026-06-09days on market $210,000 Active 11 DOM
-
2026-06-08days on market $210,000 Active 10 DOM
-
2026-06-07days on market $210,000 Active 9 DOM
-
2026-06-02days on market $210,000 Active 4 DOM
-
2026-06-01days on market $210,000 Active 3 DOM
-
2026-05-31days on market $210,000 Active 2 DOM
-
2026-05-29$210,000 Active
-
2015-10-15soldstatus $65,000
-
2015-10-15soldstatus $65,000
-
2015-02-02$74,900
-
2015-02-02$74,900
-
2013-06-26$64,900
-
2013-06-26$64,900
-
2012-04-11$79,900
-
2012-04-11$79,900
-
2010-03-07$79,900
-
2010-03-07$79,900
ⓘ Source: listings_history table (triggers on properties + properties_extension) + one-shot
backfill from property_details.listing_events for pre-trigger history.
Tax reassessment forecast NY · Partial reset (capped growth)
- Current annual tax
- $6,131 · $511/mo
- Projected year-2 tax
- $6,131 · $511/mo
- Expected delta
- $0/yr ($0/mo · 0.0%)
ⓘ Screening estimate from a state-policy table — verify with the county assessor before closing.
Climate risk First Street
- Flood 7/10 Severe FEMA zone X · 99% chance over 30 yrs
- Wildfire 3/10 Moderate
- Heat 3/10 Moderate 8 d/yr ≥93°F today · 17 d/yr by 30 yrs out
- Wind 2/10 Low 100% chance of damaging wind over 30 yrs
- Air quality 2/10 Low 0 unhealthy d/yr today · 1 by 30 yrs out
Nearby sold comps map
Loading sold comps map…
Walkable amenities ~0.75 mi
Loading nearby amenities…
Taxation est. · year 1
- Rental income
- $24,947
- − Mortgage interest
- −$10,923
- − Property taxes
- −$6,131
- − Insurance
- −$1,642
- − Repairs & maintenance
- −$1,996
- − Management
- −$1,996
- − Depreciation
- −$5,673
- Taxable loss
- −$3,413
- Est. tax savings @ 24.0%
- +$819
- After-tax cash flow
- $484/yr
For passive investors: Depreciation is non-cash, so a rental often shows a tax loss while cash-flowing — sheltering income. Rental losses are passive: they offset passive income freely, and up to $25,000/yr can offset ordinary (W-2) income if you actively participate and your MAGI is under $100k (phasing out to $0 by $150k); unused losses carry forward. On sale, claimed depreciation is recaptured at up to 25%, and gains may owe capital-gains tax (a 1031 exchange can defer both). Figures are a year-1 estimate at your 24.0% rate — not tax advice; consult a CPA.
Schools (NCES district)
- District
- Vestal Central School District
- NCES district ID
- 3629610
- Math proficiency
- 63% ▼ -7.00%
- Reading proficiency
- 68% ▲ 4.00%
- Median HH income
- $64,143
- Composite
- 56.97/100
- National rank
- #1111
- State rank
- #168 of 590 in NY
Livability — Endicott
- Score
- 70/100
- State rank
- #438
- US rank
- #7657
Category grades
Schools grade is shown separately in the Schools card above.
Census & demographics
- City population
- 42,896
- Population (ZIP)
- 23,675
Population outlook (Broome County) Hauer SSP2
- Today (2025)
- 187,989 people
- By 2030
- 183,066 · -2.6%
- By 2040
- 172,228 · -8.4%
- By 2050
- 163,161 · -13.2%
- By 2075
- 153,641 · -18.3%
- By 2100
- 140,851 · -25.1%
Race, ethnicity, and origin ACS 2023
- Neighborhood character
- Predominantly White (78%)
- Race & ethnicity
- White 78% Asian 12% Hispanic / Latino 5% Two or more races 5% Black 2%
- Hispanic origin (detail)
- Puerto Rican 2%
- Common ancestry
- Romanian 6% Scotch-Irish 2% Italian 2%
- Foreign-born
- 14% · China, Canada, South Korea
- Languages at home
- 84% English-only · Chinese 6% Other Indo-European 5% Other Asian/Pacific 2%
Political lean MEDSL · Broome
- 2024 margin
- Toss-up / Even · D 50.2% · R 49.8%
- 2008→2024 swing
- -7.6pp toward R · 2008: 8.0pp · 2024: 0.4pp
- All cycles
- 2024: D+0.4 2020: D+3.5 2016: R+3.7 2012: D+4.6 2008: D+8.0
Not yet ingested
- Civics
- —
Market trends
- HPI YoY
- ▼ -142.14%
- Current HPI
- 282.4645
- Rent YoY
- —
- Metro
- —
- State GDP YoY
- ▲ 2.60%
- F500 in state
- 92
Industry mix (Fortune 500 HQ in NY)
| Industry | F500 HQs | Revenue |
|---|---|---|
| Financial Services | 10 | $950B |
|
||
| Consumer Goods | 9 | $162B |
|
||
| Insurance | 4 | $225B |
|
||
| Telecommunications | 2 | $144B |
|
||
| Pharmaceuticals | 2 | $112B |
|
||
| Media / Entertainment | 2 | $69B |
|
||
Price history
+162.8% since first listed11 events — show timeline
- 2026-05-29 Listed $210,000 GBAOR
- 2015-10-15 Sold (MLS) $65,000 GBAOR
- 2015-10-15 Sold (MLS) $65,000 GBAOR
- 2015-02-02 Listed $74,900 GBAOR
- 2015-02-02 Listed $74,900 GBAOR
- 2013-06-26 Listed $64,900 GBAOR
- 2013-06-26 Listed $64,900 GBAOR
- 2012-04-11 Listed $79,900 GBAOR
- 2012-04-11 Listed $79,900 GBAOR
- 2010-03-07 Listed $79,900 GBAOR
- 2010-03-07 Listed $79,900 GBAOR
Property tax history
+2.8%/yrLatest (2025): $6,131 · +1.8% YoY. Source: county tax records.
Cash-flow waterfall
monthlySold comps — $/sqft
last 12 mo · ≤1 miLoading sold comps…