421 Sidney St #1 · Houston, TX
Flood risk 6/10 · Moderate
- FEMA flood zone
- X (unshaded)
- Chance of flooding over 30 yrs
- 0.71%
- Est. flood insurance / yr
- $507 – $1,088
Fire risk 1/10 · Minimal
- Est. fire insurance / yr
- $1,222 – $2,270
Heat risk 10/10 · Severe
- Hot days now (above 109°F)
- 7 days/yr
- Hot days in 30 yrs
- 25 days/yr
Wind risk 9/10 · Severe
- Chance of severe wind over 30 yrs
- 99.0%
Air-quality risk 2/10 · Minimal
- Unhealthy air days now
- 2 days/yr
- Unhealthy air days in 30 yrs
- 2 days/yr
Risk factors via First Street. Map © Google.
Why this score? — see what drove the B+ grade
The composite is a weighted blend of 9 inputs, each scored 0–100. Each bar is that input's sub-score; the figure is the points it added to the 100-point composite (weight × sub-score).
- Cash flow +30.0/30.0
- ARV discount +13.7/15.0
- 1% rule +10.0/10.0
- DSCR +10.0/10.0
- Condition / age +4.0/5.0
- Livability +3.7/5.0
- Schools +2.7/10.0
- Rent growth +2.1/5.0
- Appreciation +0.0/10.0
$369,900
🖨 Deal sheet 📄 Offer letter ✓ Due diligence
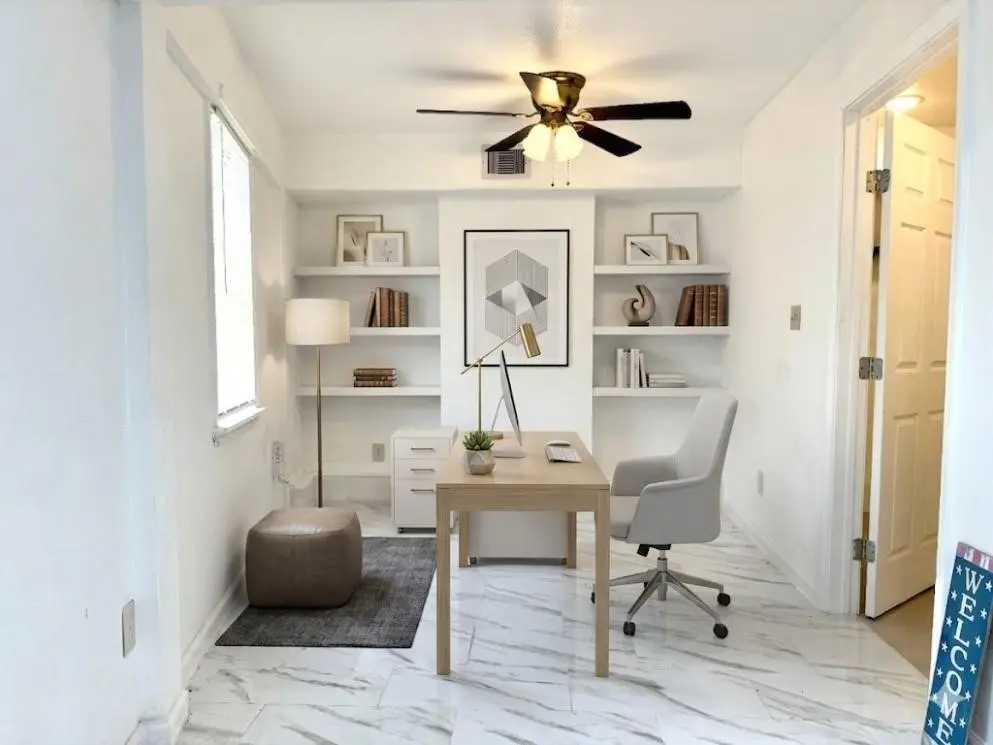
Listing remarks
Stay in 1 home and put the others for Airbnb or rent. What an investment! Two separate homes situated on one lot, offering a total of 5 bedrooms and 2 bathrooms, plus a study that can be converted into an additional bedroom. Recently renovated and well-maintained with fresh paint, recent appliances, and no carpet—featuring laminate and tile flooring throughout. The home also includes a modern quartz countertop. Conveniently located within walking distance to the Metro Rail, providing easy access to Downtown and the University of Houston, and close to sports arenas, restaurants, and other local amenities.
Key facts
- Two separate homes
- Parking
- Built 2004
Tags
Property features AI
Finance
- Financial info: Lease considered
Exterior
- Parking: Additional parking available
- Security: Smoke detectors
- Utilities: Public water; Public sewer
- Home design: Residential property; Built in 2004; Slab foundation; Composition roof
- Construction: Cement siding; Wood siding
- Exterior features: Fenced private yard; Cleared corner lot
Interior
- Kitchen: Dishwasher; Electric oven; Electric range; Microwave; Garbage disposal
- Bedrooms: Up to 6 possible bedrooms; Primary bedrooms on first floor (17x17 and 14x16); Additional bedrooms on second floor (12x12, 12x12) and first floor (13x12)
- Flooring: Tile; Vinyl
- Bathrooms: 2 full bathrooms; Primary bathrooms on first floor
- Heating & cooling: Central heating (electric); Central air conditioning (electric)
- Interior features: High ceilings; Kitchen/family room combo; Kitchen/dining combo; Quartz counters; Ceiling fans; Programmable thermostat
- Laundry & utility: Washer hookup; Electric dryer hookup; Utility rooms on first floor (5x5, 5x5)
Neighborhood map
What this means for you Summary
Snapshot
- This is a 5-bed/2.0-bath townhouse listed at $370k. Condition is rated good.
Deal economics
- At list price, monthly cash flow is $2k ($27k/yr) — positive.
- The deal already cash-flows at list — no discount required.
- Meets the 1% rule at list price ($6k rent vs $370k).
- Cap rate 13.7% vs local median 3.2% in Houston — top-decile yield for the area; either an underpriced asset or a hidden risk that comps aren't pricing in. Stress-test before assuming the spread holds.
Location & tenants
- Location reads 74/100 on livability (#184 in TX, #4,771 nationally) — a middle-class / working-renter tenant base. Strengths: amenities A+, cost of living A+, housing A+; Watch: crime F.
- Houston ISD (urban): math 27% / reading 35% proficiency, ranked #593 of 826 in TX (top 72%) — families likely to look elsewhere, expect single-tenant / working-renter base with shorter leases; 71% free/reduced lunch — lower-income household profile, screen leases tightly.
- Zoned schools: Navarro Middle (math 8% / reading 13%, grade F, #1,639 of 1,662 statewide, top 99%, 547 students, 98% FRL); Austin H S (math 9% / reading 18%, grade F, #1,530 of 1,632 statewide, top 94%, 1,448 students, 97% FRL) — zoned schools average 98% FRL vs 71% district-wide (27 pts higher); higher-poverty schools than district average — tighter screening recommended.
- Zoned-school proficiency averages 12% at this address vs 31% district-wide (-19 pts) — the specific schools serving this property underperform the Houston ISD average; the district grade overstates school quality for this exact location.
- Market conditions: Rents soft (-1.6%/yr); 206 active listings in the ZIP; 6 comparable units currently listed for rent nearby; rentals at typical pace (median 24d on market — plan ~3-4 weeks tenant-placement turnaround); solid renter incomes; 29,883 units permitted in Harris County in 2024 (8,621 in 5+ unit buildings).
- At $6,133/mo this rent would consume 88% of the median local household income ($84k/yr) (locally 572% of renters already pay >50% of income on rent) — very limited rent-growth headroom before tenants either downsize or default.
Forward outlook
- Local home prices are declining (-3.0%/yr); year-one equity from $3k of loan paydown is wiped out by about $11k of value loss. Plan a longer hold.
- Harris County population projected at +47% by 2050 — long-run rental-demand tailwind backs the buy-and-hold thesis.
- At projected returns (-3.0% appreciation + 0.0% rent growth), your $104k cash investment doubles in ~6 years — after that, you're playing with house money.
Negotiation context
- Only 2 days on market — expect competitive offers; lowballing is unlikely to land.
- 6 sale attempts with the ask held roughly flat each time — persistent listings suggest the price (not the market) is what's stuck; bring a comps-based counter.
Risks & watch-outs
- Climate carrying-cost: major flood risk; severe wind risk, 99% chance of damaging wind over 30y; extreme-heat days projected 7→25/yr by 2055 (HVAC capex compounding) — expect insurance premiums to compound above CPI over the hold.
Questions for the listing agent
- Is there a deadline driving the sale (1031 exchange, divorce, estate, relocation)? That informs how much negotiation room exists.
- Schools are D-rated, which usually means shorter tenancies and higher turnover. Who's the typical renter profile here, and what's been the actual vacancy rate?
- Crime grade is F in this area — have there been break-ins, vandalism, or insurance claims at this property in the last 3 years? What carrier currently insures it and at what premium?
- What's the average days-on-market for RENTAL listings here right now (not sales)? A rising rental-DOM trend means longer vacancies and softer asking-rent achievability than the comps imply.
- What's the recent tenant-quality profile in this submarket — average credit score on applications, eviction rate, late-payment / NSF rate, and stable-employment percentage? A property-management company in the area should have these aggregated.
- How much new for-sale + rental construction is in the pipeline within 1–3 miles? Heavy new supply typically softens prices + rents 12–24 months out; constrained supply supports both.
Investment metrics
- 1% rule
- 1.66% ✓
- Cap rate
- 13.72%
- Cash-on-cash
- 26.52%
- DSCR
- 2.18
- GRM
- 5.0
CMA / ARV
- ARV (median comp)
- $428,855
- List price
- $369,900
- Delta
- -13.75%
- Verdict
- UNDERPRICED
- Comps
- 7 within 1.0 mi
Projected returns pro-forma
-3.0% appreciation · 0.0% rent growth · sell at horizon
- IRR
- 16.9%
- Equity multiple
- 1.66×
- Total profit
- $67,971
- Equity at exit
- $55,153
- IRR
- 23.2%
- Equity multiple
- 2.72×
- Total profit
- $177,831
- Equity at exit
- $31,982
Cash invested: $103,572 (down + closing). Projections, not guarantees.
Landlord ↔ Tenant lean methodology
- Overall (STATE)
- 87 Strongly Landlord-Friendly
- State Texas
- 87 Strongly Landlord-Friendly · R+5
- County
- — inherits STATE
- City
- — inherits STATE
ZIP-level market 77003
- Home prices YoY
- -29.2%
- Rents YoY
- -1.6%
- Active inventory
- 206
- Price-to-rent
- 5.0×
Monthly cashflow live
- Estimated rent
- $6,133 medium interval (Pro) →
- Mortgage (P&I)
- −$1,940
- Tax est. 1.5%
- −$462 /mo · $5,548/yr
- Insurance
- −$154
- HOA
- −$0
- Vacancy / Maint / Mgmt
- −$1,288
- Net cashflow
- $2,289
Break-even live
UW: 25.0% down · 7.5% · 30yr · 1.5% tax · 5.0% vac · 8.0% maint · 8.0% mgmt
Financing live
Cash to close
- Down payment
- $92,475
- Closing costs
- $11,097
- Reserves months
- —
- Total cash needed
- —
Loan-product check · same deal, 3 products live
Conventional
25% down · 7.5% · 30yr
- Down + closing
- —
- Monthly P&I
- —
- Monthly cashflow
- —
- DSCR
- —
- Eligible?
- —
Personal DTI + credit; lowest rate.
DSCR
20% down · 8.5% · 30yr
- Down + closing
- —
- Monthly P&I
- —
- Monthly cashflow
- —
- DSCR
- —
- Eligible?
- —
No personal income docs; deal must DSCR.
Hard money
10% down · 12.0% · 12mo
- Down + closing
- —
- Monthly P&I
- —
- Monthly cashflow
- —
- DSCR
- —
- Eligible?
- —
Short-term bridge; refi at stabilization.
Rent comps 6 comps
| Address | Beds | Baths | Sqft | Rent | $/sqft | DOM | Units | Dist |
|---|---|---|---|---|---|---|---|---|
| 4535 Polk St Houston, TX | 5.0 | 4.0 | 3364 | $10,000 | $2.97 | 16d | 1 | 0.47mi |
| 1907 Cullen Blvd Houston, TX | 5.0 | 5.0 | 1990 | $999 | $0.50 | 24d | 1 | 0.93mi |
| 3518 Dennis St Unit 1387517P Houston, TX | 4.0 | 4.0 | 2271 | $5,110 | $2.25 | 14d | 1 | 1.31mi |
| 6403 Avenue C Unit 1019625P Houston, TX | 2.0–8.0 | 1.0–4.0 | 1232 | $5,441 | $4.42 | 2d | 2 | 1.31mi |
| 3719 Elgin St Houston, TX | 1.0–5.0 | 1.0–5.0 | 1241 | $1,899 | $1.53 | 24d | 14 | 1.44mi |
| 3122 Lucinda St Houston, TX | 5.0 | 5.0 | 1984 | $999 | $0.50 | 24d | 1 | 1.45mi |
Listing history 21 events
-
2026-06-18days on market $369,900 Active 2 DOM
-
2026-06-17remarks 611-char remark
-
2026-06-17days on market $369,900 Active 1 DOM
-
2026-06-16days on market $369,900 Active 18 DOM
-
2026-06-15days on market $369,900 Active 17 DOM
-
2026-06-13days on market $369,900 Active 15 DOM
-
2026-06-09days on market $369,900 Active 11 DOM
-
2026-06-08days on market $369,900 Active 10 DOM
-
2026-06-07days on market $369,900 Active 9 DOM
-
2026-06-04days on market $369,900 Active 6 DOM
-
2026-06-03days on market $369,900 Active 5 DOM
-
2026-06-02days on market $369,900 Active 4 DOM
-
2026-06-01days on market $369,900 Active 3 DOM
-
2026-05-31days on market $369,900 Active 2 DOM
-
2026-05-08$369,900 Active 543-char remark
-
2026-05-04historical $1,950
-
2026-03-25price $1,950
-
2026-03-14price $2,050
-
2026-03-05$2,200
-
2026-03-04historical
-
2026-03-03$2,200 Active
ⓘ Source: listings_history table (triggers on properties + properties_extension) + one-shot
backfill from property_details.listing_events for pre-trigger history.
Climate risk First Street
- Flood 6/10 Major FEMA zone X (unshaded) · 71% chance over 30 yrs
- Wildfire 1/10 Low
- Heat 10/10 Extreme 7 d/yr ≥109°F today · 25 d/yr by 30 yrs out
- Wind 9/10 Extreme 99% chance of damaging wind over 30 yrs
- Air quality 2/10 Low 2 unhealthy d/yr today · 2 by 30 yrs out
Nearby sold comps map
Loading sold comps map…
Walkable amenities ~0.75 mi
Loading nearby amenities…
Taxation est. · year 1
- Rental income
- $73,601
- − Mortgage interest
- −$20,720
- − Property taxes
- −$5,548
- − Insurance
- −$1,850
- − Repairs & maintenance
- −$5,888
- − Management
- −$5,888
- − Depreciation
- −$10,761
- Taxable income
- $22,946
- Est. tax owed @ 24.0%
- −$5,507
- After-tax cash flow
- $21,962/yr
For passive investors: Depreciation is non-cash, so a rental often shows a tax loss while cash-flowing — sheltering income. Rental losses are passive: they offset passive income freely, and up to $25,000/yr can offset ordinary (W-2) income if you actively participate and your MAGI is under $100k (phasing out to $0 by $150k); unused losses carry forward. On sale, claimed depreciation is recaptured at up to 25%, and gains may owe capital-gains tax (a 1031 exchange can defer both). Figures are a year-1 estimate at your 24.0% rate — not tax advice; consult a CPA.
Condition & rehab AI · 12 photos
This home is recently renovated and well-maintained, featuring modern finishes and a prime location. It is move-in ready with minimal updates needed to maximize its value.
Value-add opportunities
- Both Painting exterior siding — Enhances curb appeal and value.
- Both Landscaping and yard maintenance — Improves curb appeal and rental value.
- Both Replace light fixtures with energy-efficient ones — Saves on energy costs and enhances aesthetics.
Renovation cost estimate screening
Value-add ROI direction
- Both Painting exterior siding — Enhances curb appeal and value. ↑
- Both Landscaping and yard maintenance — Improves curb appeal and rental value. ↑
- Both Replace light fixtures with energy-efficient ones — Saves on energy costs and enhances aesthetics. ↑
ⓘ Cost ranges are severity-bucket heuristics (US national rule-of-thumb). Get contractor quotes + a written scope before underwriting a rehab budget.
Schools (NCES district)
- District
- Houston ISD
- NCES district ID
- 4823640
- Math proficiency
- 27% ▼ -18.00%
- Reading proficiency
- 35% ▼ -6.00%
- Median HH income
- $46,054
- Composite
- 26.63/100
- National rank
- #7173
- State rank
- #593 of 826 in TX
Livability — Houston
- Score
- 74/100
- State rank
- #184
- US rank
- #4771
Category grades
Schools grade is shown separately in the Schools card above.
Census & demographics
- Census place
- Houston, TX
- County
- Harris County · 4,702,590 people
- City population
- 3,226,434
- Metro
- Houston-The Woodlands-Sugar Land, TX
- Population (ZIP)
- 10,164
- Household income
- $83,980
- Rent vs Own
- Severe rent burden
- 572.0
Population outlook (Harris County) Hauer SSP2
- Today (2025)
- 5,571,493 people
- By 2030
- 6,089,821 · +9.3%
- By 2040
- 7,142,806 · +28.2%
- By 2050
- 8,185,864 · +46.9%
- By 2075
- 10,574,329 · +89.8%
- By 2100
- 12,109,958 · +117.4%
Race, ethnicity, and origin ACS 2023
- Neighborhood character
- Highly diverse neighborhood (Simpson 0.72)
- Race & ethnicity
- Hispanic / Latino 35% White 33% Black 21% Two or more races 20% Asian 6% Native American 1%
- Hispanic origin (detail)
- Mexican 24% Puerto Rican 2% Cuban 2%
- Common ancestry
- Lithuanian 2% Romanian 2% Slovak 1%
- Foreign-born
- 15% · Canada, South Korea, Jamaica
- Languages at home
- 69% English-only · Spanish 27% Korean 2% Other Asian/Pacific 1%
Political lean MEDSL · Harris
- 2024 margin
- Lean D (+5.5) · D 52.0% · R 46.4% · Other 1.6%
- 2008→2024 swing
- +3.9pp toward D · 2008: 1.6pp · 2024: 5.5pp
- All cycles
- 2024: D+5.5 2020: D+13.3 2016: D+12.4 2012: D+0.1 2008: D+1.6
Not yet ingested
- Civics
- —
Market trends
- HPI YoY
- ▼ -53.64%
- Current HPI
- 130.0078
- Rent YoY
- ▼ -1.65%
- Metro
- Houston-The Woodlands-Sugar Land, TX
- State GDP YoY
- ▲ 3.95%
- F500 in state
- 110
Industry mix (Fortune 500 HQ in TX)
| Industry | F500 HQs | Revenue |
|---|---|---|
| Energy | 16 | $1,198B |
|
||
| Technology | 5 | $198B |
|
||
| Engineering / Construction | 4 | $72B |
|
||
| Energy Services | 3 | $60B |
|
||
| Utilities | 3 | $41B |
|
||
| Healthcare | 2 | $330B |
|
||
Price history
+16713.6% since first listed13 events — show timeline
- 2026-06-16 Listed $369,900 HARMLS
- 2026-06-16 Listing Removed — HARMLS
- 2026-06-15 Rental Removed $1,950 HARMLS
- 2026-05-29 Listing Removed — HARMLS
- 2026-05-29 Listed $369,900 HARMLS
- 2026-05-20 Listed for Rent $1,950 HARMLS
- 2026-05-08 Listed $369,900 HARMLS
- 2026-05-04 Rental Removed $1,950 HARMLS
- 2026-03-25 Price Changed $1,950 HARMLS
- 2026-03-14 Price Changed $2,050 HARMLS
- 2026-03-05 Listed for Rent $2,200 HARMLS
- 2026-03-04 Listing Removed — HARMLS
- 2026-03-03 Listed $2,200 HARMLS
Cash-flow waterfall
monthlySold comps — $/sqft
last 12 mo · ≤1 miLoading sold comps…