 🏗️ New Construction
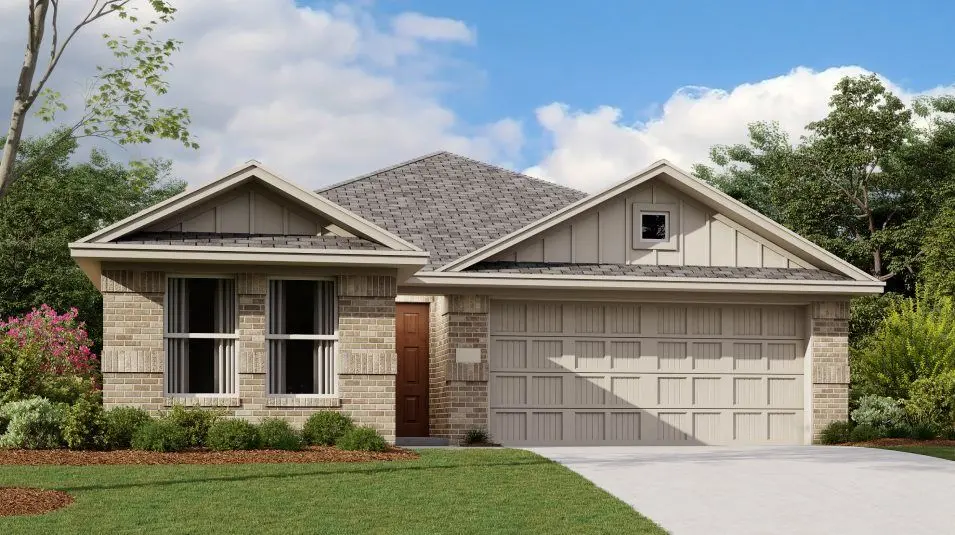
Ashton II Plan · Royse City, TX
Flood risk 1/10 · Minimal
- FEMA flood zone
- X (unshaded)
- Chance of flooding over 30 yrs
- 0.0%
- Est. flood insurance / yr
- $507 – $1,088
Fire risk 5/10 · Moderate
- Est. fire insurance / yr
- $1,222 – $2,270
Heat risk 7/10 · Major
- Hot days now (above 110°F)
- 7 days/yr
- Hot days in 30 yrs
- 23 days/yr
Wind risk 6/10 · Moderate
- Chance of severe wind over 30 yrs
- 27.0%
Air-quality risk 2/10 · Minimal
- Unhealthy air days now
- 1 days/yr
- Unhealthy air days in 30 yrs
- 1 days/yr
Risk factors via First Street. Map © Google.
Why this score? — see what drove the F grade
The composite is a weighted blend of 9 inputs, each scored 0–100. Each bar is that input's sub-score; the figure is the points it added to the 100-point composite (weight × sub-score).
- Cash flow +7.7/30.0
- ARV discount +7.5/15.0
- Condition / age +4.0/5.0
- Schools +3.8/10.0
- Livability +3.8/5.0
- 1% rule +2.3/10.0
- Rent growth +2.2/5.0
- DSCR +1.8/10.0
- Appreciation +0.0/10.0
$281,999
🖨 Deal sheet 📄 Offer letter ✓ Due diligence
Listing remarks MLS
This single-story home offers a great layout with a total of four bedrooms. The main living area showcases an open layout among the kitchen with island, dining room and family room, while a flex room offers a variety of uses. The owner's suite enjoys a private bathroom and roomy walk-in closet, while three secondary bedrooms are located toward the front of the home.
Key facts
- Walk-in closet
- Open layout
- Owner's suite
Tags
Neighborhood map
What this means for you Summary
Snapshot
- This is a 4-bed/2.0-bath single-family listed at $282k. Condition is rated good.
Deal economics
- At list price, monthly cash flow is $-358 ($-4k/yr) — negative.
- To cash-flow at today's rent, offer at most $260k (7.9% below list).
- To meet the 1% rule (rent ≥ 1% of price), the offer needs to be $227k (19.4% below list).
- Recommended offer: $227k (19.4% below list) — sets the bar for 1% rule.
Location & tenants
- Location reads 75/100 on livability (#158 in TX, #4,292 nationally) — a middle-class / working-renter tenant base. Strengths: crime A+, employment A+, housing A+; Watch: schools C-, amenities F, commute F.
- Royse City ISD (rural): math 42% / reading 42% proficiency, ranked #266 of 826 in TX (top 32%) — families likely to look elsewhere, expect single-tenant / working-renter base with shorter leases.
- Market conditions: Rents soft (-1.1%/yr); 1288 active listings in the ZIP; 40 comparable units currently listed for rent nearby; rentals at typical pace (median 15d on market — plan ~3-4 weeks tenant-placement turnaround); high-income renter base; 1,289 units permitted in Hunt County in 2024 (527 in 5+ unit buildings).
Forward outlook
- Local home prices are declining (-3.0%/yr); year-one equity from $2k of loan paydown is wiped out by about $9k of value loss. Plan a longer hold.
- Hunt County population projected at +15% by 2050 — modest demand growth; plan on rents tracking national, not racing it.
Negotiation context
- It's been on market 681 days — a 12% lower offer ($248k) is reasonable based on typical stale-listing flexibility.
Risks & watch-outs
- Climate carrying-cost: major wind risk, 27% chance of damaging wind over 30y; moderate wildfire risk; extreme-heat days projected 7→23/yr by 2055 (HVAC capex compounding) — expect insurance premiums to compound above CPI over the hold.
Questions for the listing agent
- What do current leases actually rent for vs. the listed asking? Can we see a recent rent roll and the last 12 months of T-12 income?
- It's been on market 681 days. Have you received any prior offers? Is the seller open to a 19% concession, seller financing, or rate buy-down credit?
- Why hasn't it sold? Are there any deal-killer items the seller is aware of (foundation, flood, title, zoning, code violations)?
- Is there a deadline driving the sale (1031 exchange, divorce, estate, relocation)? That informs how much negotiation room exists.
- The area grade is low — what's the realistic commute time and amenity access for the typical tenant pool here? Any planned neighborhood developments (good or bad) we should know about?
- What's the average days-on-market for RENTAL listings here right now (not sales)? A rising rental-DOM trend means longer vacancies and softer asking-rent achievability than the comps imply.
- What's the recent tenant-quality profile in this submarket — average credit score on applications, eviction rate, late-payment / NSF rate, and stable-employment percentage? A property-management company in the area should have these aggregated.
- How much new for-sale + rental construction is in the pipeline within 1–3 miles? Heavy new supply typically softens prices + rents 12–24 months out; constrained supply supports both.
Investment metrics
- 1% rule
- 0.73% ✗
- Cap rate
- 4.92%
- Cash-on-cash
- -4.92%
- DSCR
- 0.78
- GRM
- 11.4
CMA / ARV
- ARV (median comp)
- $311,592
- List price
- $281,999
- Delta
- -9.50%
- Verdict
- FAIR
- Comps
- 20 within 1.0 mi
Show comp detail 12 sales within ~0.75 mi
| Address | Dist | Beds/Ba | Sqft | Sold | Price | $/sf | Match |
|---|---|---|---|---|---|---|---|
| 1229 Cedar Cove Pl | 0.13mi | 3/2.0 (-1) | 1,884 (+2%) | 3mo | $250,000 | $133 | 83 |
| 3017 Oak Crest Dr | 0.19mi | 3/2.0 (-1) | 1,864 (+1%) | 3mo | $299,999 | $161 | 82 |
| 3112 Burwood Ln | 0.15mi | 3/2.0 (-1) | 1,720 (-7%) | 2mo | $249,900 | $145 | 75 |
| 1213 River Oak Ln | 0.25mi | 4/2.0 | 1,960 (+6%) | 6mo | $251,000 | $128 | 73 |
| 1228 Koto Wood Dr | 0.27mi | 3/2.0 (-1) | 1,608 (-13%) | 1mo | $269,000 | $167 | 60 |
| 124 Sutter Ln | 0.57mi | 4/2.0 | 1,958 (+6%) | 5mo | $285,000 | $146 | 59 |
| 1328 Alder Tree Ln | 0.49mi | 4/2.5 | 2,007 (+9%) | 7mo | $250,000 | $125 | 55 |
| 1217 Acacia Dr | 0.64mi | 4/2.0 | 1,996 (+8%) | 4mo | $298,490 | $150 | 54 |
| 216 Sunny Corner Rd | 0.71mi | 4/2.0 | 2,046 (+11%) | 6mo | $250,000 | $122 | 44 |
| 1017 Whispering Oak Dr | 0.66mi | 4/3.0 | 2,097 (+14%) | 2mo | $295,000 | $141 | 41 |
| 3229 Sunny Hill Way | 0.73mi | 3/2.0 (-1) | 2,023 (+10%) | 6mo | $285,000 | $141 | 40 |
| 1828 Elderberry St | 0.75mi | 3/2.0 (-1) | 1,622 (-12%) | 2mo | $250,000 | $154 | 38 |
Match score weights: distance 35% · size 25% · config 20% · recency 20%. Top-matched comps best support the ARV.
Projected returns pro-forma
-3.0% appreciation · 0.0% rent growth · sell at horizon
- IRR
- -28.0%
- Equity multiple
- 0.08×
- Total profit
- $-79,899
- Equity at exit
- $46,459
- IRR
- -43.5%
- Equity multiple
- -0.43×
- Total profit
- $-124,513
- Equity at exit
- $26,941
Cash invested: $87,246 (down + closing). Projections, not guarantees.
Landlord ↔ Tenant lean methodology
- Overall (STATE)
- 87 Strongly Landlord-Friendly
- State Texas
- 87 Strongly Landlord-Friendly · R+5
- County
- — inherits STATE
- City
- — inherits STATE
ZIP-level market 75189
- Home prices YoY
- -25.0%
- Rents YoY
- -1.1%
- Active inventory
- 1288
- Price-to-rent
- 10.3×
Monthly cashflow live
- Estimated rent
- $2,273 high interval (Pro) →
- Mortgage (P&I)
- −$1,634
- Tax est. 1.5%
- −$389 /mo · $4,674/yr
- Insurance
- −$130
- HOA
- −$0
- Vacancy / Maint / Mgmt
- −$477
- Net cashflow
- $-358
Break-even live
UW: 25.0% down · 7.5% · 30yr · 1.5% tax · 5.0% vac · 8.0% maint · 8.0% mgmt
Financing live
Cash to close
- Down payment
- $77,898
- Closing costs
- $9,348
- Reserves months
- —
- Total cash needed
- —
Loan-product check · same deal, 3 products live
Conventional
25% down · 7.5% · 30yr
- Down + closing
- —
- Monthly P&I
- —
- Monthly cashflow
- —
- DSCR
- —
- Eligible?
- —
Personal DTI + credit; lowest rate.
DSCR
20% down · 8.5% · 30yr
- Down + closing
- —
- Monthly P&I
- —
- Monthly cashflow
- —
- DSCR
- —
- Eligible?
- —
No personal income docs; deal must DSCR.
Hard money
10% down · 12.0% · 12mo
- Down + closing
- —
- Monthly P&I
- —
- Monthly cashflow
- —
- DSCR
- —
- Eligible?
- —
Short-term bridge; refi at stabilization.
Rent comps 40 comps
| Address | Beds | Baths | Sqft | Rent | $/sqft | DOM | Units | Dist |
|---|---|---|---|---|---|---|---|---|
| 3008 Lakewood Ln Royse City, TX | 4.0 | 3.0 | 2364 | $2,099 | $0.89 | 2d | 1 | 0.04mi |
| 1204 Cedar Cove Pl Royse City, TX | 3.0 | 2.0 | 1450 | $1,925 | $1.33 | 24d | 1 | 0.18mi |
| 3105 Oak Crest Dr Royse City, TX | 3.0 | 2.0 | 1864 | $1,929 | $1.03 | 22d | 1 | 0.18mi |
| 1328 River Oak Ln Royse City, TX | 4.0 | 2.0 | 2196 | $2,400 | $1.09 | 3d | 1 | 0.36mi |
| 1309 Honeywood Ln Royse City, TX | 3.0 | 2.0 | 1514 | $1,796 | $1.19 | 3d | 1 | 0.39mi |
| 1225 Alder Tree Ln Royse City, TX | 3.0 | 2.5 | 2181 | $2,000 | $0.92 | 3d | 1 | 0.45mi |
| 1216 Alder Tree Ln Royse City, TX | 4.0 | 2.5 | 2260 | $2,029 | $0.90 | 3d | 1 | 0.48mi |
| 1125 Silver Maple Ln Royse City, TX | 3.0 | 2.0 | 1590 | $1,895 | $1.19 | 24d | 1 | 0.52mi |
| 1125 Silver Maple Ln Royse City, TX | 3.0 | 2.0 | 1444 | $1,895 | $1.31 | 44d | 1 | 0.52mi |
| 1312 Silver Maple Ln Royse City, TX | 3.0 | 2.5 | 1406 | $1,695 | $1.21 | 44d | 1 | 0.53mi |
| 1817 Acacia Dr Royse City, TX | 4.0 | 3.0 | 2118 | $2,000 | $0.94 | 14d | 1 | 0.59mi |
| 3213 Shady River Trl Royse City, TX | 3.0 | 2.0 | 1858 | $1,849 | $1.00 | 22d | 1 | 0.61mi |
| 1004 Basswood Ln Royse City, TX | 4.0 | 2.0 | 2097 | $1,995 | $0.95 | 15d | 1 | 0.62mi |
| 523 Francis Ln Royse City, TX | 4.0 | 3.0 | 2029 | $2,299 | $1.13 | 44d | 1 | 0.67mi |
| 1825 Damianita Dr Royse City, TX | 4.0 | 2.0 | 1999 | $2,100 | $1.05 | 15d | 1 | 0.69mi |
| 2113 Tulipwood Dr Royse City, TX | 4.0 | 2.0 | 1857 | $2,075 | $1.12 | 2d | 1 | 0.70mi |
| 1828 Elderberry St Royse City, TX | 3.0 | 2.0 | 1907 | $1,995 | $1.05 | 15d | 1 | 0.71mi |
| 208 Sunny Corner Rd Royse City, TX | 3.0 | 2.0 | 1780 | $1,695 | $0.95 | 20d | 1 | 0.72mi |
| 2124 Tulipwood Dr Royse City, TX | 4.0 | 2.0 | 1703 | $2,200 | $1.29 | 19d | 1 | 0.73mi |
| 2128 Whispering Sage Blvd Royse City, TX | 4.0 | 2.5 | 2306 | $2,400 | $1.04 | 24d | 1 | 0.74mi |
| 2133 Tulipwood Dr Royse City, TX | 4.0 | 2.0 | 1770 | $2,295 | $1.30 | 44d | 1 | 0.75mi |
| 1916 Elderberry St Royse City, TX | 3.0 | 2.0 | 1654 | $2,059 | $1.24 | 1d | 1 | 0.79mi |
| 2134 Donker Dr Royse City, TX | 4.0 | 2.0 | 1838 | $1,950 | $1.06 | 1d | 1 | 0.80mi |
| 2117 Berrywood Dr Royse City, TX | 4.0 | 2.0 | 1703 | $2,095 | $1.23 | 3d | 1 | 0.81mi |
| 2117 Berrywood Dr Royse City, TX | 4.0 | 2.0 | 1706 | $2,095 | $1.23 | 1d | 1 | 0.81mi |
| 1817 Grassland Dr Royse City, TX | 3.0 | 2.0 | 1763 | $2,200 | $1.25 | 3d | 1 | 0.81mi |
| 2141 Donker Dr Royse City, TX | 4.0 | 2.0 | 1838 | $1,850 | $1.01 | 15d | 1 | 0.82mi |
| 2141 Donker Dr Royse City, TX | 4.0 | 2.0 | 1838 | $1,850 | $1.01 | 3d | 1 | 0.82mi |
| 1226 Banyan Dr Royse City, TX | 4.0 | 2.0 | 1996 | $1,895 | $0.95 | 19d | 1 | 0.85mi |
| 1813 Huisache St Royse City, TX | 3.0 | 2.0 | 1600 | $1,895 | $1.18 | 19d | 1 | 0.85mi |
| 1944 Fox Glove St Royse City, TX | 4.0 | 2.0 | 1478 | $1,795 | $1.21 | 44d | 1 | 0.88mi |
| 3140 Overlook Dr Royse City, TX | 4.0 | 2.0 | 1866 | $2,200 | $1.18 | 44d | 1 | 0.88mi |
| 3136 Overlook Dr Royse City, TX | 4.0 | 2.0 | 2046 | $2,295 | $1.12 | 44d | 1 | 0.89mi |
| 3136 Overlook Dr Royse City, TX | 4.0 | 2.0 | 2046 | $2,295 | $1.12 | 3d | 1 | 0.89mi |
| 1937 Huisache St Royse City, TX | 4.0 | 2.0 | 1999 | $2,350 | $1.18 | 1d | 1 | 0.97mi |
| 1844 Javelina St Royse City, TX | 4.0 | 2.0 | 1720 | $2,295 | $1.33 | 4d | 1 | 0.97mi |
| 1852 Javelina St Royse City, TX | 4.0 | 2.0 | 1900 | $2,200 | $1.16 | 21d | 1 | 0.97mi |
| 3000 Buttonbush Dr Royse City, TX | 4.0 | 2.0 | 1892 | $1,895 | $1.00 | 15d | 1 | 1.04mi |
| 1944 Javelina St Royse City, TX | 3.0 | 2.0 | 1934 | $2,195 | $1.13 | 1d | 1 | 1.05mi |
| 1825 Lotus St Royse City, TX | 4.0 | 2.0 | 1996 | $2,195 | $1.10 | 3d | 1 | 1.07mi |
Listing history 16 events
-
2026-06-18days on market $281,999 Active 681 DOM
-
2026-06-17days on market $281,999 Active 680 DOM
-
2026-06-16days on market $281,999 Active 679 DOM
-
2026-06-15days on market $281,999 Active 678 DOM
-
2026-06-13days on market $281,999 Active 676 DOM
-
2026-06-09days on market $281,999 Active 672 DOM
-
2026-06-08days on market $281,999 Active 671 DOM
-
2026-06-07days on market $281,999 Active 670 DOM
-
2026-06-04days on market $281,999 Active 667 DOM
-
2026-06-03days on market $281,999 Active 666 DOM
-
2026-06-02days on market $281,999 Active 665 DOM
-
2026-06-01days on market $281,999 Active 664 DOM
-
2026-05-31days on market $281,999 Active 663 DOM
-
2024-09-28price $281,999 368-char remark
Show marketing remark (368 chars)
This single-story home offers a great layout with a total of four bedrooms. The main living area showcases an open layout among the kitchen with island, dining room and family room, while a flex room offers a variety of uses. The owner's suite enjoys a private bathroom and roomy walk-in closet, while three secondary bedrooms are located toward the front of the home.
-
2024-09-07price $278,999 368-char remark
Show marketing remark (368 chars)
This single-story home offers a great layout with a total of four bedrooms. The main living area showcases an open layout among the kitchen with island, dining room and family room, while a flex room offers a variety of uses. The owner's suite enjoys a private bathroom and roomy walk-in closet, while three secondary bedrooms are located toward the front of the home.
-
2024-08-06$277,999 Active 368-char remark
Show marketing remark (368 chars)
This single-story home offers a great layout with a total of four bedrooms. The main living area showcases an open layout among the kitchen with island, dining room and family room, while a flex room offers a variety of uses. The owner's suite enjoys a private bathroom and roomy walk-in closet, while three secondary bedrooms are located toward the front of the home.
ⓘ Source: listings_history table (triggers on properties + properties_extension) + one-shot
backfill from property_details.listing_events for pre-trigger history.
Climate risk First Street
- Flood 1/10 Low FEMA zone X (unshaded) · 0% chance over 30 yrs
- Wildfire 5/10 Major
- Heat 7/10 Severe 7 d/yr ≥110°F today · 23 d/yr by 30 yrs out
- Wind 6/10 Major 27% chance of damaging wind over 30 yrs
- Air quality 2/10 Low 1 unhealthy d/yr today · 1 by 30 yrs out
Nearby sold comps map
Loading sold comps map…
Walkable amenities ~0.75 mi
Loading nearby amenities…
Taxation est. · year 1
- Rental income
- $27,276
- − Mortgage interest
- −$17,454
- − Property taxes
- −$4,674
- − Insurance
- −$1,558
- − Repairs & maintenance
- −$2,182
- − Management
- −$2,182
- − Depreciation
- −$9,065
- Taxable loss
- −$9,839
- Est. tax savings @ 24.0%
- +$2,361
- After-tax cash flow
- $-1,931/yr
For passive investors: Depreciation is non-cash, so a rental often shows a tax loss while cash-flowing — sheltering income. Rental losses are passive: they offset passive income freely, and up to $25,000/yr can offset ordinary (W-2) income if you actively participate and your MAGI is under $100k (phasing out to $0 by $150k); unused losses carry forward. On sale, claimed depreciation is recaptured at up to 25%, and gains may owe capital-gains tax (a 1031 exchange can defer both). Figures are a year-1 estimate at your 24.0% rate — not tax advice; consult a CPA.
Condition & rehab AI · 12 photos
This single-story home is in good condition with modern appliances and fresh paint. It offers a good layout with four bedrooms and two bathrooms. The property has a good curb appeal and is ready for a new owner.
Value-add opportunities
- Both Painting exterior and interior walls — Fresh paint can enhance curb appeal and interior aesthetics
- Both Landscaping improvements — Well-maintained landscaping can increase curb appeal and property value
- Resale Kitchen appliances — Modern appliances can attract more buyers
- Resale Bathroom fixtures — Modern fixtures can attract more buyers
Renovation cost estimate screening
Value-add ROI direction
- Both Painting exterior and interior walls — Fresh paint can enhance curb appeal and interior aesthetics ↑
- Both Landscaping improvements — Well-maintained landscaping can increase curb appeal and property value ↑
- Resale Kitchen appliances — Modern appliances can attract more buyers ↑
- Resale Bathroom fixtures — Modern fixtures can attract more buyers ↑
ⓘ Cost ranges are severity-bucket heuristics (US national rule-of-thumb). Get contractor quotes + a written scope before underwriting a rehab budget.
Schools (NCES district)
- District
- Royse City ISD
- NCES district ID
- 4838220
- Math proficiency
- 42% ▼ -10.00%
- Reading proficiency
- 42% ▼ -5.00%
- Median HH income
- $73,810
- Composite
- 38.44/100
- National rank
- #4197
- State rank
- #266 of 826 in TX
Livability — Royse City
- Score
- 75/100
- State rank
- #158
- US rank
- #4292
Category grades
Schools grade is shown separately in the Schools card above.
Census & demographics
- County
- Rockwall County · 132,930 people
- City population
- 48,739
- Metro
- Dallas-Fort Worth-Arlington, TX
- Population (ZIP)
- 48,739
- Household income
- $117,125
- Rent vs Own
- Severe rent burden
- 569.0
Population outlook (Hunt County) Hauer SSP2
- Today (2025)
- 97,090 people
- By 2030
- 100,452 · +3.5%
- By 2040
- 106,544 · +9.7%
- By 2050
- 111,218 · +14.6%
- By 2075
- 121,695 · +25.3%
- By 2100
- 123,683 · +27.4%
Race, ethnicity, and origin ACS 2023
- Neighborhood character
- Diverse neighborhood (Simpson 0.57)
- Race & ethnicity
- White 60% Hispanic / Latino 25% Two or more races 12% Black 10% Asian 2%
- Hispanic origin (detail)
- Mexican 20%
- Common ancestry
- Slovak 2% Serbian 1% Lithuanian 1%
- Foreign-born
- 10% · Canada, Philippines, Jamaica
- Languages at home
- 80% English-only · Spanish 15% Other Indo-European 1%
Political lean MEDSL · Hunt
- 2024 margin
- Solid R (+55.5) · D 21.9% · R 77.4%
- 2008→2024 swing
- -14.9pp toward R · 2008: -40.6pp · 2024: -55.5pp
- All cycles
- 2024: R+55.5 2020: R+52.5 2016: R+56.3 2012: R+51.2 2008: R+40.6
Not yet ingested
- Civics
- —
Market trends
- HPI YoY
- ▼ -71.10%
- Current HPI
- 212.8422
- Rent YoY
- ▼ -1.13%
- Metro
- Dallas-Fort Worth-Arlington, TX
- State GDP YoY
- ▲ 3.95%
- F500 in state
- 110
Industry mix (Fortune 500 HQ in TX)
| Industry | F500 HQs | Revenue |
|---|---|---|
| Energy | 16 | $1,198B |
|
||
| Technology | 5 | $198B |
|
||
| Engineering / Construction | 4 | $72B |
|
||
| Energy Services | 3 | $60B |
|
||
| Utilities | 3 | $41B |
|
||
| Healthcare | 2 | $330B |
|
||
Price history
+1.4% since first listed3 events — show timeline
- 2024-09-28 Price Changed $281,999 Zillow
- 2024-09-07 Price Changed $278,999 Zillow
- 2024-08-06 Listed $277,999 Zillow
Cash-flow waterfall
monthlySold comps — $/sqft
last 12 mo · ≤1 miLoading sold comps…