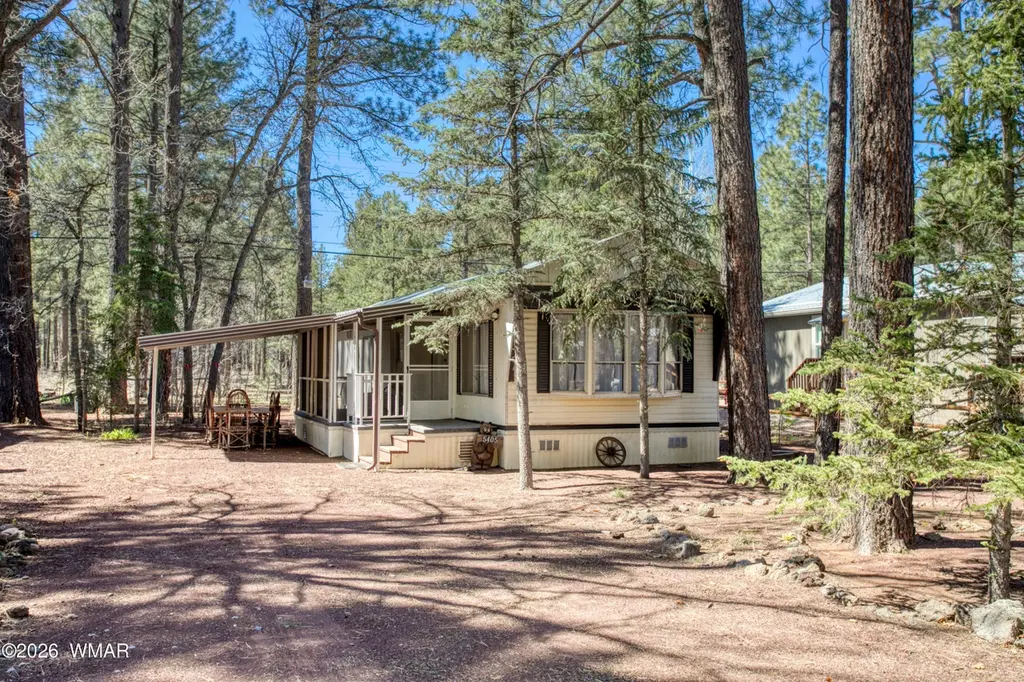
5405 S Blue Ridge Loop · Pinetop Country Club, AZ
Flood risk 1/10 · Minimal
- FEMA flood zone
- X (unshaded)
- Chance of flooding over 30 yrs
- 0.0%
- Est. flood insurance / yr
- $507 – $1,088
Fire risk 8/10 · Major
- Est. fire insurance / yr
- $610 – $1,132
Heat risk 1/10 · Minimal
- Hot days now (above 86°F)
- 7 days/yr
- Hot days in 30 yrs
- 17 days/yr
Wind risk 1/10 · Minimal
- Chance of severe wind over 30 yrs
- —
Air-quality risk 2/10 · Minimal
- Unhealthy air days now
- 1 days/yr
- Unhealthy air days in 30 yrs
- 1 days/yr
Risk factors via First Street. Map © Google.
Why this score? — see what drove the D grade
The composite is a weighted blend of 9 inputs, each scored 0–100. Each bar is that input's sub-score; the figure is the points it added to the 100-point composite (weight × sub-score).
- Cash flow +15.7/30.0
- ARV discount +8.8/15.0
- DSCR +4.8/10.0
- 1% rule +3.2/10.0
- Livability +3.2/5.0
- Rent growth +2.5/5.0
- Condition / age +2.5/5.0
- Schools +2.2/10.0
- Appreciation +0.0/10.0
$190,000
🖨 Deal sheet (PDF) 📄 Offer letter ✓ Due diligence
Listing remarks
Located in Pinetop Lakes Mobile Homes Bordering Reservation. Carport w/ shed for extra storage. Sigle wide two bedroom, one bath being sold FURNISHED. Laminate floors, wood burn stove. Screened porches front and back. Includes membership to Pinetop Lakes Recreation Center offering, pickle ball, swimming, tennis, pickleball and exercise facility. Close to Pinetop Lakes Golf and Country Club which is open to the public. Executive eighteen hole Golf Course. No sight unseen offers. Seller is a licensed Realtor in the state of Arizona
Key facts
- Shed
- Carport
- Screened porches
Tags
Neighborhood map
What this means for you Summary
Snapshot
- This is a 2-bed/1.0-bath manufactured listed at $190k.
Deal economics
- At list price, monthly cash flow is $83 ($996/yr) — positive.
- The deal already cash-flows at list — no discount required.
- To meet the 1% rule (rent ≥ 1% of price), the offer needs to be $157k (17.6% below list).
- Recommended offer: $157k (17.6% below list) — sets the bar for 1% rule.
- Cap rate 6.8% vs local median 2.8% in Pinetop Country Club — top-decile yield for the area; either an underpriced asset or a hidden risk that comps aren't pricing in. Stress-test before assuming the spread holds.
Location & tenants
- Location reads 64/100 on livability (#105 in AZ) — a middle-class / working-renter tenant base. Strengths: crime A+, employment A-, housing A-; Watch: amenities F, commute F, health & safety F.
- Blue Ridge Unified School District No. 32 (4397) (town): math 21% / reading 29% proficiency, ranked #139 of 249 in AZ (top 56%) — low school quality limits family demand, transient renter base, plan for 1-2y turnover.
- Zoned schools: Blue Ridge Elementary School (math 20% / reading 30%, grade F, #638 of 1,109 statewide, top 58%, 818 students, 60% FRL); Blue Ridge Jr High School (math 21% / reading 26%, grade F, #113 of 218 statewide, top 53%, 267 students, 64% FRL); Blue Ridge High School (math 27% / reading 32%, grade F, #120 of 381 statewide, top 34%, 669 students, 49% FRL).
- Market conditions: 253 active listings in the ZIP; 485 units permitted in Navajo County in 2024 (11 in 5+ unit buildings).
Forward outlook
- Local home prices are declining (-3.0%/yr); year-one equity from $1k of loan paydown is wiped out by about $6k of value loss. Plan a longer hold.
- Navajo County population projected at -16% by 2050 — secular population decline; favor cash flow + early exit over multi-decade hold.
Negotiation context
- Only 7 days on market — expect competitive offers; lowballing is unlikely to land.
- Current owner paid $95k; list at $190k implies a 100% gain — meaningful room to come down on a strong offer.
Risks & watch-outs
- Climate carrying-cost: severe wildfire risk — expect insurance premiums to compound above CPI over the hold.
Questions for the listing agent
- Built in 1979 — when were the roof, HVAC, electrical panel, plumbing, and water heater last replaced?
- What does the HOA fee cover, when was the last increase, and are there any pending special assessments or reserve-fund shortfalls?
- Is there a deadline driving the sale (1031 exchange, divorce, estate, relocation)? That informs how much negotiation room exists.
- The area grade is low — what's the realistic commute time and amenity access for the typical tenant pool here? Any planned neighborhood developments (good or bad) we should know about?
- What's the average days-on-market for RENTAL listings here right now (not sales)? A rising rental-DOM trend means longer vacancies and softer asking-rent achievability than the comps imply.
- What's the recent tenant-quality profile in this submarket — average credit score on applications, eviction rate, late-payment / NSF rate, and stable-employment percentage? A property-management company in the area should have these aggregated.
- How much new for-sale + rental construction is in the pipeline within 1–3 miles? Heavy new supply typically softens prices + rents 12–24 months out; constrained supply supports both.
Investment metrics
- 1% rule
- 0.82% ✗
- Cap rate
- 6.82%
- Cash-on-cash
- 1.87%
- DSCR
- 1.08
- GRM
- 10.1
CMA / ARV
- ARV (on-the-fly)
- $195,566
- Comps found
- 8
Show comp detail 8 sales within ~0.75 mi
| Address | Dist | Beds/Ba | Sqft | Sold | Price | $/sf | Match |
|---|---|---|---|---|---|---|---|
| 5208 S Blue Ridge Loop | 0.14mi | 2/2.0 | 896 (+5%) | 7mo | $170,000 | $190 | 75 |
| 4335 E Blue Ridge Loop | 0.11mi | 2/2.0 | 896 (+5%) | 11mo | $200,500 | $224 | 74 |
| 5185 S Blue Ridge Loop | 0.15mi | 1/1.0 (-1) | 832 (-3%) | 14mo | $229,000 | $275 | 72 |
| 5836 Jackrabbit Trl | 0.19mi | 2/2.0 | 896 (+5%) | 13mo | $235,000 | $262 | 68 |
| 5745 Cougar Ct | 0.17mi | 2/2.0 | 900 (+5%) | 20mo | $200,000 | $222 | 62 |
| 5220 S Blue Ridge Loop Unit N | 0.13mi | 2/2.0 | 960 (+12%) | 13mo | $168,000 | $175 | 58 |
| 4325 Merrymead Ct | 0.03mi | 2/2.0 | 768 (-10%) | 23mo | $180,000 | $234 | 58 |
| 4524 Mark Twain Dr | 0.11mi | 2/2.0 | 940 (+10%) | 22mo | $215,500 | $229 | 56 |
Match score weights: distance 35% · size 25% · config 20% · recency 20%. Top-matched comps best support the ARV.
Projected returns pro-forma
-3.0% appreciation · 3.0% rent growth · sell at horizon
- IRR
- -13.4%
- Equity multiple
- 0.52×
- Total profit
- $-25,574
- Equity at exit
- $28,330
- IRR
- -4.5%
- Equity multiple
- 0.70×
- Total profit
- $-15,761
- Equity at exit
- $16,428
Cash invested: $53,200 (down + closing). Projections, not guarantees.
Landlord ↔ Tenant lean methodology
- Overall (STATE)
- 87 Strongly Landlord-Friendly
- State Arizona
- 87 Strongly Landlord-Friendly · R+3
- County
- — inherits STATE
- City
- — inherits STATE
ZIP-level market 85935
- Home prices YoY
- -19.8%
- Active inventory
- 253
- Price-to-rent
- 10.1×
Monthly cashflow live
- Estimated rent
- $1,565 medium interval (Pro) →
- Mortgage (P&I)
- −$996
- Tax from tax record
- −$41 /mo · $492/yr
- Insurance
- −$79
- HOA
- −$37
- Vacancy / Maint / Mgmt
- −$329
- Net cashflow
- $83
Break-even live
Sensitivity live
| Price | -10% $191 | -5% $137 | +0% $83 | +5% $29 | +10% $-25 |
|---|---|---|---|---|---|
| Rent | -10% $-41 | -5% $21 | +0% $83 | +5% $145 | +10% $207 |
| Rate | -1.0pp $179 | -0.5pp $131 | base $83 | +0.5pp $34 | +1.0pp $-16 |
UW: 25.0% down · 7.5% · 30yr · 1.5% tax · 5.0% vac · 8.0% maint · 8.0% mgmt
Financing live
Cash to close
- Down payment
- $47,500
- Closing costs
- $5,700
- Reserves months
- —
- Total cash needed
- —
Loan-product check · same deal, 3 products live
Conventional
25% down · 7.5% · 30yr
- Down + closing
- —
- Monthly P&I
- —
- Monthly cashflow
- —
- DSCR
- —
- Eligible?
- —
Personal DTI + credit; lowest rate.
DSCR
20% down · 8.5% · 30yr
- Down + closing
- —
- Monthly P&I
- —
- Monthly cashflow
- —
- DSCR
- —
- Eligible?
- —
No personal income docs; deal must DSCR.
Hard money
10% down · 12.0% · 12mo
- Down + closing
- —
- Monthly P&I
- —
- Monthly cashflow
- —
- DSCR
- —
- Eligible?
- —
Short-term bridge; refi at stabilization.
HOA detail
- Monthly dues
- $37 · $444/yr
Listing history 7 events
-
2026-04-27status Pending
-
2026-04-20$190,000 Active
-
2022-07-15soldstatus $95,000
-
2021-12-23soldstatus $55,000
-
2001-10-04soldstatus $70,000
-
1994-10-03soldstatus $42,500
-
1993-08-19soldstatus $40,000
ⓘ Source: listings_history table (triggers on properties + properties_extension) + one-shot
backfill from property_details.listing_events for pre-trigger history.
Tax reassessment forecast AZ · Resets to sale price
- Current annual tax
- $492 · $41/mo
- Projected year-2 tax
- $1,254 · $104/mo
- Expected delta
- +$762/yr (+$64/mo · 155.1%)
ⓘ Screening estimate from a state-policy table — verify with the county assessor before closing.
Climate risk First Street
- Flood 1/10 Low FEMA zone X (unshaded) · 0% chance over 30 yrs
- Wildfire 8/10 Severe
- Heat 1/10 Low 7 d/yr ≥86°F today · 17 d/yr by 30 yrs out
- Wind 1/10 Low
- Air quality 2/10 Low 1 unhealthy d/yr today · 1 by 30 yrs out
Nearby sold comps map
Loading sold comps map…
Walkable amenities ~0.75 mi
Loading nearby amenities…
Taxation est. · year 1
- Rental income
- $18,783
- − Mortgage interest
- −$10,643
- − Property taxes
- −$492
- − Insurance
- −$950
- − Repairs & maintenance
- −$1,503
- − Management
- −$1,503
- − HOA
- −$444
- − Depreciation
- −$5,527
- Taxable loss
- −$2,278
- Est. tax savings @ 24.0%
- +$547
- After-tax cash flow
- $1,543/yr
For passive investors: Depreciation is non-cash, so a rental often shows a tax loss while cash-flowing — sheltering income. Rental losses are passive: they offset passive income freely, and up to $25,000/yr can offset ordinary (W-2) income if you actively participate and your MAGI is under $100k (phasing out to $0 by $150k); unused losses carry forward. On sale, claimed depreciation is recaptured at up to 25%, and gains may owe capital-gains tax (a 1031 exchange can defer both). Figures are a year-1 estimate at your 24.0% rate — not tax advice; consult a CPA.
Schools (NCES district)
- District
- Blue Ridge Unified School District No. 32 (4397)
- NCES district ID
- 0406580
- Math proficiency
- 21% ▼ -11.00%
- Reading proficiency
- 29% ▼ -13.00%
- Median HH income
- $49,406
- Composite
- 21.97/100
- National rank
- #8213
- State rank
- #139 of 249 in AZ
Livability — Pinetop Country Club
- Score
- 64/100
- State rank
- #105
- US rank
- #14564
Category grades
Schools grade is shown separately in the Schools card above.
Census & demographics
- Census place
- Pinetop Country Club, AZ
- Population (ZIP)
- 4,744
Population outlook (Navajo County) Hauer SSP2
- Today (2025)
- 105,760 people
- By 2030
- 103,301 · -2.3%
- By 2040
- 97,070 · -8.2%
- By 2050
- 88,850 · -16.0%
- By 2075
- 65,180 · -38.4%
- By 2100
- 37,281 · -64.7%
Race, ethnicity, and origin ACS 2023
- Neighborhood character
- Predominantly White (75%)
- Race & ethnicity
- White 75% Native American 11% Two or more races 7% Hispanic / Latino 5%
- Common ancestry
- Italian 5% Slovak 4% French 3%
- Foreign-born
- 3% · Canada
- Languages at home
- 89% English-only · Russian/Polish/Slavic 4% Spanish 2%
Political lean MEDSL · Navajo
- 2024 margin
- R (+17.2) · D 40.9% · R 58.1%
- 2008→2024 swing
- -5.5pp toward R · 2008: -11.7pp · 2024: -17.2pp
- All cycles
- 2024: R+17.2 2020: R+8.2 2016: R+7.9 2012: R+8.4 2008: R+11.7
Not yet ingested
- Civics
- —
Market trends
- HPI YoY
- ▼ -96.71%
- Current HPI
- 391.0283
- Rent YoY
- —
- Metro
- —
- State GDP YoY
- ▲ 4.54%
- F500 in state
- 20
Industry mix (Fortune 500 HQ in AZ)
| Industry | F500 HQs | Revenue |
|---|---|---|
| Technology | 2 | $13B |
|
||
| Mining / Metals | 1 | $23B |
|
||
| Environmental Services | 1 | $16B |
|
||
| Metals / Steel | 1 | $14B |
|
||
| Technology Distribution | 1 | $9B |
|
||
| Homebuilding | 1 | $8B |
|
||
Price history
+375.0% since first listed7 events — show timeline
- 2026-04-27 Pending — WMMLS
- 2026-04-20 Listed $190,000 WMMLS
- 2022-07-15 Sold (Public Records) $95,000 Public Records
- 2021-12-23 Sold (Public Records) $55,000 Public Records
- 2001-10-04 Sold (Public Records) $70,000 Public Records
- 1994-10-03 Sold (Public Records) $42,500 Public Records
- 1993-08-19 Sold (Public Records) $40,000 Public Records
Property tax history
+1.2%/yrLatest (2025): $492 · +4.0% YoY. Source: county tax records.
Cash-flow waterfall
monthlySold comps — $/sqft
last 12 mo · ≤1 miLoading sold comps…