3263 Hidden Gold · Bolivar Peninsula, TX
Flood risk 10/10 · Severe
- FEMA flood zone
- VE
- Chance of flooding over 30 yrs
- 0.99%
- Est. flood insurance / yr
- $5,013 – $11,043
Fire risk 3/10 · Minor
- Est. fire insurance / yr
- $1,222 – $2,270
Heat risk 10/10 · Severe
- Hot days now (above 107°F)
- 8 days/yr
- Hot days in 30 yrs
- 29 days/yr
Wind risk 10/10 · Severe
- Chance of severe wind over 30 yrs
- 99.0%
Air-quality risk 2/10 · Minimal
- Unhealthy air days now
- 1 days/yr
- Unhealthy air days in 30 yrs
- 1 days/yr
Risk factors via First Street. Map © Google.
Why this score? — see what drove the C- grade
The composite is a weighted blend of 9 inputs, each scored 0–100. Each bar is that input's sub-score; the figure is the points it added to the 100-point composite (weight × sub-score).
- Cash flow +17.2/30.0
- ARV discount +13.5/15.0
- DSCR +5.4/10.0
- 1% rule +4.3/10.0
- Livability +3.2/5.0
- Schools +3.0/10.0
- Appreciation +2.7/10.0
- Rent growth +2.5/5.0
- Condition / age +2.5/5.0
$339,000
🖨 Deal sheet (PDF) 📄 Offer letter ✓ Due diligence
Listing remarks MLS
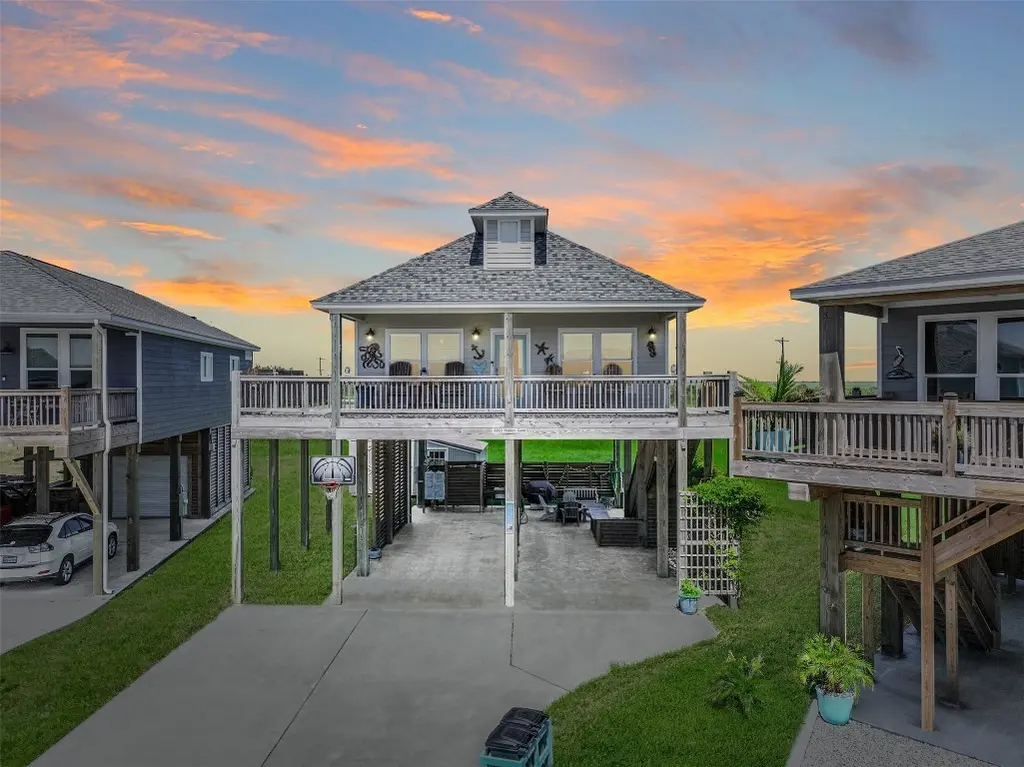
Welcome to the Sea Glass House! This charming 2-bedroom 2-bath beach house in Lafittes Landing in Crystal Beach is situated on a cul-de-sac lot with an ample driveway with plenty of covered & uncovered parking, plus convenient beach access is only a golf cart ride away! Inside, discover a gorgeous fully furnished open floor plan with abundant natural light, a stunning color scheme with quartz countertops, beautiful brushed nickel finishes, coastal ceiling fans, recessed lights, & spacious bedrooms with private full bathrooms attached. The home is pre-wired for a lift if the buyer dreams of adding one in the future. On the bottom floor is a great space for entertaining with privacy walls, an outdoor bar, a removable firepit, a fish cleaning station, & a private outdoor shower after fun days at the beach. Also note the separate storage building with AC & additional side storage. Whether you are looking for a vacation home, investment property, or primary home – this one is perfect!
Key facts
- Cul-de-sac lot
- Outdoor bar
- Open floor plan
Tags
Neighborhood map
What this means for you Summary
Snapshot
- This is a 2-bed/2.0-bath single-family listed at $339k.
Deal economics
- At list price, monthly cash flow is $-425 ($-5k/yr) — negative.
- To cash-flow at today's rent, offer at most $264k (22.2% below list).
- To meet the 1% rule (rent ≥ 1% of price), the offer needs to be $314k (7.4% below list).
- Recommended offer: $264k (22.2% below list) — sets the bar for cash-flow.
- Cap rate 7.2% vs local median 2.1% in Bolivar Peninsula — top-decile yield for the area; either an underpriced asset or a hidden risk that comps aren't pricing in. Stress-test before assuming the spread holds.
Location & tenants
- Location reads 65/100 on livability (#719 in TX) — a middle-class / working-renter tenant base. Strengths: crime A+, cost of living A+, housing A+; Watch: amenities F, commute F, health & safety F.
- Galveston ISD (town): math 33% / reading 39% proficiency, ranked #514 of 826 in TX (top 62%) — families likely to look elsewhere, expect single-tenant / working-renter base with shorter leases; 68% free/reduced lunch — lower-income household profile, screen leases tightly.
- Zoned schools: Oppe El (math 67% / reading 60%, grade B, #291 of 4,322 statewide, top 7%, 610 students, 63% FRL); Central Middle (math 18% / reading 21%, grade F, #1,445 of 1,662 statewide, top 88%, 879 students, 80% FRL); Ball H S (math 17% / reading 44%, grade F, #1,085 of 1,632 statewide, top 67%, 1,934 students, 73% FRL) — zoned schools at 72% FRL track the district average.
- Market conditions: 774 active listings in the ZIP; 2 comparable units currently listed for rent nearby; 3,258 units permitted in Galveston County in 2024 (0 in 5+ unit buildings).
Forward outlook
- Local home prices are declining (-3.0%/yr); year-one equity from $2k of loan paydown is wiped out by about $10k of value loss. Plan a longer hold.
- Galveston County population projected at +43% by 2050 — long-run rental-demand tailwind backs the buy-and-hold thesis.
Negotiation context
- It's been on market 128 days — a 12% lower offer ($298k) is reasonable based on typical stale-listing flexibility.
- 6 sale attempts since 10y ago with the ask held roughly flat each time — persistent listings suggest the price (not the market) is what's stuck; bring a comps-based counter.
Risks & watch-outs
- Watch-outs: flood insurance adds $669/mo.
- Climate carrying-cost: in FEMA flood zone VE (mandatory federal flood insurance); severe wind risk, 99% chance of damaging wind over 30y; extreme-heat days projected 8→29/yr by 2055 (HVAC capex compounding) — expect insurance premiums to compound above CPI over the hold.
Questions for the listing agent
- What do current leases actually rent for vs. the listed asking? Can we see a recent rent roll and the last 12 months of T-12 income?
- It's been on market 128 days. Have you received any prior offers? Is the seller open to a 22% concession, seller financing, or rate buy-down credit?
- What's the actual annual flood-insurance premium (NFIP or private), and is the property in a SFHA with mandatory coverage?
- What does the HOA fee cover, when was the last increase, and are there any pending special assessments or reserve-fund shortfalls?
- Why hasn't it sold? Are there any deal-killer items the seller is aware of (foundation, flood, title, zoning, code violations)?
- Is there a deadline driving the sale (1031 exchange, divorce, estate, relocation)? That informs how much negotiation room exists.
- Schools are D-rated, which usually means shorter tenancies and higher turnover. Who's the typical renter profile here, and what's been the actual vacancy rate?
- What's the average days-on-market for RENTAL listings here right now (not sales)? A rising rental-DOM trend means longer vacancies and softer asking-rent achievability than the comps imply.
- What's the recent tenant-quality profile in this submarket — average credit score on applications, eviction rate, late-payment / NSF rate, and stable-employment percentage? A property-management company in the area should have these aggregated.
- How much new for-sale + rental construction is in the pipeline within 1–3 miles? Heavy new supply typically softens prices + rents 12–24 months out; constrained supply supports both.
Investment metrics
- 1% rule
- 0.93% ✗
- Cap rate
- 7.16%
- Cash-on-cash
- 3.08%
- DSCR
- 1.14
- GRM
- 9.0
CMA / ARV
- ARV (median comp)
- $391,036
- List price
- $339,000
- Delta
- -13.31%
- Verdict
- UNDERPRICED
- Comps
- 20 within 1.0 mi
Show comp detail 1 sale within ~0.75 mi
| Address | Dist | Beds/Ba | Sqft | Sold | Price | $/sf | Match |
|---|---|---|---|---|---|---|---|
| 3271 Hidden Gold | 0.02mi | 3/2.0 (+1) | 1,040 (+3%) | 6mo | $325,900 | $313 | 84 |
Match score weights: distance 35% · size 25% · config 20% · recency 20%. Top-matched comps best support the ARV.
Projected returns pro-forma
-3.0% appreciation · 3.0% rent growth · sell at horizon
- IRR
- -25.3%
- Equity multiple
- 0.14×
- Total profit
- $-81,613
- Equity at exit
- $50,546
- IRR
- -21.0%
- Equity multiple
- -0.10×
- Total profit
- $-104,332
- Equity at exit
- $29,311
Cash invested: $94,920 (down + closing). Projections, not guarantees.
Landlord ↔ Tenant lean methodology
- Overall (STATE)
- 87 Strongly Landlord-Friendly
- State Texas
- 87 Strongly Landlord-Friendly · R+5
- County
- — inherits STATE
- City
- — inherits STATE
ZIP-level market 77650
- Home prices YoY
- -1.9%
- Active inventory
- 774
- Price-to-rent
- 9.0×
Monthly cashflow live
- Estimated rent
- $3,139 medium interval (Pro) →
- Mortgage (P&I)
- −$1,778
- Tax from tax record
- −$300 /mo · $3,601/yr
- Insurance
- −$141
- Flood insurance flood zone
- −$669 /mo · $8,028/yr
- HOA
- −$17
- Vacancy / Maint / Mgmt
- −$659
- Net cashflow
- $-425
Break-even live
Sensitivity live
| Price | -10% $-233 | -5% $-329 | +0% $-425 | +5% $-521 | +10% $-617 |
|---|---|---|---|---|---|
| Rent | -10% $-673 | -5% $-549 | +0% $-425 | +5% $-301 | +10% $-177 |
| Rate | -1.0pp $-254 | -0.5pp $-339 | base $-425 | +0.5pp $-513 | +1.0pp $-602 |
UW: 25.0% down · 7.5% · 30yr · 1.5% tax · 5.0% vac · 8.0% maint · 8.0% mgmt
Financing live
Cash to close
- Down payment
- $84,750
- Closing costs
- $10,170
- Reserves months
- —
- Total cash needed
- —
Loan-product check · same deal, 3 products live
Conventional
25% down · 7.5% · 30yr
- Down + closing
- —
- Monthly P&I
- —
- Monthly cashflow
- —
- DSCR
- —
- Eligible?
- —
Personal DTI + credit; lowest rate.
DSCR
20% down · 8.5% · 30yr
- Down + closing
- —
- Monthly P&I
- —
- Monthly cashflow
- —
- DSCR
- —
- Eligible?
- —
No personal income docs; deal must DSCR.
Hard money
10% down · 12.0% · 12mo
- Down + closing
- —
- Monthly P&I
- —
- Monthly cashflow
- —
- DSCR
- —
- Eligible?
- —
Short-term bridge; refi at stabilization.
Rent comps 2 comps
| Address | Beds | Baths | Sqft | Rent | $/sqft | DOM | Units | Dist |
|---|---|---|---|---|---|---|---|---|
| 3229 Castle Dr Unit 1353849P Crystal Beach, TX | 3.0 | 2.0 | 1420 | $3,035 | $2.14 | 7d | 1 | 0.08mi |
| 1714 Texas 87 Unit 1252629P Port Bolivar, TX | 3.0 | 2.0 | 1345 | $4,393 | $3.27 | 0d | 1 | 1.27mi |
HOA detail
- Monthly dues
- $17 · $204/yr
Listing history 30 events
-
2026-06-21days on market $339,000 Active 128 DOM
-
2026-06-18days on market $339,000 Active 125 DOM
-
2026-06-17days on market $339,000 Active 124 DOM
-
2026-06-16days on market $339,000 Active 123 DOM
-
2026-06-15days on market $339,000 Active 122 DOM
-
2026-06-13days on market $339,000 Active 120 DOM
-
2026-06-09days on market $339,000 Active 116 DOM
-
2026-06-08days on market $339,000 Active 115 DOM
-
2026-06-07days on market $339,000 Active 114 DOM
-
2026-06-04days on market $339,000 Active 111 DOM
-
2026-06-03days on market $339,000 Active 110 DOM
-
2026-06-02days on market $339,000 Active 109 DOM
-
2026-06-01days on market $339,000 Active 108 DOM
-
2026-05-31days on market $339,000 Active 107 DOM
-
2026-02-13$339,000 Active 1016-char remark
Show marketing remark (1016 chars)
Welcome to the Sea Glass House! This charming 2-bedroom 2-bath beach house in Lafittes Landing in Crystal Beach is situated on a cul-de-sac lot with an ample driveway with plenty of covered & uncovered parking, plus convenient beach access is only a golf cart ride away! Inside, discover a gorgeous fully furnished open floor plan with abundant natural light, a stunning color scheme with quartz countertops, beautiful brushed nickel finishes, coastal ceiling fans, recessed lights, & spacious bedrooms with private full bathrooms attached. The home is pre-wired for a lift if the buyer dreams of adding one in the future. On the bottom floor is a great space for entertaining with privacy walls, an outdoor bar, a removable firepit, a fish cleaning station, & a private outdoor shower after fun days at the beach. Also note the separate storage building with AC & additional side storage. Whether you are looking for a vacation home, investment property, or primary home – this one is perfect!
-
2026-02-12historical
-
2025-09-25$369,000 Active
-
2025-09-25historical
-
2025-06-18price $369,000
-
2025-03-18$387,000 Active
-
2025-03-05historical
-
2024-08-02$410,000 Active
-
2021-12-07soldstatus Sold
-
2021-12-06soldstatus
-
2021-10-23status Pending, Continue to Show
-
2021-10-08price $349,900
-
2021-08-21$359,900 Active
-
2017-09-14historical
-
2017-03-09price $205,000
-
2016-12-02$200,000 Active
ⓘ Source: listings_history table (triggers on properties + properties_extension) + one-shot
backfill from property_details.listing_events for pre-trigger history.
Tax reassessment forecast TX · Resets to sale price
- Current annual tax
- $3,601 · $300/mo
- Projected year-2 tax
- $6,204 · $517/mo
- Expected delta
- +$2,602/yr (+$217/mo · 72.3%)
ⓘ Screening estimate from a state-policy table — verify with the county assessor before closing.
Climate risk First Street
- Flood 10/10 Extreme FEMA zone VE · 99% chance over 30 yrs
- Wildfire 3/10 Moderate
- Heat 10/10 Extreme 8 d/yr ≥107°F today · 29 d/yr by 30 yrs out
- Wind 10/10 Extreme 99% chance of damaging wind over 30 yrs
- Air quality 2/10 Low 1 unhealthy d/yr today · 1 by 30 yrs out
Nearby sold comps map
Loading sold comps map…
Walkable amenities ~0.75 mi
Loading nearby amenities…
Taxation est. · year 1
- Rental income
- $37,671
- − Mortgage interest
- −$18,989
- − Property taxes
- −$3,601
- − Insurance
- −$9,723
- − Repairs & maintenance
- −$3,014
- − Management
- −$3,014
- − HOA
- −$204
- − Depreciation
- −$9,862
- Taxable loss
- −$10,735
- Est. tax savings @ 24.0%
- +$2,576
- After-tax cash flow
- $-2,524/yr
For passive investors: Depreciation is non-cash, so a rental often shows a tax loss while cash-flowing — sheltering income. Rental losses are passive: they offset passive income freely, and up to $25,000/yr can offset ordinary (W-2) income if you actively participate and your MAGI is under $100k (phasing out to $0 by $150k); unused losses carry forward. On sale, claimed depreciation is recaptured at up to 25%, and gains may owe capital-gains tax (a 1031 exchange can defer both). Figures are a year-1 estimate at your 24.0% rate — not tax advice; consult a CPA.
Schools (NCES district)
- District
- Galveston ISD
- NCES district ID
- 4820280
- Math proficiency
- 33% ▼ -14.00%
- Reading proficiency
- 39% ▼ -4.00%
- Median HH income
- $40,162
- Composite
- 30.22/100
- National rank
- #6299
- State rank
- #514 of 826 in TX
Livability — Bolivar Peninsula
- Score
- 65/100
- State rank
- #719
- US rank
- #13437
Category grades
Schools grade is shown separately in the Schools card above.
Census & demographics
- Census place
- Bolivar Peninsula, TX
- City population
- 2,957
- Population (ZIP)
- 2,362
Population outlook (Galveston County) Hauer SSP2
- Today (2025)
- 390,640 people
- By 2030
- 425,226 · +8.9%
- By 2040
- 493,765 · +26.4%
- By 2050
- 559,698 · +43.3%
- By 2075
- 719,260 · +84.1%
- By 2100
- 819,628 · +109.8%
Race, ethnicity, and origin ACS 2023
- Neighborhood character
- Predominantly White (70%)
- Race & ethnicity
- White 70% Hispanic / Latino 21% Two or more races 10% Black 8%
- Hispanic origin (detail)
- Mexican 14%
- Common ancestry
- Lithuanian 6% Romanian 3% Iranian 3%
- Foreign-born
- 13% · Canada
- Languages at home
- 85% English-only · Spanish 14% German/W. Germanic 1%
Political lean MEDSL · Galveston
- 2024 margin
- Strong R (+27.4) · D 35.7% · R 63.1% · Other 1.2%
- 2008→2024 swing
- -7.9pp toward R · 2008: -19.5pp · 2024: -27.4pp
- All cycles
- 2024: R+27.4 2020: R+22.6 2016: R+22.6 2012: R+26.9 2008: R+19.5
Not yet ingested
- Civics
- —
Market trends
- HPI YoY
- ▼ -4.52%
- Current HPI
- 231.5074
- Rent YoY
- —
- Metro
- —
- State GDP YoY
- ▲ 3.95%
- F500 in state
- 110
Industry mix (Fortune 500 HQ in TX)
| Industry | F500 HQs | Revenue |
|---|---|---|
| Energy | 16 | $1,198B |
|
||
| Technology | 5 | $198B |
|
||
| Engineering / Construction | 4 | $72B |
|
||
| Energy Services | 3 | $60B |
|
||
| Utilities | 3 | $41B |
|
||
| Healthcare | 2 | $330B |
|
||
Price history
+69.5% since first listed16 events — show timeline
- 2026-02-13 Listed $339,000 HARMLS
- 2026-02-12 Listing Removed — HARMLS
- 2025-09-25 Listing Removed — HARMLS
- 2025-09-25 Listed $369,000 HARMLS
- 2025-06-18 Price Changed $369,000 HARMLS
- 2025-03-18 Listed $387,000 HARMLS
- 2025-03-05 Listing Removed — HARMLS
- 2024-08-02 Listed $410,000 HARMLS
- 2021-12-07 Sold (MLS) — HARMLS
- 2021-12-06 Sold (Public Records) — Public Records
- 2021-10-23 Pending — HARMLS
- 2021-10-08 Price Changed $349,900 HARMLS
- 2021-08-21 Listed $359,900 HARMLS
- 2017-09-14 Delisted — Galveston MLS
- 2017-03-09 Price Changed $205,000 Galveston MLS
- 2016-12-02 Listed $200,000 Galveston MLS
Property tax history
+39.4%/yrLatest (2025): $3,601 · -31.9% YoY. Source: county tax records.
Cash-flow waterfall
monthlySold comps — $/sqft
last 12 mo · ≤1 miLoading sold comps…