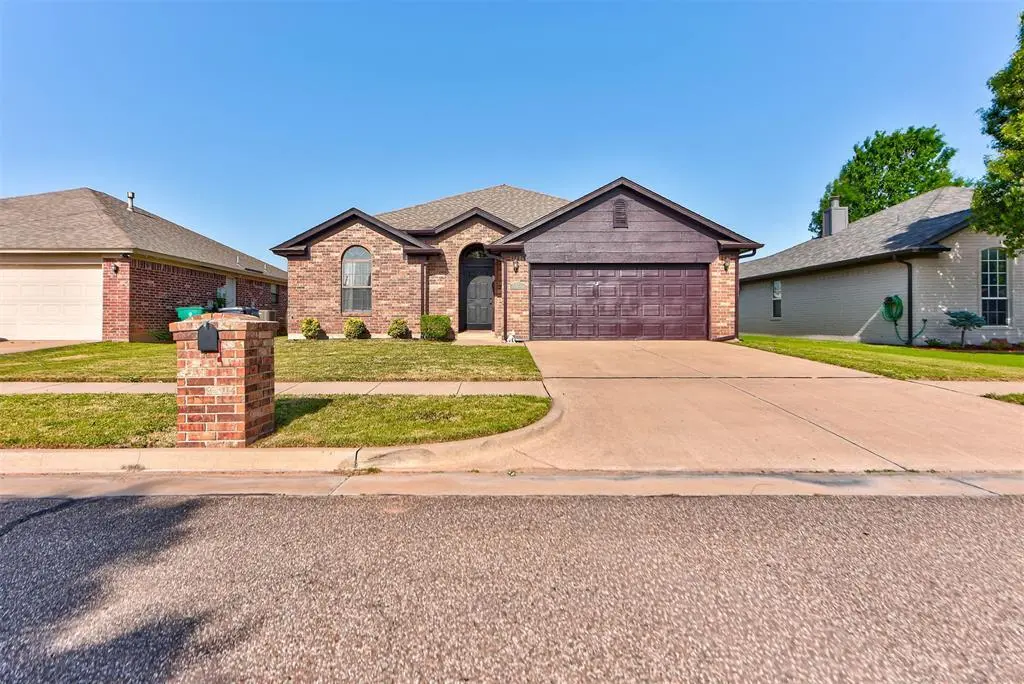
16305 Osceola Trl · Oklahoma City, OK
Flood risk 1/10 · Minimal
- FEMA flood zone
- X (unshaded)
- Chance of flooding over 30 yrs
- 0.0%
- Est. flood insurance / yr
- $507 – $1,088
Fire risk 4/10 · Minor
- Est. fire insurance / yr
- $2,463 – $4,575
Heat risk 6/10 · Moderate
- Hot days now (above 107°F)
- 7 days/yr
- Hot days in 30 yrs
- 19 days/yr
Wind risk 2/10 · Minimal
- Chance of severe wind over 30 yrs
- 2.0%
Air-quality risk 2/10 · Minimal
- Unhealthy air days now
- 1 days/yr
- Unhealthy air days in 30 yrs
- 1 days/yr
Risk factors via First Street. Map © Google.
Why this score? — see what drove the D grade
The composite is a weighted blend of 9 inputs, each scored 0–100. Each bar is that input's sub-score; the figure is the points it added to the 100-point composite (weight × sub-score).
- Cash flow +11.9/30.0
- ARV discount +9.6/15.0
- Livability +4.0/5.0
- Schools +3.6/10.0
- DSCR +3.5/10.0
- Rent growth +3.3/5.0
- 1% rule +3.1/10.0
- Condition / age +2.5/5.0
- Appreciation +0.0/10.0
$220,000
🖨 Deal sheet 📄 Offer letter ✓ Due diligence
Listing remarks MLS
Little gem in the heart of Edmond! Built in 2000, 3 beds and 2 full baths, Living has fireplace and wall of windows for nature light. Open floor plan, new carpet, large backyard for entertaining your family and friends. Master bedroom is spacious, and huge walk-in closet. Other 2 bedrooms are decent size. This home is perfect for your growing family! Close to everything! Schedule your showing today!
Key facts
- 5,985 sq ft lot
- 2 garage spots
- Built 2000
Tags
Property features AI
Finance
- Financial info: Financing options: Cash, Conventional, FHA or VA; Assumable: No; Loan qualifying: Yes
- HOA & community: Mandatory association with $175 fee; Association fee covers common area maintenance
Exterior
- Parking: 2-car garage
- Security: Garage floor and below-ground storm shelter
- Home design: Single family residence; One-level home; Residential property; Existing property
- Construction: Frame and masonry veneer construction; Composition roof; Slab foundation; Built (existing)
- Exterior features: Porch; Interior lot
Interior
- Bedrooms: 3 bedrooms
- Bathrooms: 2 full bathrooms
- Interior features: One living area; Dining area; Gas log fireplace
Neighborhood map
What this means for you Summary
Snapshot
- This is a 3-bed/2.0-bath single-family listed at $220k.
Deal economics
- At list price, monthly cash flow is $-54 ($-653/yr) — negative.
- To cash-flow at today's rent, offer at most $210k (4.4% below list).
- To meet the 1% rule (rent ≥ 1% of price), the offer needs to be $178k (19.0% below list).
- Recommended offer: $178k (19.0% below list) — sets the bar for 1% rule.
- Cap rate 6.0% vs local median 3.7% in Oklahoma City — top-decile yield for the area; either an underpriced asset or a hidden risk that comps aren't pricing in. Stress-test before assuming the spread holds.
Location & tenants
- Location reads 80/100 on livability (#3 in OK, #1,635 nationally) — a professional / high-income tenant draw. Strengths: amenities A+, commute A+, cost of living A+; Watch: crime F.
- Edmond (suburban): math 38% / reading 40% proficiency, ranked #11 of 270 in OK (top 4%) — families likely to look elsewhere, expect single-tenant / working-renter base with shorter leases.
- Zoned schools: Angie Debo Es (math 32% / reading 27%, grade F, #255 of 845 statewide, top 35%, 579 students, 0% FRL); Santa Fe Hs (math 36% / reading 52%, grade F, #18 of 447 statewide, top 4%, 2,796 students, 0% FRL) — zoned schools average 0% FRL vs 22% district-wide (22 pts lower); this property's tenant base skews higher-income than the district average.
- Market conditions: Rents rising (+3.1%/yr); 654 active listings in the ZIP; 38 comparable units currently listed for rent nearby; rentals at typical pace (median 15d on market — plan ~3-4 weeks tenant-placement turnaround); high-income renter base; 5,365 units permitted in Oklahoma County in 2024 (569 in 5+ unit buildings).
Forward outlook
- Local home prices are declining (-3.0%/yr); year-one equity from $2k of loan paydown is wiped out by about $7k of value loss. Plan a longer hold.
- Oklahoma County population projected at +41% by 2050 — long-run rental-demand tailwind backs the buy-and-hold thesis.
Negotiation context
- Only 3 days on market — expect competitive offers; lowballing is unlikely to land.
- 6 sale attempts since 26y ago with the ask held roughly flat each time — persistent listings suggest the price (not the market) is what's stuck; bring a comps-based counter.
- Current owner paid $163k; 35% above their basis — modest negotiation headroom, anchor on the comps not their cost.
Risks & watch-outs
- Climate carrying-cost: extreme-heat days projected 7→19/yr by 2055 (HVAC capex compounding) — expect insurance premiums to compound above CPI over the hold.
Questions for the listing agent
- What do current leases actually rent for vs. the listed asking? Can we see a recent rent roll and the last 12 months of T-12 income?
- What does the HOA fee cover, when was the last increase, and are there any pending special assessments or reserve-fund shortfalls?
- Is there a deadline driving the sale (1031 exchange, divorce, estate, relocation)? That informs how much negotiation room exists.
- Schools are F-rated, which usually means shorter tenancies and higher turnover. Who's the typical renter profile here, and what's been the actual vacancy rate?
- Crime grade is F in this area — have there been break-ins, vandalism, or insurance claims at this property in the last 3 years? What carrier currently insures it and at what premium?
- The area grade is low — what's the realistic commute time and amenity access for the typical tenant pool here? Any planned neighborhood developments (good or bad) we should know about?
- What's the average days-on-market for RENTAL listings here right now (not sales)? A rising rental-DOM trend means longer vacancies and softer asking-rent achievability than the comps imply.
- What's the recent tenant-quality profile in this submarket — average credit score on applications, eviction rate, late-payment / NSF rate, and stable-employment percentage? A property-management company in the area should have these aggregated.
- How much new for-sale + rental construction is in the pipeline within 1–3 miles? Heavy new supply typically softens prices + rents 12–24 months out; constrained supply supports both.
Investment metrics
- 1% rule
- 0.81% ✗
- Cap rate
- 6.00%
- Cash-on-cash
- -1.06%
- DSCR
- 0.95
- GRM
- 10.3
CMA / ARV
- ARV (on-the-fly)
- $231,023
- Comps found
- 12
Show comp detail 12 sales within ~0.75 mi
| Address | Dist | Beds/Ba | Sqft | Sold | Price | $/sf | Match |
|---|---|---|---|---|---|---|---|
| 16305 Osceola Trl | 0.00mi | 3/2.0 | 1,367 (0%) | 1mo | $220,000 | $161 | 99 |
| 16409 Osceola Trl | 0.05mi | 3/2.0 | 1,322 (-3%) | 8mo | $245,000 | $185 | 86 |
| 16416 Okalee Ln | 0.28mi | 3/2.0 | 1,391 (+2%) | 2mo | $234,900 | $169 | 82 |
| 16404 Osceola Trl | 0.05mi | 3/2.0 | 1,489 (+9%) | 5mo | $234,900 | $158 | 79 |
| 2609 NW 162nd St | 0.08mi | 3/2.0 | 1,514 (+11%) | 2mo | $253,000 | $167 | 77 |
| 2408 NW 164th Ter | 0.22mi | 3/2.0 | 1,268 (-7%) | 2mo | $235,000 | $185 | 76 |
| 16240 Everglade Ln | 0.08mi | 3/2.0 | 1,528 (+12%) | 1mo | $235,000 | $154 | 75 |
| 2305 NW 162nd St | 0.33mi | 3/2.0 | 1,267 (-7%) | 0mo | $237,000 | $187 | 72 |
| 2613 NW 162nd St | 0.09mi | 3/2.0 | 1,517 (+11%) | 7mo | $235,000 | $155 | 72 |
| 2416 NW 164th Ter | 0.20mi | 3/2.0 | 1,488 (+9%) | 8mo | $250,000 | $168 | 69 |
| 16208 Panther Way | 0.37mi | 3/2.0 | 1,225 (-10%) | 0mo | $225,000 | $184 | 65 |
| 2300 NW 162nd Ter | 0.34mi | 3/2.0 | 1,204 (-12%) | 4mo | $223,000 | $185 | 60 |
Match score weights: distance 35% · size 25% · config 20% · recency 20%. Top-matched comps best support the ARV.
Projected returns pro-forma
-3.0% appreciation · 3.14% rent growth · sell at horizon
- IRR
- -17.9%
- Equity multiple
- 0.37×
- Total profit
- $-38,874
- Equity at exit
- $32,803
- IRR
- -9.8%
- Equity multiple
- 0.39×
- Total profit
- $-37,317
- Equity at exit
- $19,022
Cash invested: $61,600 (down + closing). Projections, not guarantees.
Landlord ↔ Tenant lean methodology
- Overall (STATE)
- 83 Strongly Landlord-Friendly
- State Oklahoma
- 83 Strongly Landlord-Friendly · R+20
- County
- — inherits STATE
- City
- — inherits STATE
ZIP-level market 73013
- Rents YoY
- 3.1%
- Active inventory
- 654
- Price-to-rent
- 10.3×
Monthly cashflow live
- Estimated rent
- $1,782 high interval (Pro) →
- Mortgage (P&I)
- −$1,154
- Tax from tax record
- −$202 /mo · $2,421/yr
- Insurance
- −$92
- HOA
- −$15
- Vacancy / Maint / Mgmt
- −$374
- Net cashflow
- $-54
Break-even live
UW: 25.0% down · 7.5% · 30yr · 1.5% tax · 5.0% vac · 8.0% maint · 8.0% mgmt
Financing live
Cash to close
- Down payment
- $55,000
- Closing costs
- $6,600
- Reserves months
- —
- Total cash needed
- —
Loan-product check · same deal, 3 products live
Conventional
25% down · 7.5% · 30yr
- Down + closing
- —
- Monthly P&I
- —
- Monthly cashflow
- —
- DSCR
- —
- Eligible?
- —
Personal DTI + credit; lowest rate.
DSCR
20% down · 8.5% · 30yr
- Down + closing
- —
- Monthly P&I
- —
- Monthly cashflow
- —
- DSCR
- —
- Eligible?
- —
No personal income docs; deal must DSCR.
Hard money
10% down · 12.0% · 12mo
- Down + closing
- —
- Monthly P&I
- —
- Monthly cashflow
- —
- DSCR
- —
- Eligible?
- —
Short-term bridge; refi at stabilization.
Rent comps 38 comps
| Address | Beds | Baths | Sqft | Rent | $/sqft | DOM | Units | Dist |
|---|---|---|---|---|---|---|---|---|
| 16401 Osceola Trl Edmond, OK | 3.0 | 2.0 | 1563 | $1,595 | $1.02 | 24d | 1 | 0.03mi |
| 16401 Osceola Trl Edmond, OK | 3.0 | 2.0 | 1563 | $1,595 | $1.02 | 20d | 1 | 0.03mi |
| 16212 Osceola Trl Edmond, OK | 3.0 | 2.0 | 1672 | $1,800 | $1.08 | 2d | 1 | 0.11mi |
| 16224 Panther Way Edmond, OK | 3.0 | 2.0 | 1512 | $1,695 | $1.12 | 14d | 1 | 0.36mi |
| 15937 Katie Ridge Dr Edmond, OK | 4.0 | 2.0 | 1763 | $1,945 | $1.10 | 2d | 1 | 0.45mi |
| 16001 Korie Dr Edmond, OK | 3.0 | 2.0 | 1778 | $1,995 | $1.12 | 24d | 1 | 0.49mi |
| 17029 Woodvine Dr Edmond, OK | 3.0 | 2.0 | 1838 | $1,970 | $1.07 | 17d | 1 | 0.62mi |
| 2201 NW 155th St Edmond, OK | 2.0 | 2.0 | 1149 | $1,495 | $1.30 | 24d | 1 | 0.72mi |
| 2417 NW 152nd St Edmond, OK | 4.0 | 2.0 | 1721 | $1,795 | $1.04 | 4d | 1 | 0.79mi |
| 15501 N Pennsylvania Ave Edmond, OK | 2.0 | 2.0 | 958 | $1,379 | $1.44 | 14d | 1 | 0.84mi |
| 15501 N Pennsylvania Ave Edmond, OK | 3.0 | 2.0 | 1053 | $1,699 | $1.61 | 20d | 1 | 0.84mi |
| 15501 N Pennsylvania Ave Edmond, OK | 3.0 | 2.0 | 1053 | $1,699 | $1.61 | 24d | 1 | 0.84mi |
| 17516 Black Hawk Dr Edmond, OK | 3.0 | 2.0 | 1846 | $2,095 | $1.13 | 2d | 1 | 0.95mi |
| 17405 Bronze Ln Edmond, OK | 4.0 | 2.0 | 1787 | $2,050 | $1.15 | 2d | 1 | 0.97mi |
| 3316 NW 159th St Edmond, OK | 3.0 | 2.0 | 1550 | $1,850 | $1.19 | 12d | 1 | 1.01mi |
| 3101 NW 150th St Oklahoma City, OK | 1.0–2.0 | 1.0–2.0 | 811 | $995 | $1.23 | 2d | 12 | 1.11mi |
| 17309 Platinum Ln Edmond, OK | 3.0 | 2.0 | 1840 | $1,895 | $1.03 | 14d | 1 | 1.12mi |
| 17609 Gold Dr Edmond, OK | 4.0 | 2.0 | 1640 | $1,995 | $1.22 | 24d | 1 | 1.15mi |
| 2701 Watermark Blvd Oklahoma City, OK | 1.0–3.0 | 1.0–2.0 | 1047 | $1,800 | $1.72 | 2d | 19 | 1.17mi |
| 1720 NW 172nd St Edmond, OK | 4.0 | 2.0 | 1868 | $1,975 | $1.06 | 24d | 1 | 1.17mi |
| 14712 Mezzaluna Blvd Oklahoma City, OK | 1.0–2.0 | 1.0–2.0 | 898 | $1,950 | $2.17 | 24d | 25 | 1.22mi |
| 2717 NW 178th St Edmond, OK | 1.0–3.0 | 1.0–2.0 | 943 | $1,749 | $1.85 | 2d | 15 | 1.22mi |
| 16010 Portland Ave Edmond, OK | 2.0 | 2.0 | 920 | $1,217 | $1.32 | 2d | 1 | 1.26mi |
| 2400 Watermark Blvd Oklahoma City, OK | 2.0 | 2.0 | 1267 | $1,679 | $1.33 | 21d | 1 | 1.29mi |
| 2600 Watermark Blvd Oklahoma City, OK | 1.0–2.0 | 1.0–2.5 | 1066 | $1,567 | $1.47 | 2d | 10 | 1.33mi |
| 14320 Mezzaluna Ave Oklahoma City, OK | 2.0 | 2.0 | 1267 | $1,619 | $1.28 | 14d | 1 | 1.34mi |
| 14900 N Pennsylvania Ave Oklahoma City, OK | 1.0–3.0 | 1.0–2.0 | 1027 | $1,715 | $1.67 | 2d | 19 | 1.34mi |
| 1716 NW 150th Ter Edmond, OK | 3.0 | 3.0 | 1472 | $1,695 | $1.15 | 24d | 1 | 1.35mi |
| 18301 Montoro Way Edmond, OK | 3.0 | 2.0 | 1556 | $1,695 | $1.09 | 2d | 1 | 1.37mi |
| 3305 NW 149th St Oklahoma City, OK | 4.0 | 2.5 | 1570 | $1,775 | $1.13 | 14d | 1 | 1.39mi |
| 2924 NW 181st St Edmond, OK | 3.0 | 2.0 | 1558 | $1,775 | $1.14 | 24d | 1 | 1.40mi |
| 14433 N Pennsylvania Ave Unit 27A Oklahoma City, OK | 3.0 | 2.0 | 1360 | $1,750 | $1.29 | 2d | 1 | 1.42mi |
| 3308 NW 148th St Oklahoma City, OK | 3.0 | 3.0 | 1297 | $1,650 | $1.27 | 24d | 1 | 1.45mi |
| 1809 NW 146th St Edmond, OK | 3.0 | 2.0 | 1202 | $1,625 | $1.35 | 4d | 1 | 1.47mi |
| 14300 N May Ave Oklahoma City, OK | 1.0–3.0 | 1.0–2.0 | 923 | $1,620 | $1.75 | 3d | 15 | 1.47mi |
| 2300 NW 145th St Oklahoma City, OK | 1.0–3.0 | 1.0–2.0 | 1000 | $2,225 | $2.23 | 2d | 12 | 1.48mi |
| 18209 Bridlington Dr Edmond, OK | 3.0 | 2.0 | 1568 | $1,700 | $1.08 | 24d | 1 | 1.48mi |
| 14425 N Pennsylvania Ave Unit 20B Oklahoma City, OK | 2.0 | 2.0 | 1134 | $1,299 | $1.15 | 24d | 1 | 1.50mi |
HOA detail
- Monthly dues
- $15 · $180/yr
Listing history 16 events
-
2026-05-01status Pending
-
2026-04-28$220,000 Active
-
2019-08-20soldstatus $163,000
-
2019-08-05soldstatus $163,000 Sold 409-char remark
Show marketing remark (409 chars)
Little gem in the heart of Edmond! Built in 2000, 3 beds and 2 full baths, Living has fireplace and wall of windows for nature light. Open floor plan, new carpet, large backyard for entertaining your family and friends. Master bedroom is spacious, and huge walk-in closet. Other 2 bedrooms are decent size. This home is perfect for your growing family! Close to everything! Schedule your showing today!
-
2019-07-18status Pending 409-char remark
Show marketing remark (409 chars)
Little gem in the heart of Edmond! Built in 2000, 3 beds and 2 full baths, Living has fireplace and wall of windows for nature light. Open floor plan, new carpet, large backyard for entertaining your family and friends. Master bedroom is spacious, and huge walk-in closet. Other 2 bedrooms are decent size. This home is perfect for your growing family! Close to everything! Schedule your showing today!
-
2019-07-10price $165,000 409-char remark
Show marketing remark (409 chars)
Little gem in the heart of Edmond! Built in 2000, 3 beds and 2 full baths, Living has fireplace and wall of windows for nature light. Open floor plan, new carpet, large backyard for entertaining your family and friends. Master bedroom is spacious, and huge walk-in closet. Other 2 bedrooms are decent size. This home is perfect for your growing family! Close to everything! Schedule your showing today!
-
2019-05-14$170,000 Active 409-char remark
Show marketing remark (409 chars)
Little gem in the heart of Edmond! Built in 2000, 3 beds and 2 full baths, Living has fireplace and wall of windows for nature light. Open floor plan, new carpet, large backyard for entertaining your family and friends. Master bedroom is spacious, and huge walk-in closet. Other 2 bedrooms are decent size. This home is perfect for your growing family! Close to everything! Schedule your showing today!
-
2014-12-22soldstatus $145,000
-
2014-12-18soldstatus $145,000 437-char remark
Show marketing remark (437 chars)
This super clean move-in ready home offers some new paint, brand new carpet, brand new gas stove/oven, wood floors, tile, 1 year old roof, a wonderfully large breakfast area, oak cabinets, huge walk in master closet, foyer, full privacy fence and so much more. Also enjoy morning coffee or entertainment on the back patio & the open floor plan is highly sought after. This home is truly move in ready and available for a quick close.
-
2014-11-07$146,900 437-char remark
Show marketing remark (437 chars)
This super clean move-in ready home offers some new paint, brand new carpet, brand new gas stove/oven, wood floors, tile, 1 year old roof, a wonderfully large breakfast area, oak cabinets, huge walk in master closet, foyer, full privacy fence and so much more. Also enjoy morning coffee or entertainment on the back patio & the open floor plan is highly sought after. This home is truly move in ready and available for a quick close.
-
2006-10-27soldstatus $132,500
-
2006-10-25soldstatus $132,500
-
2006-07-15$132,500
-
2001-05-14soldstatus $95,900
-
2001-01-10$95,900
-
2000-11-01$97,607
ⓘ Source: listings_history table (triggers on properties + properties_extension) + one-shot
backfill from property_details.listing_events for pre-trigger history.
Tax reassessment forecast OK · Resets to sale price
- Current annual tax
- $2,421 · $202/mo
- Projected year-2 tax
- $2,421 · $202/mo
- Expected delta
- $0/yr ($0/mo · 0.0%)
ⓘ Screening estimate from a state-policy table — verify with the county assessor before closing.
Climate risk First Street
- Flood 1/10 Low FEMA zone X (unshaded) · 0% chance over 30 yrs
- Wildfire 4/10 Moderate
- Heat 6/10 Major 7 d/yr ≥107°F today · 19 d/yr by 30 yrs out
- Wind 2/10 Low 2% chance of damaging wind over 30 yrs
- Air quality 2/10 Low 1 unhealthy d/yr today · 1 by 30 yrs out
Nearby sold comps map
Loading sold comps map…
Walkable amenities ~0.75 mi
Loading nearby amenities…
Taxation est. · year 1
- Rental income
- $21,383
- − Mortgage interest
- −$12,323
- − Property taxes
- −$2,421
- − Insurance
- −$1,100
- − Repairs & maintenance
- −$1,711
- − Management
- −$1,711
- − HOA
- −$180
- − Depreciation
- −$6,400
- Taxable loss
- −$4,463
- Est. tax savings @ 24.0%
- +$1,071
- After-tax cash flow
- $418/yr
For passive investors: Depreciation is non-cash, so a rental often shows a tax loss while cash-flowing — sheltering income. Rental losses are passive: they offset passive income freely, and up to $25,000/yr can offset ordinary (W-2) income if you actively participate and your MAGI is under $100k (phasing out to $0 by $150k); unused losses carry forward. On sale, claimed depreciation is recaptured at up to 25%, and gains may owe capital-gains tax (a 1031 exchange can defer both). Figures are a year-1 estimate at your 24.0% rate — not tax advice; consult a CPA.
Schools (NCES district)
- District
- Edmond
- NCES district ID
- 4010590
- Math proficiency
- 38% ▼ -12.00%
- Reading proficiency
- 40% ▼ -12.00%
- Median HH income
- $73,212
- Composite
- 35.88/100
- National rank
- #4814
- State rank
- #11 of 270 in OK
Livability — Oklahoma City
- Score
- 80/100
- State rank
- #3
- US rank
- #1635
Category grades
Schools grade is shown separately in the Schools card above.
Census & demographics
- Census place
- Oklahoma City, OK
- County
- Oklahoma County · 771,644 people
- City population
- 498,656
- Metro
- Oklahoma City, OK
- Population (ZIP)
- 58,023
- Household income
- $113,870
- Rent vs Own
- Severe rent burden
- 1313.0
Population outlook (Oklahoma County) Hauer SSP2
- Today (2025)
- 911,875 people
- By 2030
- 982,413 · +7.7%
- By 2040
- 1,130,468 · +24.0%
- By 2050
- 1,288,422 · +41.3%
- By 2075
- 1,711,482 · +87.7%
- By 2100
- 2,088,448 · +129.0%
Race, ethnicity, and origin ACS 2023
- Neighborhood character
- Predominantly White (67%)
- Race & ethnicity
- White 67% Two or more races 11% Black 9% Asian 7% Hispanic / Latino 5% Native American 2%
- Hispanic origin (detail)
- Mexican 2%
- Common ancestry
- Slovak 3% Italian 2% Lithuanian 2%
- Foreign-born
- 7% · Canada, Vietnam
- Languages at home
- 91% English-only · Other Indo-European 3% Spanish 2% Vietnamese 1%
Political lean MEDSL · Oklahoma
- 2024 margin
- Toss-up / Even · D 48.0% · R 49.7% · Other 2.3%
- 2008→2024 swing
- +15.1pp toward D · 2008: -16.8pp · 2024: -1.7pp
- All cycles
- 2024: R+1.7 2020: R+1.1 2016: R+10.5 2012: R+16.7 2008: R+16.8
Not yet ingested
- Civics
- —
Market trends
- HPI YoY
- ▼ -201.41%
- Current HPI
- 214.2251
- Rent YoY
- ▲ 3.14%
- Metro
- Oklahoma City, OK
- State GDP YoY
- ▲ 1.55%
- F500 in state
- 6
Industry mix (Fortune 500 HQ in OK)
| Industry | F500 HQs | Revenue |
|---|---|---|
| Energy | 3 | $48B |
|
||
Price history
+125.4% since first listed16 events — show timeline
- 2026-05-01 Pending — MLSOK
- 2026-04-28 Listed $220,000 MLSOK
- 2019-08-20 Sold (Public Records) $163,000 Public Records
- 2019-08-05 Sold (MLS) $163,000 MLSOK
- 2019-07-18 Pending — MLSOK
- 2019-07-10 Price Changed $165,000 MLSOK
- 2019-05-14 Listed $170,000 MLSOK
- 2014-12-22 Sold (Public Records) $145,000 Public Records
- 2014-12-18 Sold (MLS) $145,000 MLSOK
- 2014-11-07 Listed $146,900 MLSOK
- 2006-10-27 Sold (Public Records) $132,500 Public Records
- 2006-10-25 Sold (MLS) $132,500 MLSOK
- 2006-07-15 Listed $132,500 MLSOK
- 2001-05-14 Sold (MLS) $95,900 MLSOK
- 2001-01-10 Listed $95,900 MLSOK
- 2000-11-01 Listed $97,607 MLSOK
Property tax history
+3.7%/yrLatest (2025): $2,421 · +5.3% YoY. Source: county tax records.
Cash-flow waterfall
monthlySold comps — $/sqft
last 12 mo · ≤1 miLoading sold comps…