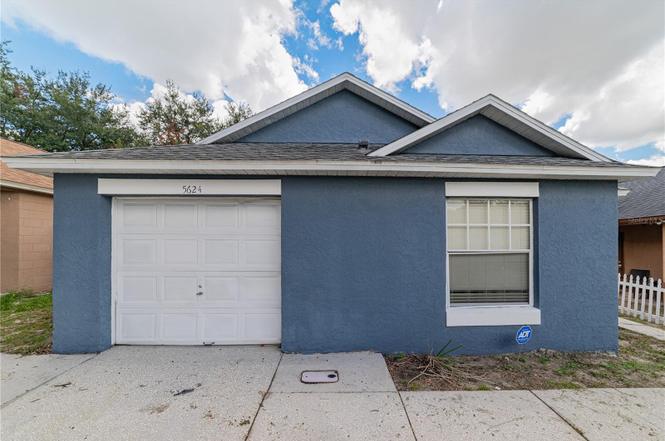
5624 Indialantic Dr · Pine Hills, FL
Flood risk 1/10 · Minimal
- FEMA flood zone
- X (unshaded)
- Chance of flooding over 30 yrs
- 0.0%
- Est. flood insurance / yr
- $507 – $1,088
Fire risk 1/10 · Minimal
- Est. fire insurance / yr
- $947 – $1,759
Heat risk 9/10 · Severe
- Hot days now (above 108°F)
- 7 days/yr
- Hot days in 30 yrs
- 22 days/yr
Wind risk 9/10 · Severe
- Chance of severe wind over 30 yrs
- 99.0%
Air-quality risk 1/10 · Minimal
- Unhealthy air days now
- 0 days/yr
- Unhealthy air days in 30 yrs
- 0 days/yr
Risk factors via First Street. Map © Google.
Why this score? — see what drove the D- grade
The composite is a weighted blend of 9 inputs, each scored 0–100. Each bar is that input's sub-score; the figure is the points it added to the 100-point composite (weight × sub-score).
- Cash flow +13.4/30.0
- Schools +4.1/10.0
- DSCR +4.0/10.0
- Livability +3.7/5.0
- ARV discount +3.4/15.0
- 1% rule +2.7/10.0
- Condition / age +2.5/5.0
- Rent growth +2.4/5.0
- Appreciation +0.0/10.0
$275,000
🖨 Deal sheet (PDF) 📄 Offer letter ✓ Due diligence
Listing remarks
* * SOLAR PANEL WILL BE PAID IN FULL. upto $10,0000 IN SELLER CONCESSION. Welcome to your next home or investment opportunity! This spacious 4-bedroom, 2-bathroom property is perfectly located just minutes from vibrant Downtown Orlando, major highways, and public transportation, making it ideal for city living without the hustle. Whether you're a first-time homebuyer looking for a move-in ready space or an investor seeking shared-living income potential, this home offers versatility, charm, and value. Generously Sized Bedrooms – Ideal for families or roommates, 2 Full Bathrooms – Convenience for all occupants, Open Living & Dining Areas – Great for entertaining or r
Key facts
- Move-in ready
- Major highways
- 4,444 sq ft lot
Tags
Property features AI
Finance
- HOA & community: Part of Silver Point Pines HOA; Monthly HOA $15 (annual $180); Street lights in community; Pets allowed
Exterior
- Parking: Attached garage (1 car, approx. 19 x 14)
- Security: Smoke detector(s)
- Utilities: Public water; Public sewer; Electricity available
- Home design: Single family residence; Residential property; One story; North-facing
- Construction: Block construction; Shingle roof; Slab foundation; Built on 0.1 acre lot
- Exterior features: Sidewalk; Wood fencing; Asphalt road access
Interior
- Kitchen: Dishwasher; Disposal; Range; Water filtration system; Water softener; Electric water heater
- Bedrooms: 4 bedrooms
- Flooring: Carpet; Ceramic tile
- Bathrooms: 2 full bathrooms
- Heating & cooling: Central heating; Central air conditioning
- Interior features: Ceiling fans; Eat-in kitchen; High ceilings; Kitchen/family room combo; Open floorplan; Vaulted ceilings; Attic (additional room); Total 8 rooms
- Laundry & utility: Washer hookup; Electric dryer hookup; Laundry area in garage
Neighborhood map
What this means for you Summary
Snapshot
- This is a 4-bed/2.0-bath single-family listed at $275k.
Deal economics
- At list price, monthly cash flow is $7 ($81/yr) — positive.
- The deal already cash-flows at list — no discount required.
- To meet the 1% rule (rent ≥ 1% of price), the offer needs to be $211k (23.1% below list).
- Recommended offer: $211k (23.1% below list) — sets the bar for 1% rule.
- Cap rate 6.3% vs local median 4.9% in Pine Hills — top-decile yield for the area; either an underpriced asset or a hidden risk that comps aren't pricing in. Stress-test before assuming the spread holds.
Location & tenants
- Location reads 73/100 on livability (#317 in FL) — a middle-class / working-renter tenant base. Strengths: commute A+, cost of living A+, housing A+; Watch: crime D+, employment D, amenities F.
- Orange (suburban): math 46% / reading 51% proficiency, ranked #43 of 73 in FL (top 59%) — families likely to look elsewhere, expect single-tenant / working-renter base with shorter leases.
- Zoned schools: Pine Hills Elementary (math 21% / reading 20%, grade F, #2,094 of 2,144 statewide, top 98%, 669 students, 83% FRL); Maynard Evans High (math 12% / reading 27%, grade F, #562 of 667 statewide, top 85%, 2,417 students, 69% FRL) — zoned schools average 76% FRL vs 56% district-wide (20 pts higher); higher-poverty schools than district average — tighter screening recommended.
- Zoned-school proficiency averages 20% at this address vs 48% district-wide (-28 pts) — the specific schools serving this property underperform the Orange average; the district grade overstates school quality for this exact location.
- Market conditions: Rents soft (-0.3%/yr); 246 active listings in the ZIP; 27 comparable units currently listed for rent nearby; rentals at typical pace (median 23d on market — plan ~3-4 weeks tenant-placement turnaround); 8,053 units permitted in Orange County in 2024 (3,133 in 5+ unit buildings).
- At $2,114/mo this rent would consume 51% of the median local household income ($50k/yr) (locally 4039% of renters already pay >50% of income on rent) — very limited rent-growth headroom before tenants either downsize or default.
Forward outlook
- Local home prices are declining (-3.0%/yr); year-one equity from $2k of loan paydown is wiped out by about $8k of value loss. Plan a longer hold.
- Orange County population projected at +52% by 2050 — long-run rental-demand tailwind backs the buy-and-hold thesis.
Negotiation context
- It's been on market 340 days — a 12% lower offer ($242k) is reasonable based on typical stale-listing flexibility.
- 3 sale attempts; this cycle's ask has dropped $55k (17%) from the opening price — seller is motivated, your offer sets the floor, not the list.
- Current owner paid $83k; list at $275k implies a 231% gain — meaningful room to come down on a strong offer.
Risks & watch-outs
- Climate carrying-cost: severe wind risk, 99% chance of damaging wind over 30y; extreme-heat days projected 7→22/yr by 2055 (HVAC capex compounding) — expect insurance premiums to compound above CPI over the hold.
Questions for the listing agent
- It's been on market 340 days. Have you received any prior offers? Is the seller open to a 23% concession, seller financing, or rate buy-down credit?
- What does the HOA fee cover, when was the last increase, and are there any pending special assessments or reserve-fund shortfalls?
- Why hasn't it sold? Are there any deal-killer items the seller is aware of (foundation, flood, title, zoning, code violations)?
- Is there a deadline driving the sale (1031 exchange, divorce, estate, relocation)? That informs how much negotiation room exists.
- Schools are B-rated — typically a magnet for longer-tenancy family renters. What's the average tenant stay here, and is there a school-zone premium baked into asking?
- Crime grade is D in this area — have there been break-ins, vandalism, or insurance claims at this property in the last 3 years? What carrier currently insures it and at what premium?
- The area grade is low — what's the realistic commute time and amenity access for the typical tenant pool here? Any planned neighborhood developments (good or bad) we should know about?
- What's the average days-on-market for RENTAL listings here right now (not sales)? A rising rental-DOM trend means longer vacancies and softer asking-rent achievability than the comps imply.
- What's the recent tenant-quality profile in this submarket — average credit score on applications, eviction rate, late-payment / NSF rate, and stable-employment percentage? A property-management company in the area should have these aggregated.
- How much new for-sale + rental construction is in the pipeline within 1–3 miles? Heavy new supply typically softens prices + rents 12–24 months out; constrained supply supports both.
Investment metrics
- 1% rule
- 0.77% ✗
- Cap rate
- 6.32%
- Cash-on-cash
- 0.11%
- DSCR
- 1.00
- GRM
- 10.8
CMA / ARV
- ARV (on-the-fly)
- $251,937
- Comps found
- 8
Show comp detail 8 sales within ~0.75 mi
| Address | Dist | Beds/Ba | Sqft | Sold | Price | $/sf | Match |
|---|---|---|---|---|---|---|---|
| 5308 Golf Club Pkwy | 0.36mi | 4/3.0 | 1,334 (+0%) | 0mo | $206,000 | $154 | 79 |
| 2024 Emeralda Ct | 0.39mi | 4/2.0 | 1,395 (+5%) | 8mo | $305,000 | $219 | 67 |
| 1809 Elm Ridge Ct | 0.14mi | 3/2.0 (-1) | 1,229 (-8%) | 11mo | $200,000 | $163 | 66 |
| 5815 Holmes Dr | 0.27mi | 3/2.0 (-1) | 1,232 (-8%) | 11mo | $290,000 | $235 | 60 |
| 1915 Ben Hogan Cir | 0.42mi | 3/2.0 (-1) | 1,346 (+1%) | 22mo | $255,000 | $189 | 56 |
| 5917 Wolf Rd | 0.40mi | 3/2.0 (-1) | 1,266 (-5%) | 16mo | $225,000 | $178 | 55 |
| 4835 Bennington Pl | 0.70mi | 3/2.0 (-1) | 1,342 (+1%) | 16mo | $295,000 | $220 | 48 |
| 1202 Elinore Dr | 0.72mi | 3/1.0 (-1) | 1,218 (-9%) | 24mo | $185,000 | $152 | 23 |
Match score weights: distance 35% · size 25% · config 20% · recency 20%. Top-matched comps best support the ARV.
Projected returns pro-forma
-3.0% appreciation · 0.0% rent growth · sell at horizon
- IRR
- -19.2%
- Equity multiple
- 0.34×
- Total profit
- $-50,442
- Equity at exit
- $41,003
- IRR
- -18.5%
- Equity multiple
- 0.12×
- Total profit
- $-67,778
- Equity at exit
- $23,777
Cash invested: $77,000 (down + closing). Projections, not guarantees.
Landlord ↔ Tenant lean methodology
- Overall (STATE)
- 87 Strongly Landlord-Friendly
- State Florida
- 87 Strongly Landlord-Friendly · R+3
- County
- — inherits STATE
- City
- — inherits STATE
ZIP-level market 32808
- Home prices YoY
- -22.6%
- Rents YoY
- -0.3%
- Active inventory
- 246
- Price-to-rent
- 10.8×
Monthly cashflow live
- Estimated rent
- $2,114 high interval (Pro) →
- Mortgage (P&I)
- −$1,442
- Tax from tax record
- −$92 /mo · $1,101/yr
- Insurance
- −$115
- HOA
- −$15
- Vacancy / Maint / Mgmt
- −$444
- Net cashflow
- $7
Break-even live
Sensitivity live
| Price | -10% $162 | -5% $85 | +0% $7 | +5% $-71 | +10% $-149 |
|---|---|---|---|---|---|
| Rent | -10% $-160 | -5% $-77 | +0% $7 | +5% $90 | +10% $174 |
| Rate | -1.0pp $145 | -0.5pp $77 | base $7 | +0.5pp $-65 | +1.0pp $-137 |
UW: 25.0% down · 7.5% · 30yr · 1.5% tax · 5.0% vac · 8.0% maint · 8.0% mgmt
Financing live
Cash to close
- Down payment
- $68,750
- Closing costs
- $8,250
- Reserves months
- —
- Total cash needed
- —
Loan-product check · same deal, 3 products live
Conventional
25% down · 7.5% · 30yr
- Down + closing
- —
- Monthly P&I
- —
- Monthly cashflow
- —
- DSCR
- —
- Eligible?
- —
Personal DTI + credit; lowest rate.
DSCR
20% down · 8.5% · 30yr
- Down + closing
- —
- Monthly P&I
- —
- Monthly cashflow
- —
- DSCR
- —
- Eligible?
- —
No personal income docs; deal must DSCR.
Hard money
10% down · 12.0% · 12mo
- Down + closing
- —
- Monthly P&I
- —
- Monthly cashflow
- —
- DSCR
- —
- Eligible?
- —
Short-term bridge; refi at stabilization.
Rent comps 27 comps
| Address | Beds | Baths | Sqft | Rent | $/sqft | DOM | Units | Dist |
|---|---|---|---|---|---|---|---|---|
| 1537 Ridge Pointe Dr Orlando, FL | 3.0 | 2.0 | 1108 | $2,200 | $1.99 | 24d | 1 | 0.11mi |
| 1529 Ridge Pointe Dr Orlando, FL | 3.0 | 2.0 | 1108 | $1,995 | $1.80 | 8d | 1 | 0.11mi |
| 2222 Silver Pines Pl #902 Orlando, FL | 3.0 | 2.5 | 1472 | $1,500 | $1.02 | 8d | 1 | 0.15mi |
| 5402 Pine Chase Dr Orlando, FL | 2.0–3.0 | 2.0 | 1133 | $1,695 | $1.50 | 2d | 4 | 0.19mi |
| 5600 Silver Star Rd Orlando, FL | 1.0–3.0 | 1.0–2.0 | 850 | $1,545 | $1.82 | 15d | 6 | 0.36mi |
| 5103 Cochita Dr Orlando, FL | 4.0 | 2.0 | 1168 | $1,995 | $1.71 | 24d | 1 | 0.43mi |
| 4901 Hernandes Dr Orlando, FL | 4.0 | 2.0 | 1124 | $1,830 | $1.63 | 24d | 1 | 0.62mi |
| 1214 N Pine Hills Rd Unit 1 Orlando, FL | 4.0 | 2.0 | 1069 | $3,900 | $3.65 | 21d | 1 | 0.65mi |
| 1020 barnett villas Dr Orlando, FL | 1.0–3.0 | 1.0–2.0 | 934 | $1,930 | $2.07 | 24d | 1 | 0.80mi |
| 1213 Roger Babson Rd Unit 1 Orlando, FL | 4.0 | 2.0 | 1380 | $2,499 | $1.81 | 8d | 1 | 0.82mi |
| 1407 Sunridge Rd Orlando, FL | 3.0 | 2.0 | 1124 | $1,945 | $1.73 | 8d | 1 | 0.84mi |
| 2429 Sandy Ln Orlando, FL | 3.0 | 2.0 | 1418 | $2,490 | $1.76 | 22d | 1 | 0.89mi |
| 6033 Balboa Dr Orlando, FL | 3.0 | 2.0 | 1269 | $2,300 | $1.81 | 22d | 1 | 0.91mi |
| 1737 Hinckley Rd Orlando, FL | 4.0 | 2.0 | 1661 | $2,481 | $1.49 | 2d | 1 | 0.94mi |
| 2637 Healy Dr Orlando, FL | 3.0 | 1.5 | 1300 | $1,900 | $1.46 | 5d | 1 | 0.97mi |
| 4566 Chateau Rd Orlando, FL | 3.0 | 1.5 | 1377 | $1,800 | $1.31 | 24d | 1 | 0.98mi |
| 6872 Alta Westgate Dr Orlando, FL | 2.0–3.0 | 2.0 | 1190 | $1,700 | $1.43 | 8d | 1 | 1.08mi |
| 5717 Fernhill Dr Orlando, FL | 3.0 | 1.0 | 1619 | $1,700 | $1.05 | 4d | 1 | 1.09mi |
| 1303 Charles St Orlando, FL | 3.0 | 2.0 | 1780 | $2,200 | $1.24 | 22d | 1 | 1.12mi |
| 6408 Sunshine St Orlando, FL | 3.0 | 1.5 | 1000 | $1,900 | $1.90 | 5d | 1 | 1.17mi |
| 5009 Deauville Dr Orlando, FL | 4.0 | 3.0 | 1224 | $2,000 | $1.63 | 24d | 1 | 1.21mi |
| 6623 Swyear Ct Orlando, FL | 4.0 | 2.0 | 1842 | $2,300 | $1.25 | 22d | 1 | 1.23mi |
| 4306 Silver Star Rd Orlando, FL | 3.0 | 2.0 | 1080 | $1,800 | $1.67 | 24d | 1 | 1.29mi |
| 1826 Mulberrywood Ct Orlando, FL | 4.0 | 2.0 | 1782 | $2,225 | $1.25 | 24d | 1 | 1.35mi |
| 1826 Mulberrywood Ct Orlando, FL | 4.0 | 2.0 | 1782 | $2,225 | $1.25 | 22d | 1 | 1.35mi |
| 3903 Pine Ridge Rd Orlando, FL | 4.0 | 1.5 | 1450 | $1,949 | $1.34 | 24d | 1 | 1.37mi |
| 3639 Shalimar Ct Orlando, FL | 4.0 | 2.0 | 1136 | $1,796 | $1.58 | 22d | 1 | 1.49mi |
HOA detail
- Monthly dues
- $15 · $180/yr
Listing history 27 events
-
2026-06-18days on market $275,000 Active 340 DOM
-
2026-06-17days on market $275,000 Active 339 DOM
-
2026-06-16days on market $275,000 Active 338 DOM
-
2026-06-15days on market $275,000 Active 337 DOM
-
2026-06-13days on market $275,000 Active 335 DOM
-
2026-06-13days on market $275,000 Active 334 DOM
-
2026-06-09days on market $275,000 Active 331 DOM
-
2026-06-08days on market $275,000 Active 330 DOM
-
2026-06-07days on market $275,000 Active 329 DOM
-
2026-06-04days on market $275,000 Active 326 DOM
-
2026-06-03days on market $275,000 Active 325 DOM
-
2026-06-02days on market $275,000 Active 324 DOM
-
2026-06-02days on market $275,000 Active 323 DOM
-
2026-05-31days on market $275,000 Active 322 DOM
-
2026-03-24status Active
-
2026-03-19status Pending
-
2026-03-04price $275,000
-
2026-01-15price $280,000
-
2025-12-31status Active
-
2025-12-30historical
-
2025-09-04price $300,000
-
2025-07-30price $320,000
-
2025-07-07$330,000 Active
-
2002-09-23soldstatus $83,000
-
1996-03-11soldstatus $79,800
-
1996-03-11soldstatus $79,800
-
1996-03-11soldstatus $79,800
ⓘ Source: listings_history table (triggers on properties + properties_extension) + one-shot
backfill from property_details.listing_events for pre-trigger history.
Tax reassessment forecast FL · Resets to sale price
- Current annual tax
- $1,101 · $92/mo
- Projected year-2 tax
- $2,282 · $190/mo
- Expected delta
- +$1,182/yr (+$98/mo · 107.4%)
ⓘ Screening estimate from a state-policy table — verify with the county assessor before closing.
Climate risk First Street
- Flood 1/10 Low FEMA zone X (unshaded) · 0% chance over 30 yrs
- Wildfire 1/10 Low
- Heat 9/10 Extreme 7 d/yr ≥108°F today · 22 d/yr by 30 yrs out
- Wind 9/10 Extreme 99% chance of damaging wind over 30 yrs
- Air quality 1/10 Low 0 unhealthy d/yr today · 0 by 30 yrs out
Nearby sold comps map
Loading sold comps map…
Walkable amenities ~0.75 mi
Loading nearby amenities…
Taxation est. · year 1
- Rental income
- $25,370
- − Mortgage interest
- −$15,404
- − Property taxes
- −$1,101
- − Insurance
- −$1,375
- − Repairs & maintenance
- −$2,030
- − Management
- −$2,030
- − HOA
- −$180
- − Depreciation
- −$8,000
- Taxable loss
- −$4,749
- Est. tax savings @ 24.0%
- +$1,140
- After-tax cash flow
- $1,221/yr
For passive investors: Depreciation is non-cash, so a rental often shows a tax loss while cash-flowing — sheltering income. Rental losses are passive: they offset passive income freely, and up to $25,000/yr can offset ordinary (W-2) income if you actively participate and your MAGI is under $100k (phasing out to $0 by $150k); unused losses carry forward. On sale, claimed depreciation is recaptured at up to 25%, and gains may owe capital-gains tax (a 1031 exchange can defer both). Figures are a year-1 estimate at your 24.0% rate — not tax advice; consult a CPA.
Schools (NCES district)
- District
- Orange
- NCES district ID
- 1201440
- Math proficiency
- 46% ▼ -9.00%
- Reading proficiency
- 51% ▼ -2.00%
- Median HH income
- $49,350
- Composite
- 41.47/100
- National rank
- #3461
- State rank
- #43 of 73 in FL
Livability — Pine Hills
- Score
- 73/100
- State rank
- #317
- US rank
- #5362
Category grades
Schools grade is shown separately in the Schools card above.
Census & demographics
- Census place
- Pine Hills, FL
- County
- Orange County · 1,471,359 people
- City population
- 60,203
- Metro
- Orlando-Kissimmee-Sanford, FL
- Population (ZIP)
- 60,203
- Household income
- $49,700
- Rent vs Own
- Severe rent burden
- 4039.0
Population outlook (Orange County) Hauer SSP2
- Today (2025)
- 1,618,226 people
- By 2030
- 1,787,404 · +10.5%
- By 2040
- 2,125,621 · +31.4%
- By 2050
- 2,454,016 · +51.6%
- By 2075
- 3,173,711 · +96.1%
- By 2100
- 3,607,781 · +122.9%
Race, ethnicity, and origin ACS 2023
- Neighborhood character
- Predominantly Black (71%)
- Race & ethnicity
- Black 71% Hispanic / Latino 13% White 10% Two or more races 7% Asian 1%
- Hispanic origin (detail)
- Mexican 2% Puerto Rican 5% Dominican 2%
- Common ancestry
- Hispanic 20% Lithuanian 1% Scandinavian 0%
- Foreign-born
- 25% · Canada, Vietnam, Jamaica
- Languages at home
- 69% English-only · French/Haitian/Cajun 18% Spanish 11% Other Indo-European 1%
Political lean MEDSL · Orange
- 2024 margin
- D (+13.6) · D 56.1% · R 42.5% · Other 1.3%
- 2008→2024 swing
- -5.0pp toward R · 2008: 18.6pp · 2024: 13.6pp
- All cycles
- 2024: D+13.6 2020: D+23.1 2016: D+24.6 2012: D+18.2 2008: D+18.6
Not yet ingested
- Civics
- —
Market trends
- HPI YoY
- ▼ -110.15%
- Current HPI
- 376.3801
- Rent YoY
- ▼ -0.27%
- Metro
- Orlando-Kissimmee-Sanford, FL
- State GDP YoY
- ▲ 3.28%
- F500 in state
- 36
Industry mix (Fortune 500 HQ in FL)
| Industry | F500 HQs | Revenue |
|---|---|---|
| Industrial Technology | 2 | $29B |
|
||
| Insurance | 2 | $17B |
|
||
| Retail | 1 | $60B |
|
||
| Technology Distribution | 1 | $58B |
|
||
| Homebuilding | 1 | $35B |
|
||
| Technology Manufacturing | 1 | $35B |
|
||
Price history
+244.6% since first listed13 events — show timeline
- 2026-03-24 Relisted — Stellar MLS as Distributed by MLS Grid
- 2026-03-19 Pending — Stellar MLS as Distributed by MLS Grid
- 2026-03-04 Price Changed $275,000 Stellar MLS as Distributed by MLS Grid
- 2026-01-15 Price Changed $280,000 Stellar MLS as Distributed by MLS Grid
- 2025-12-31 Relisted — Stellar MLS as Distributed by MLS Grid
- 2025-12-30 Listing Removed — Stellar MLS as Distributed by MLS Grid
- 2025-09-04 Price Changed $300,000 Stellar MLS as Distributed by MLS Grid
- 2025-07-30 Price Changed $320,000 Stellar MLS as Distributed by MLS Grid
- 2025-07-07 Listed $330,000 Stellar MLS as Distributed by MLS Grid
- 2002-09-23 Sold (Public Records) $83,000 Public Records
- 1996-03-11 Sold (Public Records) $79,800 Public Records
- 1996-03-11 Sold (Public Records) $79,800 Public Records
- 1996-03-11 Sold (Public Records) $79,800 Public Records
Property tax history
+2.4%/yrLatest (2025): $1,101 · +10.8% YoY. Source: county tax records.
Cash-flow waterfall
monthlySold comps — $/sqft
last 12 mo · ≤1 miLoading sold comps…