785 The Strand · East Marion, NY
Flood risk No data
- FEMA flood zone
- —
- Chance of flooding over 30 yrs
- —
- Est. flood insurance / yr
- —
Fire risk No data
- Est. fire insurance / yr
- —
Heat risk No data
- Hot days now (above threshold)
- —
- Hot days in 30 yrs
- —
Wind risk No data
- Chance of severe wind over 30 yrs
- —
Air-quality risk No data
- Unhealthy air days now
- —
- Unhealthy air days in 30 yrs
- —
Risk factors via First Street. Map © Google.
Why this score? — see what drove the D grade
The composite is a weighted blend of 9 inputs, each scored 0–100. Each bar is that input's sub-score; the figure is the points it added to the 100-point composite (weight × sub-score).
- Cash flow +15.2/30.0
- Appreciation +6.7/10.0
- DSCR +4.6/10.0
- Schools +4.3/10.0
- 1% rule +3.6/10.0
- Livability +2.9/5.0
- Rent growth +2.5/5.0
- Condition / age +2.5/5.0
- ARV discount +0.0/15.0
$1,545,000
🖨 Deal sheet (PDF) 📄 Offer letter ✓ Due diligence
Listing remarks MLS
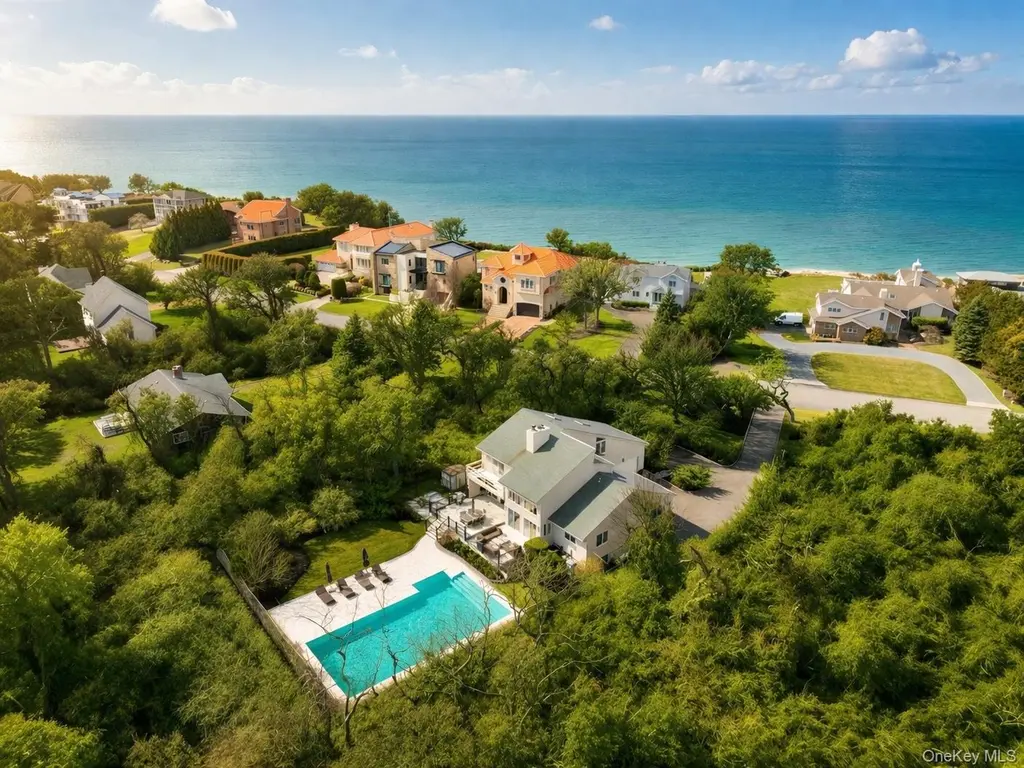
Coastal Living, Without the Crowds Set along one of East Marion's most coveted waterfront stretches, 785 The Strand offers a rare blend of privacy, natural beauty, and effortless coastal living. Experience quiet luxury with direct beach access-without the crowds. Perched above the shoreline and directly across from the Long Island Sound, this thoughtfully designed residence captures the understated elegance of the North Fork lifestyle. Surrounded by mature landscaping and sited to take full advantage of its coastal setting, the .56-acre property features a light-filled, two-story home with five bedrooms and four baths, complemented by an oversized pool, two fireplaces, and multiple outdoor spaces designed for both entertaining and relaxation. Open, airy, and filled with natural light, the home is designed to maximize comfort and connection to its surroundings, which include protected Pebble Beach-communally-owned "no development" lots to the east and south. Expansive windows frame the landscape, while clean architectural lines and warm finishes create a refined yet relaxed atmosphere. Here, beach access is part of everyday life, not an occasion. Also ideally located near marinas, farm stands, wineries, golf courses, and a short drive to Greenport Village. This is a rare opportunity to own in one of the North Fork's most desirable and tightly held locations.
Key facts
- Coastal setting
- Expansive windows
- Oversized pool
Tags
Neighborhood map
What this means for you Summary
Snapshot
- This is a 4-bed/3.0-bath single-family listed at $1.54M.
Deal economics
- At list price, monthly cash flow is $526 ($6k/yr) — positive.
- The deal already cash-flows at list — no discount required.
- To meet the 1% rule (rent ≥ 1% of price), the offer needs to be $1.32M (14.4% below list).
- Recommended offer: $1.32M (14.4% below list) — sets the bar for 1% rule.
Location & tenants
- Location reads 58/100 on livability (#1,051 in NY) — a working-class tenant base; expect higher turnover. Strengths: crime A+, employment A+, health & safety A; Watch: housing C-, amenities F, commute F.
- Oysterponds Union Free School District (rural): math 30% / reading 60% proficiency, ranked #506 of 755 in NY (top 67%) — families likely to look elsewhere, expect single-tenant / working-renter base with shorter leases; only 4% free/reduced lunch — higher-income household profile.
- Zoned schools: Oysterponds Elementary School (math 54% / reading 64%, grade B-, #745 of 2,108 statewide, top 39%, 80 students, 0% FRL) — zoned schools at 0% FRL track the district average.
- Zoned-school proficiency averages 60% at this address vs 45% district-wide (+14 pts) — the actual schools serving this property are materially stronger than the Oysterponds Union Free School District average implies; a family-tenant draw the district grade alone would hide.
- Market conditions: 19 active listings in the ZIP; 8 comparable units currently listed for rent nearby; rentals lingering (median 46d on market — plan ~5-8 weeks vacancy on turnover, expect pricing pressure); 62% of comp listings sitting > 30 days — soft ceiling on asking rent; 1,366 units permitted in Suffolk County in 2024 (216 in 5+ unit buildings).
Forward outlook
- In year one you build about $64k of equity ($11k loan paydown + $54k appreciation (3.5% local appreciation)).
- Suffolk County population projected to shrink 5% by 2050 — rents likely to lag national; underwrite the cash flow, not the appreciation.
- At projected returns (3.5% appreciation + 3.0% rent growth), your $433k cash investment doubles in ~6 years — after that, you're playing with house money.
- By year 2, paydown + projected appreciation supports a ~$104k cash-out refi (75% LTV) — recoverable capital for the next deal without selling this one.
Negotiation context
- It's been on market 91 days — a 9% lower offer ($1.41M) is reasonable based on typical stale-listing flexibility.
Questions for the listing agent
- It's been on market 91 days. Have you received any prior offers? Is the seller open to a 14% concession, seller financing, or rate buy-down credit?
- What does the HOA fee cover, when was the last increase, and are there any pending special assessments or reserve-fund shortfalls?
- Why hasn't it sold? Are there any deal-killer items the seller is aware of (foundation, flood, title, zoning, code violations)?
- Is there a deadline driving the sale (1031 exchange, divorce, estate, relocation)? That informs how much negotiation room exists.
- Schools are D-rated, which usually means shorter tenancies and higher turnover. Who's the typical renter profile here, and what's been the actual vacancy rate?
- The area grade is low — what's the realistic commute time and amenity access for the typical tenant pool here? Any planned neighborhood developments (good or bad) we should know about?
- What's the average days-on-market for RENTAL listings here right now (not sales)? A rising rental-DOM trend means longer vacancies and softer asking-rent achievability than the comps imply.
- What's the recent tenant-quality profile in this submarket — average credit score on applications, eviction rate, late-payment / NSF rate, and stable-employment percentage? A property-management company in the area should have these aggregated.
- How much new for-sale + rental construction is in the pipeline within 1–3 miles? Heavy new supply typically softens prices + rents 12–24 months out; constrained supply supports both.
Investment metrics
- 1% rule
- 0.86% ✗
- Cap rate
- 6.70%
- Cash-on-cash
- 1.46%
- DSCR
- 1.06
- GRM
- 9.7
CMA / ARV
- ARV (median comp)
- $1,187,920
- List price
- $1,545,000
- Delta
- 30.06%
- Verdict
- OVERPRICED
- Comps
- 10 within 1.0 mi
Show comp detail 1 sale within ~0.75 mi
| Address | Dist | Beds/Ba | Sqft | Sold | Price | $/sf | Match |
|---|---|---|---|---|---|---|---|
| 3130 Rocky Point Rd | 0.42mi | 3/2.0 (-1) | 1,764 (-12%) | 22mo | $925,000 | $524 | 34 |
Match score weights: distance 35% · size 25% · config 20% · recency 20%. Top-matched comps best support the ARV.
Projected returns pro-forma
3.47% appreciation · 3.0% rent growth · sell at horizon
- IRR
- 10.1%
- Equity multiple
- 1.60×
- Total profit
- $258,146
- Equity at exit
- $735,938
- IRR
- 12.2%
- Equity multiple
- 2.91×
- Total profit
- $824,779
- Equity at exit
- $1,167,329
Cash invested: $432,600 (down + closing). Projections, not guarantees.
Landlord ↔ Tenant lean methodology
- Overall (STATE)
- 15 Strongly Tenant-Friendly
- State New York
- 15 Strongly Tenant-Friendly · D+10
- County
- — inherits STATE
- City
- — inherits STATE
ZIP-level market 11939
- Home prices YoY
- 1.2%
- Active inventory
- 19
- Price-to-rent
- 9.7×
Monthly cashflow live
- Estimated rent
- $13,226 high interval (Pro) →
- Mortgage (P&I)
- −$8,102
- Tax from tax record
- −$476 /mo · $5,717/yr
- Insurance
- −$644
- HOA
- −$700
- Vacancy / Maint / Mgmt
- −$2,778
- Net cashflow
- $526
Break-even live
Sensitivity live
| Price | -10% $1,401 | -5% $964 | +0% $526 | +5% $89 | +10% $-348 |
|---|---|---|---|---|---|
| Rent | -10% $-518 | -5% $4 | +0% $526 | +5% $1,049 | +10% $1,571 |
| Rate | -1.0pp $1,304 | -0.5pp $919 | base $526 | +0.5pp $126 | +1.0pp $-281 |
UW: 25.0% down · 7.5% · 30yr · 1.5% tax · 5.0% vac · 8.0% maint · 8.0% mgmt
Financing live
Cash to close
- Down payment
- $386,250
- Closing costs
- $46,350
- Reserves months
- —
- Total cash needed
- —
Loan-product check · same deal, 3 products live
Conventional
25% down · 7.5% · 30yr
- Down + closing
- —
- Monthly P&I
- —
- Monthly cashflow
- —
- DSCR
- —
- Eligible?
- —
Personal DTI + credit; lowest rate.
DSCR
20% down · 8.5% · 30yr
- Down + closing
- —
- Monthly P&I
- —
- Monthly cashflow
- —
- DSCR
- —
- Eligible?
- —
No personal income docs; deal must DSCR.
Hard money
10% down · 12.0% · 12mo
- Down + closing
- —
- Monthly P&I
- —
- Monthly cashflow
- —
- DSCR
- —
- Eligible?
- —
Short-term bridge; refi at stabilization.
Rent comps 8 comps
| Address | Beds | Baths | Sqft | Rent | $/sqft | DOM | Units | Dist |
|---|---|---|---|---|---|---|---|---|
| 3045 Rocky Point Rd East Marion, NY | 3.0 | 2.0 | 2025 | $12,000 | $5.93 | 45d | 1 | 0.38mi |
| 870 Stars Rd East Marion, NY | 3.0 | 3.0 | 1500 | $10,000 | $6.67 | 45d | 1 | 0.82mi |
| 460 Bay Ave East Marion, NY | 3.0 | 1.5 | 1500 | $8,000 | $5.33 | 45d | 1 | 0.93mi |
| 1110 Gillette Dr East Marion, NY | 4.0 | 2.0 | 1500 | $7,000 | $4.67 | 20d | 1 | 1.01mi |
| 300 Marion Pl East Marion, NY | 3.0 | 2.0 | 1750 | $19,000 | $10.86 | 26d | 1 | 1.05mi |
| 580 South Ln East Marion, NY | 3.0 | 2.5 | 2000 | $20,000 | $10.00 | 20d | 1 | 1.27mi |
| 11930 Main Rd East Marion, NY | 4.0 | 2.0 | 2200 | $3,500 | $1.59 | 45d | 1 | 1.29mi |
| 485 Sutton Pl Greenport, NY | 4.0 | 2.5 | 2026 | $20,000 | $9.87 | 45d | 1 | 1.35mi |
HOA detail
- Monthly dues
- $700 · $8,400/yr
- Likely covers
- waterlandscapingpool
Listing history 19 events
-
2026-06-22days on market $1,545,000 Active 91 DOM
-
2026-06-21days on market $1,545,000 Active 90 DOM
-
2026-06-21days on market $1,545,000 Active 89 DOM
-
2026-06-18days on market $1,545,000 Active 87 DOM
-
2026-06-17days on market $1,545,000 Active 86 DOM
-
2026-06-16days on market $1,545,000 Active 85 DOM
-
2026-06-15days on market $1,545,000 Active 84 DOM
-
2026-06-13days on market $1,545,000 Active 82 DOM
-
2026-06-12days on market $1,545,000 Active 81 DOM
-
2026-06-09days on market $1,545,000 Active 78 DOM
-
2026-06-08days on market $1,545,000 Active 77 DOM
-
2026-06-07days on market $1,545,000 Active 76 DOM
-
2026-06-07days on market $1,545,000 Active 75 DOM
-
2026-06-04days on market $1,545,000 Active 72 DOM
-
2026-06-02days on market $1,545,000 Active 71 DOM
-
2026-06-01days on market $1,545,000 Active 70 DOM
-
2026-05-31days on market $1,545,000 Active 69 DOM
-
2026-05-31price $1,545,000 Active 68 DOM
-
2026-03-23$1,595,000 Active 1389-char remark
Show marketing remark (1389 chars)
Coastal Living, Without the Crowds Set along one of East Marion's most coveted waterfront stretches, 785 The Strand offers a rare blend of privacy, natural beauty, and effortless coastal living. Experience quiet luxury with direct beach access-without the crowds. Perched above the shoreline and directly across from the Long Island Sound, this thoughtfully designed residence captures the understated elegance of the North Fork lifestyle. Surrounded by mature landscaping and sited to take full advantage of its coastal setting, the .56-acre property features a light-filled, two-story home with five bedrooms and four baths, complemented by an oversized pool, two fireplaces, and multiple outdoor spaces designed for both entertaining and relaxation. Open, airy, and filled with natural light, the home is designed to maximize comfort and connection to its surroundings, which include protected Pebble Beach-communally-owned "no development" lots to the east and south. Expansive windows frame the landscape, while clean architectural lines and warm finishes create a refined yet relaxed atmosphere. Here, beach access is part of everyday life, not an occasion. Also ideally located near marinas, farm stands, wineries, golf courses, and a short drive to Greenport Village. This is a rare opportunity to own in one of the North Fork's most desirable and tightly held locations.
ⓘ Source: listings_history table (triggers on properties + properties_extension) + one-shot
backfill from property_details.listing_events for pre-trigger history.
Tax reassessment forecast NY · Partial reset (capped growth)
- Current annual tax
- $5,717 · $476/mo
- Projected year-2 tax
- $15,914 · $1,326/mo
- Expected delta
- +$10,197/yr (+$850/mo · 178.3%)
ⓘ Screening estimate from a state-policy table — verify with the county assessor before closing.
Nearby sold comps map
Loading sold comps map…
Walkable amenities ~0.75 mi
Loading nearby amenities…
Taxation est. · year 1
- Rental income
- $158,715
- − Mortgage interest
- −$86,544
- − Property taxes
- −$5,717
- − Insurance
- −$7,725
- − Repairs & maintenance
- −$12,697
- − Management
- −$12,697
- − HOA
- −$8,400
- − Depreciation
- −$44,945
- Taxable loss
- −$20,011
- Est. tax savings @ 24.0%
- +$4,803
- After-tax cash flow
- $11,120/yr
For passive investors: Depreciation is non-cash, so a rental often shows a tax loss while cash-flowing — sheltering income. Rental losses are passive: they offset passive income freely, and up to $25,000/yr can offset ordinary (W-2) income if you actively participate and your MAGI is under $100k (phasing out to $0 by $150k); unused losses carry forward. On sale, claimed depreciation is recaptured at up to 25%, and gains may owe capital-gains tax (a 1031 exchange can defer both). Figures are a year-1 estimate at your 24.0% rate — not tax advice; consult a CPA.
Schools (NCES district)
- District
- Oysterponds Union Free School District
- NCES district ID
- 3621930
- Math proficiency
- 30% ▼ -10.00%
- Reading proficiency
- 60% ▲ 20.00%
- Median HH income
- $71,948
- Composite
- 42.9/100
- National rank
- #6712
- State rank
- #506 of 755 in NY
Livability — East Marion
- Score
- 58/100
- State rank
- #1051
- US rank
- #20822
Category grades
Schools grade is shown separately in the Schools card above.
Census & demographics
- Census place
- East Marion, NY
- Population (ZIP)
- 1,741
Population outlook (Suffolk County) Hauer SSP2
- Today (2025)
- 1,505,262 people
- By 2030
- 1,498,318 · -0.5%
- By 2040
- 1,471,101 · -2.3%
- By 2050
- 1,424,848 · -5.3%
- By 2075
- 1,337,157 · -11.2%
- By 2100
- 1,217,720 · -19.1%
Race, ethnicity, and origin ACS 2023
- Neighborhood character
- Predominantly White (93%)
- Race & ethnicity
- White 93% Hispanic / Latino 4% Two or more races 2%
- Common ancestry
- Romanian 4% Scottish 1% Scotch-Irish 1%
- Foreign-born
- 9% · China
- Languages at home
- 89% English-only · Other Indo-European 7% Other Asian/Pacific 3% German/W. Germanic 1%
Political lean MEDSL · Suffolk
- 2024 margin
- Lean R (+10.0) · D 45.0% · R 55.0%
- 2008→2024 swing
- -16.0pp toward R · 2008: 6.0pp · 2024: -10.0pp
- All cycles
- 2024: R+10.0 2020: R+0.0 2016: R+8.2 2012: D+2.9 2008: D+6.0
Not yet ingested
- Civics
- —
Market trends
- HPI YoY
- ▲ 3.47%
- Current HPI
- 281.05
- Rent YoY
- —
- Metro
- —
- State GDP YoY
- ▲ 2.60%
- F500 in state
- 92
Industry mix (Fortune 500 HQ in NY)
| Industry | F500 HQs | Revenue |
|---|---|---|
| Financial Services | 10 | $950B |
|
||
| Consumer Goods | 9 | $162B |
|
||
| Insurance | 4 | $225B |
|
||
| Telecommunications | 2 | $144B |
|
||
| Pharmaceuticals | 2 | $112B |
|
||
| Media / Entertainment | 2 | $69B |
|
||
Price history
1 event — show timeline
- 2026-03-23 Listed $1,595,000 OneKey® MLS as Distributed by MLS Grid
Property tax history
-1.7%/yrLatest (2025): $5,717 · +0.0% YoY. Source: county tax records.
Cash-flow waterfall
monthlySold comps — $/sqft
last 12 mo · ≤1 miLoading sold comps…