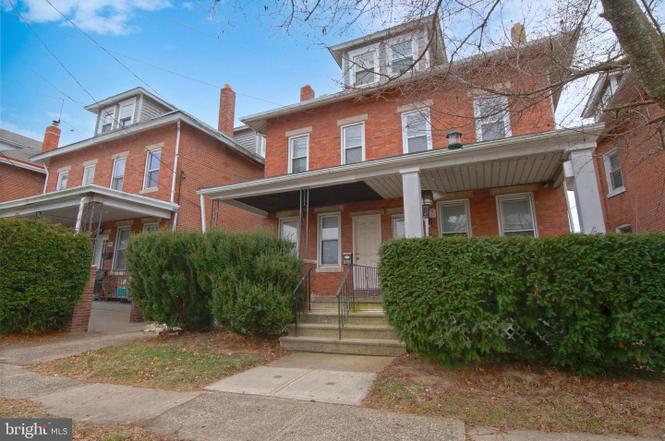
1406 Brunswick Ave Ave · Trenton, NJ
Flood risk 1/10 · Minimal
- FEMA flood zone
- X (unshaded)
- Chance of flooding over 30 yrs
- 0.0%
- Est. flood insurance / yr
- $507 – $1,088
Fire risk 1/10 · Minimal
- Est. fire insurance / yr
- $526 – $976
Heat risk 6/10 · Moderate
- Hot days now (above 101°F)
- 7 days/yr
- Hot days in 30 yrs
- 15 days/yr
Wind risk 6/10 · Moderate
- Chance of severe wind over 30 yrs
- 27.0%
Air-quality risk 5/10 · Moderate
- Unhealthy air days now
- 6 days/yr
- Unhealthy air days in 30 yrs
- 8 days/yr
Risk factors via First Street. Map © Google.
Why this score? — see what drove the C- grade
The composite is a weighted blend of 9 inputs, each scored 0–100. Each bar is that input's sub-score; the figure is the points it added to the 100-point composite (weight × sub-score).
- Cash flow +16.6/30.0
- ARV discount +15.0/15.0
- DSCR +5.1/10.0
- 1% rule +4.2/10.0
- Livability +3.8/5.0
- Rent growth +3.3/5.0
- Condition / age +2.5/5.0
- Schools +0.7/10.0
- Appreciation +0.0/10.0
$289,999
🖨 Deal sheet (PDF) 📄 Offer letter ✓ Due diligence
Listing remarks
Space, location, and versatility come together at 1406 Brunswick Ave in the desirable Top Road section of Trenton. This semi-detached Colonial-style home offers an impressive layout featuring 4 bedrooms, 2 full bathrooms, a finished attic, and a full basement, delivering far more room than meets the eye. Convenience is a major highlight of this home’s location. Situated within walking distance to public transportation, shopping, and everyday amenities, and just minutes from major highways, this property is ideal for commuters and anyone seeking easy access throughout Trenton and beyond. Whether you’re a homeowner looking for space and value or an investor seeking a well-located
Key facts
- Built 1915
- Listed 154 days
Property features AI
Finance
- Other: Not located in a federal flood zone; Pets allowed with no restrictions
- Financial info: Lease not considered
Exterior
- Parking: On-street parking
- Utilities: Public water; Public sewer; Municipal trash collection
- Home design: Semi-detached property; Pitched shingle roof; Fee simple ownership; Above-grade and below-grade structures
- Construction: Brick construction; Other foundation type; Full basement
- Exterior features: Chain link fencing; Cul-de-sac lot
Interior
- Kitchen: Eat-in kitchen
- Bedrooms: Three bedrooms on the first upper level; One bedroom on the main level; Rooms include living room, master bedroom, and three additional bedrooms
- Bathrooms: Two full bathrooms (one on main level, one on first upper level)
- Heating & cooling: Central heating; Wall unit cooling; Natural gas heating and hot water
- Interior features: Eat-in kitchen; Attic; Not furnished
- Laundry & utility: Laundry in basement
Neighborhood map
What this means for you Summary
Snapshot
- This is a 4-bed/2.0-bath single-family listed at $290k.
Deal economics
- At list price, monthly cash flow is $175 ($2k/yr) — positive.
- The deal already cash-flows at list — no discount required.
- To meet the 1% rule (rent ≥ 1% of price), the offer needs to be $267k (7.9% below list).
- Recommended offer: $255k (12.0% below list) — sets the bar for market timing.
Location & tenants
- Location reads 76/100 on livability (#133 in NJ, #3,533 nationally) — a middle-class / working-renter tenant base. Strengths: amenities A+, commute A+, health & safety A+; Watch: crime F, employment F.
- Trenton Public School District (urban): math 2% / reading 16% proficiency, ranked #471 of 472 in NJ (top 100%) — low school quality limits family demand, transient renter base, plan for 1-2y turnover; 80% free/reduced lunch — lower-income household profile, screen leases tightly.
- Zoned schools: Columbus Elementary School (math 2% / reading 17%, grade F, #1,235 of 1,303 statewide, top 96%, 296 students, 74% FRL); Dunn Middle School (math 2% / reading 19%, grade F, #424 of 431 statewide, top 98%, 670 students, 60% FRL); Trenton Central High School - Main Campus (math 2% / reading 10%, grade F, #396 of 399 statewide, top 99%, 2,255 students, 56% FRL) — zoned schools average 63% FRL vs 80% district-wide (17 pts lower); this property's tenant base skews higher-income than the district average.
- Market conditions: Rents rising (+3.3%/yr); 83 active listings in the ZIP; 19 comparable units currently listed for rent nearby; rentals at typical pace (median 16d on market — plan ~3-4 weeks tenant-placement turnaround); 2,256 units permitted in Mercer County in 2024 (1,303 in 5+ unit buildings).
- At $2,672/mo this rent would consume 48% of the median local household income ($67k/yr) (locally 1185% of renters already pay >50% of income on rent) — very limited rent-growth headroom before tenants either downsize or default.
Forward outlook
- Local home prices are declining (-3.0%/yr); year-one equity from $2k of loan paydown is wiped out by about $9k of value loss. Plan a longer hold.
- Mercer County population projected at +4% by 2050 — modest demand growth; plan on rents tracking national, not racing it.
Negotiation context
- It's been on market 154 days — a 12% lower offer ($255k) is reasonable based on typical stale-listing flexibility.
- 6 sale attempts since 13y ago; this cycle's ask has dropped $25k (8%) from the opening price — seller is motivated, your offer sets the floor, not the list.
- Current owner paid $86k; list at $290k implies a 237% gain — meaningful room to come down on a strong offer.
Risks & watch-outs
- Watch-outs: built in 1915 — expect roof / HVAC / electrical / plumbing capex.
- Climate carrying-cost: major wind risk, 27% chance of damaging wind over 30y; extreme-heat days projected 7→15/yr by 2055 (HVAC capex compounding) — expect insurance premiums to compound above CPI over the hold.
Questions for the listing agent
- It's been on market 154 days. Have you received any prior offers? Is the seller open to a 12% concession, seller financing, or rate buy-down credit?
- Built in 1915 — when were the roof, HVAC, electrical panel, plumbing, and water heater last replaced?
- Why hasn't it sold? Are there any deal-killer items the seller is aware of (foundation, flood, title, zoning, code violations)?
- Is there a deadline driving the sale (1031 exchange, divorce, estate, relocation)? That informs how much negotiation room exists.
- Schools are F-rated, which usually means shorter tenancies and higher turnover. Who's the typical renter profile here, and what's been the actual vacancy rate?
- Crime grade is F in this area — have there been break-ins, vandalism, or insurance claims at this property in the last 3 years? What carrier currently insures it and at what premium?
- What's the average days-on-market for RENTAL listings here right now (not sales)? A rising rental-DOM trend means longer vacancies and softer asking-rent achievability than the comps imply.
- What's the recent tenant-quality profile in this submarket — average credit score on applications, eviction rate, late-payment / NSF rate, and stable-employment percentage? A property-management company in the area should have these aggregated.
- How much new for-sale + rental construction is in the pipeline within 1–3 miles? Heavy new supply typically softens prices + rents 12–24 months out; constrained supply supports both.
Investment metrics
- 1% rule
- 0.92% ✗
- Cap rate
- 7.02%
- Cash-on-cash
- 2.58%
- DSCR
- 1.11
- GRM
- 9.0
CMA / ARV
- ARV (on-the-fly)
- $370,200
- Comps found
- 11
Show comp detail 11 sales within ~0.75 mi
| Address | Dist | Beds/Ba | Sqft | Sold | Price | $/sf | Match |
|---|---|---|---|---|---|---|---|
| 709 Mulberry St S | 0.25mi | 3/2.0 (-1) | 1,240 (+0%) | 8mo | $285,000 | $230 | 76 |
| 929 Lanning Ave | 0.14mi | 3/1.0 (-1) | 1,248 (+1%) | 8mo | $400,000 | $321 | 76 |
| 83 Helen Ave | 0.41mi | 4/2.0 | 1,281 (+4%) | 7mo | $399,900 | $312 | 69 |
| 1588 Brunswick Ave | 0.19mi | 3/1.0 (-1) | 1,268 (+3%) | 15mo | $380,000 | $300 | 65 |
| 1314 Indiana Ave | 0.14mi | 3/2.0 (-1) | 1,160 (-6%) | 19mo | $350,000 | $302 | 63 |
| 2102 Princeton Pike | 0.61mi | 4/1.0 | 1,178 (-4%) | 9mo | $349,500 | $297 | 52 |
| 140 Slack Ave | 0.64mi | 4/1.0 | 1,260 (+2%) | 19mo | $365,000 | $290 | 47 |
| 718 Trumbull Ave | 0.51mi | 3/1.0 (-1) | 1,124 (-9%) | 7mo | $385,000 | $343 | 47 |
| 524 St Joes | 0.62mi | 3/1.0 (-1) | 1,260 (+2%) | 16mo | $185,000 | $147 | 45 |
| 747 Putnam Ave | 0.41mi | 3/1.0 (-1) | 1,374 (+11%) | 14mo | $380,000 | $277 | 42 |
| 19 Graf Ave | 0.73mi | 3/2.0 (-1) | 1,410 (+14%) | 6mo | $449,000 | $318 | 32 |
Match score weights: distance 35% · size 25% · config 20% · recency 20%. Top-matched comps best support the ARV.
Projected returns pro-forma
-3.0% appreciation · 3.31% rent growth · sell at horizon
- IRR
- -11.9%
- Equity multiple
- 0.57×
- Total profit
- $-35,021
- Equity at exit
- $43,240
- IRR
- -2.3%
- Equity multiple
- 0.84×
- Total profit
- $-12,708
- Equity at exit
- $25,074
Cash invested: $81,200 (down + closing). Projections, not guarantees.
Landlord ↔ Tenant lean methodology
- Overall (STATE)
- 21 Tenant-Leaning
- State New Jersey
- 21 Tenant-Leaning · D+6
- County
- — inherits STATE
- City
- — inherits STATE
ZIP-level market 08638
- Rents YoY
- 3.3%
- Active inventory
- 83
- Price-to-rent
- 9.0×
Monthly cashflow live
- Estimated rent
- $2,672 high interval (Pro) →
- Mortgage (P&I)
- −$1,521
- Tax from tax record
- −$294 /mo · $3,534/yr
- Insurance
- −$121
- HOA
- −$0
- Vacancy / Maint / Mgmt
- −$561
- Net cashflow
- $175
Break-even live
Sensitivity live
| Price | -10% $339 | -5% $257 | +0% $175 | +5% $93 | +10% $11 |
|---|---|---|---|---|---|
| Rent | -10% $-36 | -5% $69 | +0% $175 | +5% $280 | +10% $386 |
| Rate | -1.0pp $321 | -0.5pp $249 | base $175 | +0.5pp $100 | +1.0pp $23 |
UW: 25.0% down · 7.5% · 30yr · 1.5% tax · 5.0% vac · 8.0% maint · 8.0% mgmt
Financing live
Cash to close
- Down payment
- $72,500
- Closing costs
- $8,700
- Reserves months
- —
- Total cash needed
- —
Loan-product check · same deal, 3 products live
Conventional
25% down · 7.5% · 30yr
- Down + closing
- —
- Monthly P&I
- —
- Monthly cashflow
- —
- DSCR
- —
- Eligible?
- —
Personal DTI + credit; lowest rate.
DSCR
20% down · 8.5% · 30yr
- Down + closing
- —
- Monthly P&I
- —
- Monthly cashflow
- —
- DSCR
- —
- Eligible?
- —
No personal income docs; deal must DSCR.
Hard money
10% down · 12.0% · 12mo
- Down + closing
- —
- Monthly P&I
- —
- Monthly cashflow
- —
- DSCR
- —
- Eligible?
- —
Short-term bridge; refi at stabilization.
Rent comps 19 comps
| Address | Beds | Baths | Sqft | Rent | $/sqft | DOM | Units | Dist |
|---|---|---|---|---|---|---|---|---|
| 1040 Indiana Ave Trenton, NJ | 3.0 | 1.0 | 1232 | $2,950 | $2.39 | 15d | 1 | 0.16mi |
| 331 Ellis Ave Trenton, NJ | 3.0 | 1.0 | 1190 | $2,275 | $1.91 | 23d | 1 | 0.47mi |
| 416 Klagg Ave Trenton, NJ | 3.0 | 1.0 | 1034 | $2,300 | $2.22 | 23d | 1 | 0.50mi |
| 901 Brunswick Ave #7 Trenton, NJ | 3.0 | 1.0 | 940 | $2,800 | $2.98 | 15d | 1 | 0.50mi |
| 1314 Princeton Ave Trenton, NJ | 4.0 | 1.0 | 1092 | $2,400 | $2.20 | 15d | 1 | 0.73mi |
| 21 Adella Ave Trenton, NJ | 3.0 | 1.0 | 1280 | $2,000 | $1.56 | 15d | 1 | 0.98mi |
| 25 Adella Ave Trenton, NJ | 3.0 | 1.0 | 1280 | $2,050 | $1.60 | 15d | 1 | 0.99mi |
| 1165 E State St Trenton, NJ | 3.0 | 1.0 | 900 | $1,749 | $1.94 | 15d | 1 | 1.22mi |
| 219 Woodlawn Ave Trenton, NJ | 3.0 | 1.0 | 1456 | $2,355 | $1.62 | 15d | 1 | 1.26mi |
| 8 Joan Ter Trenton, NJ | 3.0 | 2.0 | 1397 | $3,250 | $2.33 | 23d | 1 | 1.31mi |
| 42 Grant St Trenton, NJ | 4.0 | 1.0 | 1000 | $2,000 | $2.00 | 15d | 1 | 1.32mi |
| 130 W Ingham Ave Trenton, NJ | 4.0 | 1.0 | 1126 | $2,000 | $1.78 | 15d | 1 | 1.35mi |
| 24 New Trent St Trenton, NJ | 3.0 | 2.0 | 1336 | $2,350 | $1.76 | 15d | 1 | 1.37mi |
| 417 Walnut Ave Trenton, NJ | 3.0 | 1.0 | 992 | $2,050 | $2.07 | 23d | 1 | 1.38mi |
| 340 Connecticut Ave Unit 2 Hamilton Township, NJ | 3.0 | 1.0 | 1400 | $2,850 | $2.04 | 15d | 1 | 1.40mi |
| 1100 Prospect St Unit 1 Ewing Township, NJ | 3.0 | 1.0 | 1100 | $2,000 | $1.82 | 23d | 1 | 1.41mi |
| 134 Old Rose St Trenton, NJ | 4.0 | 2.0 | 1212 | $2,300 | $1.90 | 23d | 1 | 1.47mi |
| 11 Heath St Ewing, NJ | 3.0 | 1.0 | 1038 | $2,850 | $2.75 | 15d | 1 | 1.47mi |
| 234 Walnut Ave Trenton, NJ | 4.0 | 1.0 | 1480 | $2,200 | $1.49 | 23d | 1 | 1.50mi |
Listing history 29 events
-
2026-06-14statusdays on market $289,999 Pending 154 DOM
-
2026-06-10days on market $289,999 Active 153 DOM
-
2026-06-09days on market $289,999 Active 152 DOM
-
2026-06-08days on market $289,999 Active 151 DOM
-
2026-06-07days on market $289,999 Active 150 DOM
-
2026-06-03days on market $289,999 Active 146 DOM
-
2026-06-02days on market $289,999 Active 145 DOM
-
2026-06-01days on market $289,999 Active 144 DOM
-
2026-05-31days on market $289,999 Active 143 DOM
-
2026-05-30days on market $289,999 Active 142 DOM
-
2026-04-17price $289,999
-
2026-03-11price $299,900
-
2026-01-09$315,000 Active
-
2026-01-05historical $315,000
-
2014-08-25historical
-
2014-08-22historical
-
2014-08-21$119,000
-
2014-02-22$119,000
-
2013-08-12soldstatus $86,000
-
2013-08-07soldstatus $86,000 Sold
-
2013-08-07soldstatus $86,000
-
2013-07-22status Under Contract
-
2013-07-21historical
-
2013-07-02price $89,900 Active
-
2013-07-02status Active
-
2013-06-01historical
-
2013-02-10$95,000 Active
-
2013-02-10$89,900
-
1998-10-22soldstatus $60,000
ⓘ Source: listings_history table (triggers on properties + properties_extension) + one-shot
backfill from property_details.listing_events for pre-trigger history.
Tax reassessment forecast NJ · Partial reset (capped growth)
- Current annual tax
- $3,534 · $294/mo
- Projected year-2 tax
- $5,377 · $448/mo
- Expected delta
- +$1,843/yr (+$154/mo · 52.2%)
ⓘ Screening estimate from a state-policy table — verify with the county assessor before closing.
Climate risk First Street
- Flood 1/10 Low FEMA zone X (unshaded) · 0% chance over 30 yrs
- Wildfire 1/10 Low
- Heat 6/10 Major 7 d/yr ≥101°F today · 15 d/yr by 30 yrs out
- Wind 6/10 Major 27% chance of damaging wind over 30 yrs
- Air quality 5/10 Major 6 unhealthy d/yr today · 8 by 30 yrs out
Nearby sold comps map
Loading sold comps map…
Walkable amenities ~0.75 mi
Loading nearby amenities…
Taxation est. · year 1
- Rental income
- $32,066
- − Mortgage interest
- −$16,244
- − Property taxes
- −$3,534
- − Insurance
- −$1,450
- − Repairs & maintenance
- −$2,565
- − Management
- −$2,565
- − Depreciation
- −$8,436
- Taxable loss
- −$2,730
- Est. tax savings @ 24.0%
- +$655
- After-tax cash flow
- $2,753/yr
For passive investors: Depreciation is non-cash, so a rental often shows a tax loss while cash-flowing — sheltering income. Rental losses are passive: they offset passive income freely, and up to $25,000/yr can offset ordinary (W-2) income if you actively participate and your MAGI is under $100k (phasing out to $0 by $150k); unused losses carry forward. On sale, claimed depreciation is recaptured at up to 25%, and gains may owe capital-gains tax (a 1031 exchange can defer both). Figures are a year-1 estimate at your 24.0% rate — not tax advice; consult a CPA.
Schools (NCES district)
- District
- Trenton Public School District
- NCES district ID
- 3416290
- Math proficiency
- 2% ▼ -8.00%
- Reading proficiency
- 16% ▼ -4.00%
- Median HH income
- $35,078
- Composite
- 7.31/100
- National rank
- #9956
- State rank
- #471 of 472 in NJ
Livability — Trenton
- Score
- 76/100
- State rank
- #133
- US rank
- #3533
Category grades
Schools grade is shown separately in the Schools card above.
Census & demographics
- Census place
- Trenton, NJ
- County
- Mercer County · 327,655 people
- City population
- 177,819
- Metro
- Trenton-Princeton, NJ
- Population (ZIP)
- 22,816
- Household income
- $66,875
- Rent vs Own
- Severe rent burden
- 1185.0
Population outlook (Mercer County) Hauer SSP2
- Today (2025)
- 381,395 people
- By 2030
- 384,640 · +0.9%
- By 2040
- 391,431 · +2.6%
- By 2050
- 397,845 · +4.3%
- By 2075
- 417,281 · +9.4%
- By 2100
- 420,327 · +10.2%
Race, ethnicity, and origin ACS 2023
- Neighborhood character
- Diverse neighborhood (Simpson 0.68)
- Race & ethnicity
- Black 43% White 31% Hispanic / Latino 21% Two or more races 8% Asian 2%
- Hispanic origin (detail)
- Mexican 2% Puerto Rican 6% Dominican 3%
- Common ancestry
- Romanian 4% Hispanic 2% Iranian 1%
- Foreign-born
- 24% · Canada, Guatemala, China
- Languages at home
- 76% English-only · Spanish 17% Russian/Polish/Slavic 2% Other Indo-European 2%
Political lean MEDSL · Mercer
- 2024 margin
- Solid D (+33.9) · D 65.9% · R 32.0% · Other 2.1%
- 2008→2024 swing
- -2.2pp toward R · 2008: 36.1pp · 2024: 33.9pp
- All cycles
- 2024: D+33.9 2020: D+40.0 2016: D+36.2 2012: D+36.8 2008: D+36.1
Not yet ingested
- Civics
- —
Market trends
- HPI YoY
- ▼ -286.00%
- Current HPI
- 334.5143
- Rent YoY
- ▲ 3.31%
- Metro
- Trenton-Princeton, NJ
- State GDP YoY
- ▲ 2.05%
- F500 in state
- 34
Industry mix (Fortune 500 HQ in NJ)
| Industry | F500 HQs | Revenue |
|---|---|---|
| Consumer Goods | 3 | $31B |
|
||
| Pharmaceuticals | 2 | $153B |
|
||
| Technology | 2 | $21B |
|
||
| Insurance | 2 | $20B |
|
||
| Healthcare | 2 | $19B |
|
||
| Financial Services | 1 | $70B |
|
||
Price history
+383.3% since first listed19 events — show timeline
- 2026-04-17 Price Changed $289,999 BRIGHT MLS
- 2026-03-11 Price Changed $299,900 BRIGHT MLS
- 2026-01-09 Listed $315,000 BRIGHT MLS
- 2026-01-05 Coming Soon $315,000 BRIGHT MLS
- 2014-08-25 Listing Removed — BRIGHT MLS
- 2014-08-22 Listing Removed — BRIGHT MLS
- 2014-08-21 Listed $119,000 BRIGHT MLS
- 2014-02-22 Listed $119,000 BRIGHT MLS
- 2013-08-12 Sold (Public Records) $86,000 Public Records
- 2013-08-07 Sold (MLS) $86,000 BRIGHT MLS
- 2013-08-07 Sold (MLS) $86,000 TREND
- 2013-07-22 Pending — TREND
- 2013-07-21 Listing Removed — BRIGHT MLS
- 2013-07-02 Relisted — TREND
- 2013-07-02 Price Changed $89,900 TREND
- 2013-06-01 Delisted — TREND
- 2013-02-10 Listed $89,900 BRIGHT MLS
- 2013-02-10 Listed $95,000 TREND
- 1998-10-22 Sold (Public Records) $60,000 Public Records
Property tax history
-0.7%/yrLatest (2025): $3,534 · +1.5% YoY. Source: county tax records.
Cash-flow waterfall
monthlySold comps — $/sqft
last 12 mo · ≤1 miLoading sold comps…