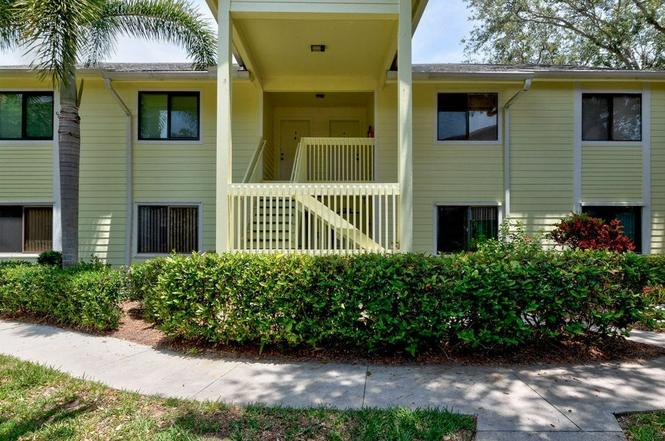
5790 Marina Dr · Wabasso, FL
Flood risk 10/10 · Severe
- FEMA flood zone
- X (shaded)
- Chance of flooding over 30 yrs
- 0.99%
- Est. flood insurance / yr
- $507 – $1,088
Fire risk 2/10 · Minimal
- Est. fire insurance / yr
- $947 – $1,759
Heat risk 10/10 · Severe
- Hot days now (above 106°F)
- 7 days/yr
- Hot days in 30 yrs
- 24 days/yr
Wind risk 10/10 · Severe
- Chance of severe wind over 30 yrs
- 99.0%
Air-quality risk 1/10 · Minimal
- Unhealthy air days now
- 0 days/yr
- Unhealthy air days in 30 yrs
- 0 days/yr
Risk factors via First Street. Map © Google.
Why this score? — see what drove the D- grade
The composite is a weighted blend of 9 inputs, each scored 0–100. Each bar is that input's sub-score; the figure is the points it added to the 100-point composite (weight × sub-score).
- ARV discount +7.5/15.0
- Cash flow +7.2/30.0
- 1% rule +5.8/10.0
- Schools +4.2/10.0
- Rent growth +4.1/5.0
- Livability +3.3/5.0
- Condition / age +2.5/5.0
- DSCR +1.4/10.0
- Appreciation +0.0/10.0
$200,000
🖨 Deal sheet 📄 Offer letter ✓ Due diligence
Listing remarks
* Location * Location * Location * Calling savvy investors - This first-floor 2BR/2BA in Gated Non-age restricted community is a steal. Lanai overlooks a private golf and water view, & the bird show on a rainy day is nothing short of spectacular. When you're at the clubhouse and forget something, it's a short walk back to the house. We also don't overlook any garbage or parking. Simply pull the car to the side, unload practically at the front door and then drive to the other side of the building where they deal with those issues. Nothing beats the amenities that you'll find at Pelican Pointe. The grounds are situated on a golf course, and are absolutely stunning. The area offers so m
Key facts
- Gated community
- Private golf view
- Clubhouse
Tags
Neighborhood map
What this means for you Summary
Snapshot
- This is a 2-bed/2.0-bath condo listed at $200k.
Deal economics
- At list price, monthly cash flow is $-343 ($-4k/yr) — negative.
- The deal already cash-flows at list — no discount required.
- Meets the 1% rule at list price ($2k rent vs $200k).
- Recommended offer: $176k (12.0% below list) — sets the bar for market timing.
- Cap rate 4.6% vs local median 3.4% in Wabasso — top-decile yield for the area; either an underpriced asset or a hidden risk that comps aren't pricing in. Stress-test before assuming the spread holds.
Location & tenants
- Location reads 66/100 on livability (#626 in FL) — a middle-class / working-renter tenant base. Strengths: commute A+, crime A, cost of living A-; Watch: employment D, schools F, amenities F.
- Indian River (other): math 48% / reading 52% proficiency, ranked #35 of 73 in FL (top 48%) — acceptable for families but not a draw, mixed tenant base, ~2y average lease.
- Market conditions: Rents rising fast (+6.2%/yr); 412 active listings in the ZIP; 4 comparable units currently listed for rent nearby; rentals at typical pace (median 21d on market — plan ~3-4 weeks tenant-placement turnaround); 564 units permitted in Indian River County in 2024 (281 in 5+ unit buildings).
- This rent runs 39% of the median local income ($67k/yr) — at the standard rent-burdened threshold; future hikes will face affordability resistance.
Forward outlook
- Local home prices are declining (-3.0%/yr); year-one equity from $1k of loan paydown is wiped out by about $6k of value loss. Plan a longer hold.
- Indian River County population projected at +18% by 2050 — long-run rental-demand tailwind backs the buy-and-hold thesis.
Negotiation context
- It's been on market 168 days — a 12% lower offer ($176k) is reasonable based on typical stale-listing flexibility.
- 2 sale attempts; this cycle's ask is 8991% above the opening price — seller raised mid-cycle; expect resistance to lowballs.
Risks & watch-outs
- Watch-outs: flood insurance adds $66/mo; HOA is 28% of rent.
- Climate carrying-cost: severe flood risk; severe wind risk, 99% chance of damaging wind over 30y; extreme-heat days projected 7→24/yr by 2055 (HVAC capex compounding) — expect insurance premiums to compound above CPI over the hold.
Questions for the listing agent
- What do current leases actually rent for vs. the listed asking? Can we see a recent rent roll and the last 12 months of T-12 income?
- It's been on market 168 days. Have you received any prior offers? Is the seller open to a 12% concession, seller financing, or rate buy-down credit?
- What's the actual annual flood-insurance premium (NFIP or private), and is the property in a SFHA with mandatory coverage?
- What does the HOA fee cover, when was the last increase, and are there any pending special assessments or reserve-fund shortfalls?
- Any open or pending special assessments — roof, HVAC, plumbing, elevator, façade? What's the per-unit balance and payoff schedule, and is the seller paying it off at close or rolling it to the buyer?
- Why hasn't it sold? Are there any deal-killer items the seller is aware of (foundation, flood, title, zoning, code violations)?
- Is there a deadline driving the sale (1031 exchange, divorce, estate, relocation)? That informs how much negotiation room exists.
- Schools are F-rated, which usually means shorter tenancies and higher turnover. Who's the typical renter profile here, and what's been the actual vacancy rate?
- The area grade is low — what's the realistic commute time and amenity access for the typical tenant pool here? Any planned neighborhood developments (good or bad) we should know about?
- What's the average days-on-market for RENTAL listings here right now (not sales)? A rising rental-DOM trend means longer vacancies and softer asking-rent achievability than the comps imply.
- What's the recent tenant-quality profile in this submarket — average credit score on applications, eviction rate, late-payment / NSF rate, and stable-employment percentage? A property-management company in the area should have these aggregated.
- How much new apartment / multifamily construction is in the pipeline within 1–3 miles? Heavy new supply (>2% of stock underway) typically softens rents 12–24 months out; light construction supports rent growth.
Investment metrics
- 1% rule
- 1.08% ✓
- Cap rate
- 4.63%
- Cash-on-cash
- -5.93%
- DSCR
- 0.74
- GRM
- 7.7
CMA / ARV
No comps found within radius.
Projected returns pro-forma
-3.0% appreciation · 6.22% rent growth · sell at horizon
- IRR
- -23.2%
- Equity multiple
- 0.17×
- Total profit
- $-46,573
- Equity at exit
- $29,821
- IRR
- -8.3%
- Equity multiple
- 0.37×
- Total profit
- $-35,093
- Equity at exit
- $17,292
Cash invested: $56,000 (down + closing). Projections, not guarantees.
Landlord ↔ Tenant lean methodology
- Overall (STATE)
- 87 Strongly Landlord-Friendly
- State Florida
- 87 Strongly Landlord-Friendly · R+3
- County
- — inherits STATE
- City
- — inherits STATE
ZIP-level market 32958
- Home prices YoY
- -13.1%
- Rents YoY
- 6.2%
- Active inventory
- 412
- Price-to-rent
- 7.7×
Monthly cashflow live
- Estimated rent
- $2,169 medium interval (Pro) →
- Mortgage (P&I)
- −$1,049
- Tax est. 1.5%
- −$250 /mo · $3,000/yr
- Insurance
- −$83
- Flood insurance flood zone
- −$66 /mo · $798/yr
- HOA est. from 12 same-building comps
- −$608
- Vacancy / Maint / Mgmt
- −$455
- Net cashflow
- $-343
Break-even live
UW: 25.0% down · 7.5% · 30yr · 1.5% tax · 5.0% vac · 8.0% maint · 8.0% mgmt
Financing live
Cash to close
- Down payment
- $50,000
- Closing costs
- $6,000
- Reserves months
- —
- Total cash needed
- —
Loan-product check · same deal, 3 products live
Conventional
25% down · 7.5% · 30yr
- Down + closing
- —
- Monthly P&I
- —
- Monthly cashflow
- —
- DSCR
- —
- Eligible?
- —
Personal DTI + credit; lowest rate.
DSCR
20% down · 8.5% · 30yr
- Down + closing
- —
- Monthly P&I
- —
- Monthly cashflow
- —
- DSCR
- —
- Eligible?
- —
No personal income docs; deal must DSCR.
Hard money
10% down · 12.0% · 12mo
- Down + closing
- —
- Monthly P&I
- —
- Monthly cashflow
- —
- DSCR
- —
- Eligible?
- —
Short-term bridge; refi at stabilization.
Rent comps 4 comps
| Address | Beds | Baths | Sqft | Rent | $/sqft | DOM | Units | Dist |
|---|---|---|---|---|---|---|---|---|
| 5790 Marina Dr #2 Sebastian, FL | 2.0 | 2.0 | 1060 | $2,200 | $2.08 | 21d | 1 | 0.02mi |
| 5790 Marina Dr #2 Sebastian, FL | 2.0 | 2.0 | 1060 | $2,200 | $2.08 | 13d | 1 | 0.09mi |
| 141 Crawford Dr Sebastian, FL | 2.0 | 1.0 | 1100 | $2,200 | $2.00 | 13d | 1 | 1.22mi |
| 151 Mabry St Sebastian, FL | 3.0 | 2.0 | 1199 | $1,850 | $1.54 | 21d | 1 | 1.32mi |
HOA detail condo
- Monthly dues
- $0 · $0/yr
- Likely covers
- watertrashlandscapingsecurity
- Assessments
- None detected in remarks — confirm with the listing agent.
Listing history 18 events
-
2026-06-19days on market $200,000 Active 168 DOM
-
2026-06-18days on market $200,000 Active 167 DOM
-
2026-06-17days on market $200,000 Active 166 DOM
-
2026-06-16days on market $200,000 Active 165 DOM
-
2026-06-15days on market $200,000 Active 164 DOM
-
2026-06-14days on market $200,000 Active 162 DOM
-
2026-06-13days on market $200,000 Active 161 DOM
-
2026-06-10days on market $200,000 Active 159 DOM
-
2026-06-09days on market $200,000 Active 158 DOM
-
2026-06-08days on market $200,000 Active 157 DOM
-
2026-06-07days on market $200,000 Active 156 DOM
-
2026-06-05days on market $200,000 Active 153 DOM
-
2026-06-02days on market $200,000 Active 151 DOM
-
2026-06-01days on market $200,000 Active 150 DOM
-
2026-05-31days on market $200,000 Active 149 DOM
-
2026-05-30days on market $200,000 Active 148 DOM
-
2026-03-03$2,200
-
2026-01-02$200,000 Active
ⓘ Source: listings_history table (triggers on properties + properties_extension) + one-shot
backfill from property_details.listing_events for pre-trigger history.
Climate risk First Street
- Flood 10/10 Extreme FEMA zone X (shaded) · 99% chance over 30 yrs
- Wildfire 2/10 Low
- Heat 10/10 Extreme 7 d/yr ≥106°F today · 24 d/yr by 30 yrs out
- Wind 10/10 Extreme 99% chance of damaging wind over 30 yrs
- Air quality 1/10 Low 0 unhealthy d/yr today · 0 by 30 yrs out
Nearby sold comps map
Loading sold comps map…
Walkable amenities ~0.75 mi
Loading nearby amenities…
Taxation est. · year 1
- Rental income
- $26,025
- − Mortgage interest
- −$11,203
- − Property taxes
- −$3,000
- − Insurance
- −$1,798
- − Repairs & maintenance
- −$2,082
- − Management
- −$2,082
- − HOA
- −$7,296
- − Depreciation
- −$5,818
- Taxable loss
- −$7,254
- Est. tax savings @ 24.0%
- +$1,741
- After-tax cash flow
- $-2,379/yr
For passive investors: Depreciation is non-cash, so a rental often shows a tax loss while cash-flowing — sheltering income. Rental losses are passive: they offset passive income freely, and up to $25,000/yr can offset ordinary (W-2) income if you actively participate and your MAGI is under $100k (phasing out to $0 by $150k); unused losses carry forward. On sale, claimed depreciation is recaptured at up to 25%, and gains may owe capital-gains tax (a 1031 exchange can defer both). Figures are a year-1 estimate at your 24.0% rate — not tax advice; consult a CPA.
Schools (NCES district)
- District
- Indian River
- NCES district ID
- 1200930
- Math proficiency
- 48% ▼ -9.00%
- Reading proficiency
- 52% ▼ -3.00%
- Median HH income
- $46,597
- Composite
- 42.45/100
- National rank
- #3218
- State rank
- #35 of 73 in FL
Livability — Wabasso
- Score
- 66/100
- State rank
- #626
- US rank
- #12197
Category grades
Schools grade is shown separately in the Schools card above.
Census & demographics
- County
- Indian River County · 143,738 people
- City population
- 287
- Metro
- Sebastian-Vero Beach, FL
- Population (ZIP)
- 30,023
- Household income
- $66,840
- Rent vs Own
- Severe rent burden
- 646.0
Population outlook (Indian River County) Hauer SSP2
- Today (2025)
- 165,104 people
- By 2030
- 172,869 · +4.7%
- By 2040
- 185,640 · +12.4%
- By 2050
- 194,465 · +17.8%
- By 2075
- 211,115 · +27.9%
- By 2100
- 211,781 · +28.3%
Race, ethnicity, and origin ACS 2023
- Neighborhood character
- Predominantly White (86%)
- Race & ethnicity
- White 86% Hispanic / Latino 9% Two or more races 7% Black 2% Asian 1%
- Hispanic origin (detail)
- Mexican 1% Puerto Rican 2% Cuban 3%
- Common ancestry
- Lithuanian 4% Slovak 4% Romanian 3%
- Foreign-born
- 7% · Canada, Jamaica
- Languages at home
- 91% English-only · Spanish 6% Other Indo-European 1% Russian/Polish/Slavic 1%
Political lean MEDSL · Indian River
- 2024 margin
- Strong R (+27.4) · D 36.0% · R 63.4%
- 2008→2024 swing
- -12.5pp toward R · 2008: -14.8pp · 2024: -27.4pp
- All cycles
- 2024: R+27.4 2020: R+21.6 2016: R+24.5 2012: R+22.3 2008: R+14.8
Not yet ingested
- Civics
- —
Market trends
- HPI YoY
- ▼ -49.85%
- Current HPI
- 330.1691
- Rent YoY
- ▲ 6.22%
- Metro
- Sebastian-Vero Beach, FL
- State GDP YoY
- ▲ 3.28%
- F500 in state
- 36
Industry mix (Fortune 500 HQ in FL)
| Industry | F500 HQs | Revenue |
|---|---|---|
| Industrial Technology | 2 | $29B |
|
||
| Insurance | 2 | $17B |
|
||
| Retail | 1 | $60B |
|
||
| Technology Distribution | 1 | $58B |
|
||
| Homebuilding | 1 | $35B |
|
||
| Technology Manufacturing | 1 | $35B |
|
||
Price history
-98.9% since first listed2 events — show timeline
- 2026-03-03 Listed for Rent $2,200 APPFOLIO
- 2026-01-02 Listed $200,000 ForSaleByOwner.com
Cash-flow waterfall
monthlySold comps — $/sqft
last 12 mo · ≤1 miLoading sold comps…