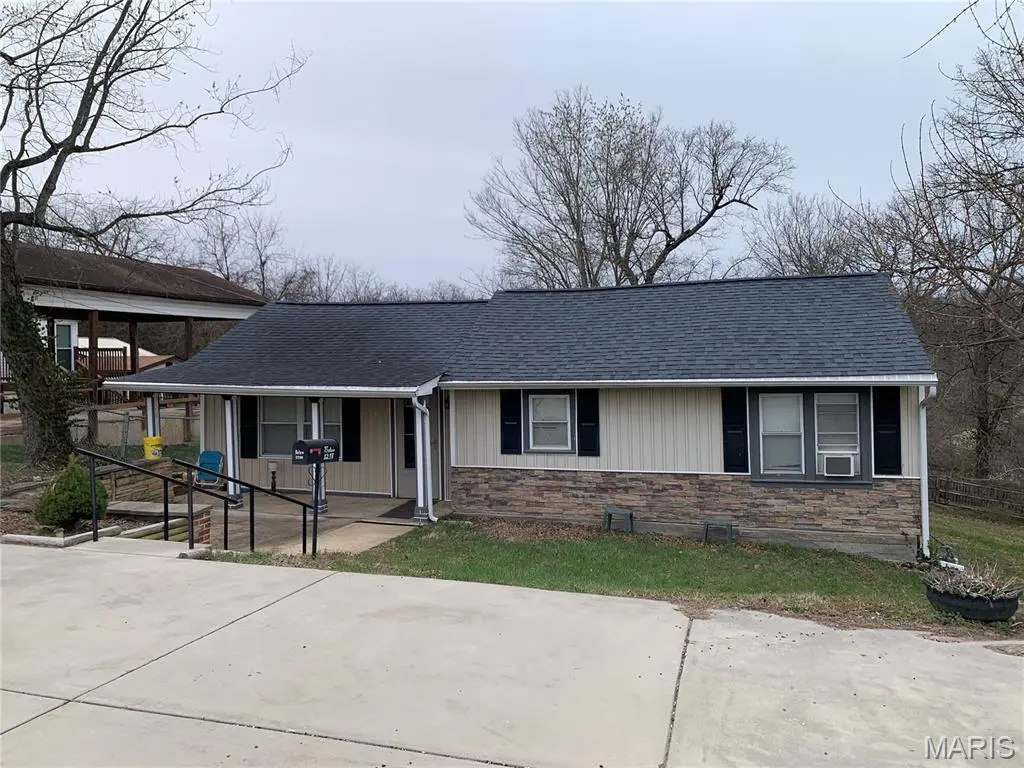
1218 S 5th St · De Soto, MO
Flood risk 1/10 · Minimal
- FEMA flood zone
- X (unshaded)
- Chance of flooding over 30 yrs
- 0.0%
- Est. flood insurance / yr
- $507 – $1,088
Fire risk 4/10 · Minor
- Est. fire insurance / yr
- $1,054 – $1,958
Heat risk 5/10 · Moderate
- Hot days now (above 106°F)
- 7 days/yr
- Hot days in 30 yrs
- 21 days/yr
Wind risk 2/10 · Minimal
- Chance of severe wind over 30 yrs
- 1.0%
Air-quality risk 2/10 · Minimal
- Unhealthy air days now
- 1 days/yr
- Unhealthy air days in 30 yrs
- 1 days/yr
Risk factors via First Street. Map © Google.
Why this score? — see what drove the B- grade
The composite is a weighted blend of 9 inputs, each scored 0–100. Each bar is that input's sub-score; the figure is the points it added to the 100-point composite (weight × sub-score).
- Cash flow +30.0/30.0
- DSCR +10.0/10.0
- 1% rule +9.0/10.0
- ARV discount +7.5/15.0
- Schools +3.4/10.0
- Livability +3.0/5.0
- Rent growth +2.5/5.0
- Condition / age +2.5/5.0
- Appreciation +0.0/10.0
$74,900
🖨 Deal sheet 📄 Offer letter ✓ Due diligence
Listing remarks
Opportunity knocks at 1218 S 5th Street in Desoto! This 2-bedroom, 1-bath home offers 996 square feet of space and is ready for your vision. Whether your're looking to renovate, update, or reimagine, this property presents a chance to create something truly special. Set in a mature neighborhood, the home sits among established surroundings that provide a sense of character and stability.
Key facts
- 7,061 sq ft lot
- Built 1940
- Listed 77 days
Property features AI
Finance
- Other: Approximately 0.1621 acre lot; Living area reported as 996 (assessor source)
- Financial info: Lease not considered; Seller may consider concessions
Exterior
- Parking: Off-street parking
- Utilities: Public water; Public sewer; Electricity available (single phase)
- Home design: Single-family house; One story; Private ownership; Fixer condition; Entry facing front (front porch)
- Construction: Frame with stone veneer exterior; Shingle roof; Block foundation; Built as a house
- Exterior features: Asphalt city street frontage; Lot with other features
Interior
- Bedrooms: 2 bedrooms (both on the main level)
- Flooring: Carpet; Vinyl
- Bathrooms: 1 full bathroom
- Heating & cooling: Baseboard heating; Window/wall air conditioning units
- Interior features: Crawl space basement; Front porch; Storm door(s)
- Laundry & utility: Main-level laundry room
Neighborhood map
What this means for you Summary
Snapshot
- This is a 2-bed/1.0-bath other listed at $75k.
Deal economics
- At list price, monthly cash flow is $356 ($4k/yr) — positive.
- The deal already cash-flows at list — no discount required.
- Meets the 1% rule at list price ($1k rent vs $75k).
- Recommended offer: $70k (6.0% below list) — sets the bar for market timing.
- Cap rate 12.0% vs local median 3.6% in De Soto — top-decile yield for the area; either an underpriced asset or a hidden risk that comps aren't pricing in. Stress-test before assuming the spread holds.
Location & tenants
- Location reads 59/100 on livability (#523 in MO) — a working-class tenant base; expect higher turnover. Strengths: cost of living A+, housing A+; Watch: crime F, amenities F, commute F.
- Desoto 73 (town): math 36% / reading 43% proficiency, ranked #153 of 324 in MO (top 47%) — families likely to look elsewhere, expect single-tenant / working-renter base with shorter leases.
- Zoned schools: Vineland Elem. (math 40% / reading 44%, grade F, #481 of 1,115 statewide, top 46%, 648 students, 49% FRL); Desoto Sr. High (math 37% / reading 53%, grade D-, #176 of 521 statewide, top 34%, 848 students, 34% FRL) — zoned schools at 42% FRL track the district average.
- Market conditions: 150 active listings in the ZIP; 807 units permitted in Jefferson County in 2024 (104 in 5+ unit buildings).
Forward outlook
- Local home prices are declining (-3.0%/yr); year-one equity from $518 of loan paydown is wiped out by about $2k of value loss. Plan a longer hold.
- At projected returns (-3.0% appreciation + 3.0% rent growth), your $21k cash investment doubles in ~6 years — after that, you're playing with house money.
Negotiation context
- It's been on market 77 days — a 6% lower offer ($70k) is reasonable based on typical stale-listing flexibility.
- Current owner paid $22k; list at $75k implies a 237% gain — meaningful room to come down on a strong offer.
Risks & watch-outs
- Watch-outs: built in 1940 — expect roof / HVAC / electrical / plumbing capex.
- Climate carrying-cost: extreme-heat days projected 7→21/yr by 2055 (HVAC capex compounding) — expect insurance premiums to compound above CPI over the hold.
Questions for the listing agent
- It's been on market 77 days. Have you received any prior offers? Is the seller open to a 6% concession, seller financing, or rate buy-down credit?
- Built in 1940 — when were the roof, HVAC, electrical panel, plumbing, and water heater last replaced?
- Why hasn't it sold? Are there any deal-killer items the seller is aware of (foundation, flood, title, zoning, code violations)?
- Is there a deadline driving the sale (1031 exchange, divorce, estate, relocation)? That informs how much negotiation room exists.
- Schools are D-rated, which usually means shorter tenancies and higher turnover. Who's the typical renter profile here, and what's been the actual vacancy rate?
- Crime grade is F in this area — have there been break-ins, vandalism, or insurance claims at this property in the last 3 years? What carrier currently insures it and at what premium?
- What's the average days-on-market for RENTAL listings here right now (not sales)? A rising rental-DOM trend means longer vacancies and softer asking-rent achievability than the comps imply.
- What's the recent tenant-quality profile in this submarket — average credit score on applications, eviction rate, late-payment / NSF rate, and stable-employment percentage? A property-management company in the area should have these aggregated.
- How much new for-sale + rental construction is in the pipeline within 1–3 miles? Heavy new supply typically softens prices + rents 12–24 months out; constrained supply supports both.
Investment metrics
- 1% rule
- 1.40% ✓
- Cap rate
- 12.00%
- Cash-on-cash
- 20.38%
- DSCR
- 1.91
- GRM
- 6.0
CMA / ARV
No comps found within radius.
Projected returns pro-forma
-3.0% appreciation · 3.0% rent growth · sell at horizon
- IRR
- 12.6%
- Equity multiple
- 1.50×
- Total profit
- $10,534
- Equity at exit
- $11,168
- IRR
- 21.5%
- Equity multiple
- 2.83×
- Total profit
- $38,332
- Equity at exit
- $6,476
Cash invested: $20,972 (down + closing). Projections, not guarantees.
Landlord ↔ Tenant lean methodology
- Overall (STATE)
- 81 Strongly Landlord-Friendly
- State Missouri
- 81 Strongly Landlord-Friendly · R+10
- County
- — inherits STATE
- City
- — inherits STATE
ZIP-level market 63020
- Home prices YoY
- -21.9%
- Active inventory
- 150
- Price-to-rent
- 6.0×
Monthly cashflow live
- Estimated rent
- $1,048 medium interval (Pro) →
- Mortgage (P&I)
- −$393
- Tax from tax record
- −$48 /mo · $574/yr
- Insurance
- −$31
- HOA
- −$0
- Vacancy / Maint / Mgmt
- −$220
- Net cashflow
- $356
Break-even live
UW: 25.0% down · 7.5% · 30yr · 1.5% tax · 5.0% vac · 8.0% maint · 8.0% mgmt
Financing live
Cash to close
- Down payment
- $18,725
- Closing costs
- $2,247
- Reserves months
- —
- Total cash needed
- —
Loan-product check · same deal, 3 products live
Conventional
25% down · 7.5% · 30yr
- Down + closing
- —
- Monthly P&I
- —
- Monthly cashflow
- —
- DSCR
- —
- Eligible?
- —
Personal DTI + credit; lowest rate.
DSCR
20% down · 8.5% · 30yr
- Down + closing
- —
- Monthly P&I
- —
- Monthly cashflow
- —
- DSCR
- —
- Eligible?
- —
No personal income docs; deal must DSCR.
Hard money
10% down · 12.0% · 12mo
- Down + closing
- —
- Monthly P&I
- —
- Monthly cashflow
- —
- DSCR
- —
- Eligible?
- —
Short-term bridge; refi at stabilization.
Listing history 14 events
-
2026-06-18days on market $74,900 Active 77 DOM
-
2026-06-17status $74,900 Active 76 DOM
-
2026-06-12statusdays on market $74,900 Pending 76 DOM
-
2026-06-09days on market $74,900 Active 74 DOM
-
2026-06-08days on market $74,900 Active 73 DOM
-
2026-06-07days on market $74,900 Active 72 DOM
-
2026-06-07pricedays on market $74,900 Active 71 DOM
-
2026-06-04days on market $79,900 Active 68 DOM
-
2026-06-02days on market $79,900 Active 67 DOM
-
2026-06-01days on market $79,900 Active 66 DOM
-
2026-05-31days on market $79,900 Active 65 DOM
-
2026-05-01price $79,900
-
2026-03-27$95,000 Active
-
1999-11-24soldstatus $22,200
ⓘ Source: listings_history table (triggers on properties + properties_extension) + one-shot
backfill from property_details.listing_events for pre-trigger history.
Tax reassessment forecast MO · Resets to sale price
- Current annual tax
- $574 · $48/mo
- Projected year-2 tax
- $727 · $61/mo
- Expected delta
- +$152/yr (+$13/mo · 26.5%)
ⓘ Screening estimate from a state-policy table — verify with the county assessor before closing.
Climate risk First Street
- Flood 1/10 Low FEMA zone X (unshaded) · 0% chance over 30 yrs
- Wildfire 4/10 Moderate
- Heat 5/10 Major 7 d/yr ≥106°F today · 21 d/yr by 30 yrs out
- Wind 2/10 Low 100% chance of damaging wind over 30 yrs
- Air quality 2/10 Low 1 unhealthy d/yr today · 1 by 30 yrs out
Nearby sold comps map
Loading sold comps map…
Walkable amenities ~0.75 mi
Loading nearby amenities…
Taxation est. · year 1
- Rental income
- $12,577
- − Mortgage interest
- −$4,196
- − Property taxes
- −$574
- − Insurance
- −$374
- − Repairs & maintenance
- −$1,006
- − Management
- −$1,006
- − Depreciation
- −$2,179
- Taxable income
- $3,242
- Est. tax owed @ 24.0%
- −$778
- After-tax cash flow
- $3,496/yr
For passive investors: Depreciation is non-cash, so a rental often shows a tax loss while cash-flowing — sheltering income. Rental losses are passive: they offset passive income freely, and up to $25,000/yr can offset ordinary (W-2) income if you actively participate and your MAGI is under $100k (phasing out to $0 by $150k); unused losses carry forward. On sale, claimed depreciation is recaptured at up to 25%, and gains may owe capital-gains tax (a 1031 exchange can defer both). Figures are a year-1 estimate at your 24.0% rate — not tax advice; consult a CPA.
Schools (NCES district)
- District
- Desoto 73
- NCES district ID
- 2910500
- Math proficiency
- 36% ▼ -3.00%
- Reading proficiency
- 43% ▲ 3.00%
- Median HH income
- $44,354
- Composite
- 33.52/100
- National rank
- #5434
- State rank
- #153 of 324 in MO
Livability — De Soto
- Score
- 59/100
- State rank
- #523
- US rank
- #19709
Category grades
Schools grade is shown separately in the Schools card above.
Census & demographics
- Census place
- De Soto, MO
- Population (ZIP)
- 20,357
Population outlook (Jefferson County) Hauer SSP2
- Today (2025)
- 235,088 people
- By 2030
- 238,365 · +1.4%
- By 2040
- 240,156 · +2.2%
- By 2050
- 234,651 · -0.2%
- By 2075
- 214,569 · -8.7%
- By 2100
- 179,697 · -23.6%
Race, ethnicity, and origin ACS 2023
- Neighborhood character
- Predominantly White (88%)
- Race & ethnicity
- White 88% Two or more races 10% Hispanic / Latino 1%
- Common ancestry
- Lithuanian 5% Iranian 2% Italian 1%
- Foreign-born
- 1% · Canada
- Languages at home
- 98% English-only · Spanish 1%
Political lean MEDSL · Jefferson
- 2024 margin
- Solid R (+36.7) · D 31.0% · R 67.7% · Other 1.3%
- 2008→2024 swing
- -39.3pp toward R · 2008: 2.5pp · 2024: -36.7pp
- All cycles
- 2024: R+36.7 2020: R+33.9 2016: R+35.3 2012: R+12.7 2008: D+2.5
Not yet ingested
- Civics
- —
Market trends
- HPI YoY
- ▼ -60.90%
- Current HPI
- 217.2807
- Rent YoY
- —
- Metro
- —
- State GDP YoY
- ▲ 1.84%
- F500 in state
- 20
Industry mix (Fortune 500 HQ in MO)
| Industry | F500 HQs | Revenue |
|---|---|---|
| Healthcare | 1 | $163B |
|
||
| Insurance | 1 | $21B |
|
||
| Industrial Technology | 1 | $17B |
|
||
| Retail | 1 | $16B |
|
||
| Industrial Distribution | 1 | $10B |
|
||
| Utilities | 1 | $9B |
|
||
Price history
+259.9% since first listed3 events — show timeline
- 2026-05-01 Price Changed $79,900 MARIS as Distributed by MLS Grid
- 2026-03-27 Listed $95,000 MARIS as Distributed by MLS Grid
- 1999-11-24 Sold (Public Records) $22,200 Public Records
Property tax history
+3.9%/yrLatest (2025): $574 · +0.6% YoY. Source: county tax records.
Cash-flow waterfall
monthlySold comps — $/sqft
last 12 mo · ≤1 miLoading sold comps…