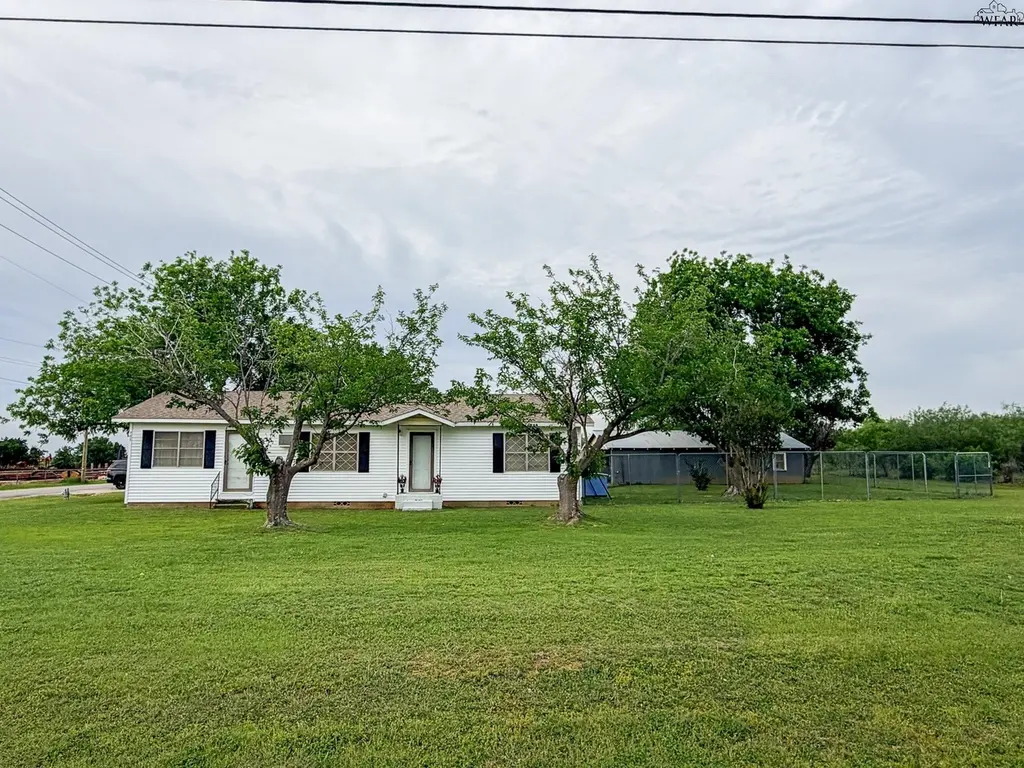
703 E Main St · Archer City, TX
Flood risk 1/10 · Minimal
- FEMA flood zone
- X (unshaded)
- Chance of flooding over 30 yrs
- 0.0%
- Est. flood insurance / yr
- $507 – $1,088
Fire risk 8/10 · Major
- Est. fire insurance / yr
- $1,222 – $2,270
Heat risk 7/10 · Major
- Hot days now (above 109°F)
- 7 days/yr
- Hot days in 30 yrs
- 20 days/yr
Wind risk 4/10 · Minor
- Chance of severe wind over 30 yrs
- 13.0%
Air-quality risk 1/10 · Minimal
- Unhealthy air days now
- 0 days/yr
- Unhealthy air days in 30 yrs
- 0 days/yr
Risk factors via First Street. Map © Google.
Why this score? — see what drove the B- grade
The composite is a weighted blend of 9 inputs, each scored 0–100. Each bar is that input's sub-score; the figure is the points it added to the 100-point composite (weight × sub-score).
- Cash flow +17.9/30.0
- ARV discount +15.0/15.0
- Appreciation +8.5/10.0
- DSCR +5.6/10.0
- Schools +5.0/10.0
- 1% rule +4.6/10.0
- Livability +3.7/5.0
- Rent growth +2.5/5.0
- Condition / age +2.5/5.0
$119,500
🖨 Deal sheet 📄 Offer letter ✓ Due diligence
Listing remarks
One acre just inside the city limits on the east side of Archer City! Offers a flexible floorplan featuring 3 bedrooms/2 baths or 2 bedrooms with 2 living areas. Eat-in kitchen plus detached garage with workshop space. Extra space creates opportunity for investors, first-time buyers, or possible residential/commercial use. Plenty of room for expansion, parking, equipment, or future improvements. Archer City National Blue Ribbon School, Royal Theater, Larry McMurtry Literary Center. Just 20min to WFalls.
Key facts
- Workshop space
- Flexible floorplan
- One acre
Tags
Neighborhood map
What this means for you Summary
Snapshot
- This is a 3-bed/2.0-bath single-family listed at $120k.
Deal economics
- At list price, monthly cash flow is $101 ($1k/yr) — positive.
- The deal already cash-flows at list — no discount required.
- To meet the 1% rule (rent ≥ 1% of price), the offer needs to be $114k (4.4% below list).
- Recommended offer: $114k (4.4% below list) — sets the bar for 1% rule.
Location & tenants
- Location reads 73/100 on livability (#220 in TX) — a middle-class / working-renter tenant base. Strengths: crime A+, cost of living A+, housing A+; Watch: health & safety C-, employment D+, amenities F.
- Archer City ISD (rural): math 56% / reading 63% proficiency, ranked #79 of 826 in TX (top 10%) — acceptable for families but not a draw, mixed tenant base, ~2y average lease.
- Market conditions: 8 active listings in the ZIP; 25 units permitted in Archer County in 2024 (0 in 5+ unit buildings).
Forward outlook
- In year one you build about $9k of equity ($826 loan paydown + $8k appreciation (7.1% local appreciation)).
- Archer County population projected at -22% by 2050 — secular population decline; favor cash flow + early exit over multi-decade hold.
- At projected returns (7.1% appreciation + 3.0% rent growth), your $33k cash investment doubles in ~3 years — after that, you're playing with house money.
- By year 4, paydown + projected appreciation supports a ~$32k cash-out refi (75% LTV) — recoverable capital for the next deal without selling this one.
Negotiation context
- It's been on market 21 days — a 2% lower offer ($118k) is reasonable based on typical stale-listing flexibility.
Risks & watch-outs
- Climate carrying-cost: severe wildfire risk; extreme-heat days projected 7→20/yr by 2055 (HVAC capex compounding) — expect insurance premiums to compound above CPI over the hold.
Questions for the listing agent
- Built in 1968 — when were the roof, HVAC, electrical panel, plumbing, and water heater last replaced?
- Is there a deadline driving the sale (1031 exchange, divorce, estate, relocation)? That informs how much negotiation room exists.
- Schools are B-rated — typically a magnet for longer-tenancy family renters. What's the average tenant stay here, and is there a school-zone premium baked into asking?
- What's the average days-on-market for RENTAL listings here right now (not sales)? A rising rental-DOM trend means longer vacancies and softer asking-rent achievability than the comps imply.
- What's the recent tenant-quality profile in this submarket — average credit score on applications, eviction rate, late-payment / NSF rate, and stable-employment percentage? A property-management company in the area should have these aggregated.
- How much new for-sale + rental construction is in the pipeline within 1–3 miles? Heavy new supply typically softens prices + rents 12–24 months out; constrained supply supports both.
Investment metrics
- 1% rule
- 0.96% ✗
- Cap rate
- 7.31%
- Cash-on-cash
- 3.62%
- DSCR
- 1.16
- GRM
- 8.7
CMA / ARV
- ARV (median comp)
- $171,585
- List price
- $119,500
- Delta
- -30.36%
- Verdict
- UNDERPRICED
- Comps
- 2 within 1.0 mi
Show comp detail 1 sale within ~0.75 mi
| Address | Dist | Beds/Ba | Sqft | Sold | Price | $/sf | Match |
|---|---|---|---|---|---|---|---|
| 301 S Rose St | 0.30mi | 3/2.0 | 1,200 (-4%) | 5mo | $195,900 | $163 | 75 |
Match score weights: distance 35% · size 25% · config 20% · recency 20%. Top-matched comps best support the ARV.
Projected returns pro-forma
7.06% appreciation · 3.0% rent growth · sell at horizon
- IRR
- 20.7%
- Equity multiple
- 2.45×
- Total profit
- $48,560
- Equity at exit
- $83,243
- IRR
- 19.4%
- Equity multiple
- 5.07×
- Total profit
- $136,306
- Equity at exit
- $158,518
Cash invested: $33,460 (down + closing). Projections, not guarantees.
Landlord ↔ Tenant lean methodology
- Overall (STATE)
- 87 Strongly Landlord-Friendly
- State Texas
- 87 Strongly Landlord-Friendly · R+5
- County
- — inherits STATE
- City
- — inherits STATE
ZIP-level market 76351
- Home prices YoY
- 7.0%
- Active inventory
- 8
- Price-to-rent
- 8.7×
Monthly cashflow live
- Estimated rent
- $1,142 medium interval (Pro) →
- Mortgage (P&I)
- −$627
- Tax from tax record
- −$125 /mo · $1,502/yr
- Insurance
- −$50
- HOA
- −$0
- Vacancy / Maint / Mgmt
- −$240
- Net cashflow
- $101
Break-even live
UW: 25.0% down · 7.5% · 30yr · 1.5% tax · 5.0% vac · 8.0% maint · 8.0% mgmt
Financing live
Cash to close
- Down payment
- $29,875
- Closing costs
- $3,585
- Reserves months
- —
- Total cash needed
- —
Loan-product check · same deal, 3 products live
Conventional
25% down · 7.5% · 30yr
- Down + closing
- —
- Monthly P&I
- —
- Monthly cashflow
- —
- DSCR
- —
- Eligible?
- —
Personal DTI + credit; lowest rate.
DSCR
20% down · 8.5% · 30yr
- Down + closing
- —
- Monthly P&I
- —
- Monthly cashflow
- —
- DSCR
- —
- Eligible?
- —
No personal income docs; deal must DSCR.
Hard money
10% down · 12.0% · 12mo
- Down + closing
- —
- Monthly P&I
- —
- Monthly cashflow
- —
- DSCR
- —
- Eligible?
- —
Short-term bridge; refi at stabilization.
Listing history 3 events
-
2026-05-06$119,500 Active 509-char remark
-
1999-02-20soldstatus
-
1996-12-04soldstatus
ⓘ Source: listings_history table (triggers on properties + properties_extension) + one-shot
backfill from property_details.listing_events for pre-trigger history.
Tax reassessment forecast TX · Resets to sale price
- Current annual tax
- $1,502 · $125/mo
- Projected year-2 tax
- $2,187 · $182/mo
- Expected delta
- +$685/yr (+$57/mo · 45.6%)
ⓘ Screening estimate from a state-policy table — verify with the county assessor before closing.
Climate risk First Street
- Flood 1/10 Low FEMA zone X (unshaded) · 0% chance over 30 yrs
- Wildfire 8/10 Severe
- Heat 7/10 Severe 7 d/yr ≥109°F today · 20 d/yr by 30 yrs out
- Wind 4/10 Moderate 13% chance of damaging wind over 30 yrs
- Air quality 1/10 Low 0 unhealthy d/yr today · 0 by 30 yrs out
Nearby sold comps map
Loading sold comps map…
Walkable amenities ~0.75 mi
Loading nearby amenities…
Taxation est. · year 1
- Rental income
- $13,708
- − Mortgage interest
- −$6,694
- − Property taxes
- −$1,502
- − Insurance
- −$598
- − Repairs & maintenance
- −$1,097
- − Management
- −$1,097
- − Depreciation
- −$3,476
- Taxable loss
- −$755
- Est. tax savings @ 24.0%
- +$181
- After-tax cash flow
- $1,391/yr
For passive investors: Depreciation is non-cash, so a rental often shows a tax loss while cash-flowing — sheltering income. Rental losses are passive: they offset passive income freely, and up to $25,000/yr can offset ordinary (W-2) income if you actively participate and your MAGI is under $100k (phasing out to $0 by $150k); unused losses carry forward. On sale, claimed depreciation is recaptured at up to 25%, and gains may owe capital-gains tax (a 1031 exchange can defer both). Figures are a year-1 estimate at your 24.0% rate — not tax advice; consult a CPA.
Schools (NCES district)
- District
- Archer City ISD
- NCES district ID
- 4808610
- Math proficiency
- 56% ▼ -10.00%
- Reading proficiency
- 63% ▼ -2.00%
- Median HH income
- $43,782
- Composite
- 50.04/100
- National rank
- #1917
- State rank
- #79 of 826 in TX
Livability — Archer City
- Score
- 73/100
- State rank
- #220
- US rank
- #5417
Category grades
Schools grade is shown separately in the Schools card above.
Census & demographics
- Census place
- Archer City, TX
- Population (ZIP)
- 1,481
Population outlook (Archer County) Hauer SSP2
- Today (2025)
- 8,158 people
- By 2030
- 7,855 · -3.7%
- By 2040
- 7,120 · -12.7%
- By 2050
- 6,320 · -22.5%
- By 2075
- 4,842 · -40.6%
- By 2100
- 3,527 · -56.8%
Race, ethnicity, and origin ACS 2023
- Neighborhood character
- Predominantly White (83%)
- Race & ethnicity
- White 83% Two or more races 10% Hispanic / Latino 6%
- Hispanic origin (detail)
- Mexican 6%
- Common ancestry
- Slovak 3%
- Foreign-born
- 6% · Canada
- Languages at home
- 94% English-only · Spanish 6%
Political lean MEDSL · Archer
- 2024 margin
- Solid R (+79.3) · D 10.1% · R 89.5%
- 2008→2024 swing
- -13.9pp toward R · 2008: -65.4pp · 2024: -79.3pp
- All cycles
- 2024: R+79.3 2020: R+80.4 2016: R+79.4 2012: R+73.8 2008: R+65.4
Not yet ingested
- Civics
- —
Market trends
- HPI YoY
- ▲ 7.06%
- Current HPI
- 107.3175
- Rent YoY
- —
- Metro
- —
- State GDP YoY
- ▲ 3.95%
- F500 in state
- 110
Industry mix (Fortune 500 HQ in TX)
| Industry | F500 HQs | Revenue |
|---|---|---|
| Energy | 16 | $1,198B |
|
||
| Technology | 5 | $198B |
|
||
| Engineering / Construction | 4 | $72B |
|
||
| Energy Services | 3 | $60B |
|
||
| Utilities | 3 | $41B |
|
||
| Healthcare | 2 | $330B |
|
||
Property tax history
+7.0%/yrLatest (2025): $1,502 · +4.1% YoY. Source: county tax records.
Cash-flow waterfall
monthlySold comps — $/sqft
last 12 mo · ≤1 miLoading sold comps…