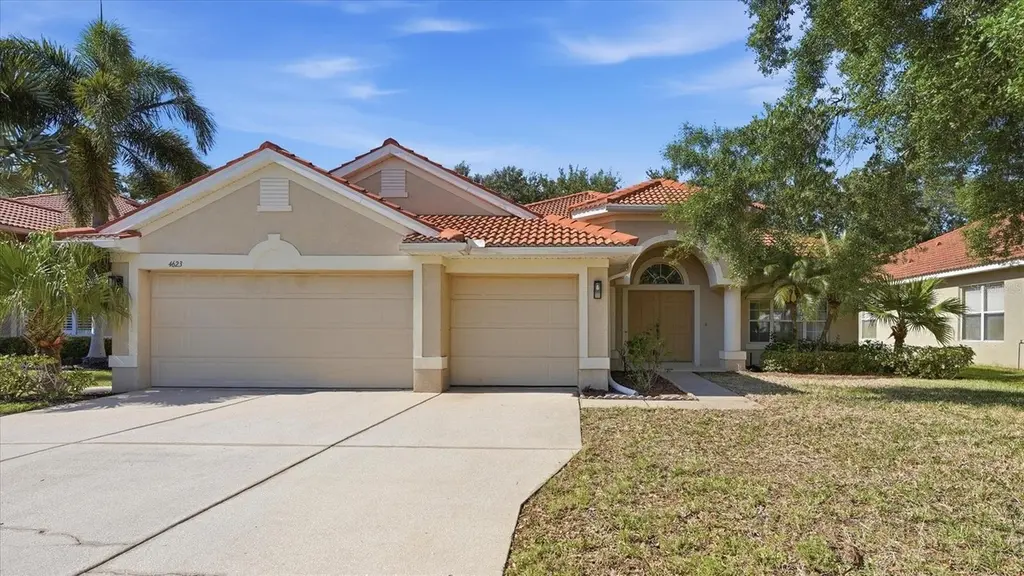
4623 61st Dr E · Samoset, FL
Flood risk 1/10 · Minimal
- FEMA flood zone
- X (unshaded)
- Chance of flooding over 30 yrs
- 0.0%
- Est. flood insurance / yr
- $507 – $1,088
Fire risk 1/10 · Minimal
- Est. fire insurance / yr
- $947 – $1,759
Heat risk 10/10 · Severe
- Hot days now (above 107°F)
- 7 days/yr
- Hot days in 30 yrs
- 29 days/yr
Wind risk 10/10 · Severe
- Chance of severe wind over 30 yrs
- 99.0%
Air-quality risk 2/10 · Minimal
- Unhealthy air days now
- 1 days/yr
- Unhealthy air days in 30 yrs
- 1 days/yr
Risk factors via First Street. Map © Google.
Why this score? — see what drove the D+ grade
The composite is a weighted blend of 9 inputs, each scored 0–100. Each bar is that input's sub-score; the figure is the points it added to the 100-point composite (weight × sub-score).
- ARV discount +15.0/15.0
- Cash flow +12.6/30.0
- Schools +4.4/10.0
- DSCR +3.8/10.0
- 1% rule +3.3/10.0
- Livability +3.2/5.0
- Condition / age +2.5/5.0
- Rent growth +2.3/5.0
- Appreciation +0.0/10.0
$419,900
🖨 Deal sheet 📄 Offer letter ✓ Due diligence
Listing remarks
This charming 4-bedroom, 3 full bath home is located in the highly sought-after gated community of Mandalay and offers 2,290 square feet of thoughtfully designed living space. Inside, the home features a spacious open floorplan with soaring high ceilings and transom windows that fill the living areas with natural light. Ceramic tile flooring flows throughout the main living spaces, complemented by formal living and family rooms that create the perfect setting for entertaining or everyday living. Decorative touches throughout the home add warmth and character, while the 3-car garage provides ample storage and convenience. Step outside to enjoy the private backyard, offering a relaxing retrea
Key facts
- Gated community
- Private backyard
- Open floorplan
Tags
Property features AI
Finance
- Other: Lease restrictions apply
- HOA & community: HOA managed by Sunstate Management; HOA fees required — $475 quarterly (about $158.33 per month); Pets allowed
Exterior
- Parking: Attached garage with 3 spaces
- Utilities: Public water; Public sewer; Public utilities
- Home design: Single-family residence; One-story home; South-facing
- Construction: Block and stucco construction; Tile roof; Slab foundation; Built using residential construction methods
- Exterior features: Paved road access; Lot approximately 0.23 acres (70 x 142)
Interior
- Kitchen: Dishwasher; Microwave; Range; Refrigerator
- Bedrooms: 4 bedrooms
- Flooring: Carpet; Ceramic tile
- Bathrooms: 3 full bathrooms
- Heating & cooling: Central heating; Central air conditioning
- Interior features: Ceiling fans; High ceilings; Kitchen and family room combined; Open floor plan; Walk-in closets
- Laundry & utility: Indoor laundry room
Neighborhood map
What this means for you Summary
Snapshot
- This is a 4-bed/3.0-bath single-family listed at $420k.
Deal economics
- At list price, monthly cash flow is $-51 ($-617/yr) — negative.
- To cash-flow at today's rent, offer at most $411k (2.2% below list).
- To meet the 1% rule (rent ≥ 1% of price), the offer needs to be $347k (17.2% below list).
- Recommended offer: $347k (17.2% below list) — sets the bar for 1% rule.
- Cap rate 6.1% vs local median 4.3% in Samoset — top-decile yield for the area; either an underpriced asset or a hidden risk that comps aren't pricing in. Stress-test before assuming the spread holds.
Location & tenants
- Location reads 65/100 on livability (#645 in FL) — a middle-class / working-renter tenant base. Strengths: cost of living A+, housing A+, health & safety A+; Watch: schools D+, amenities F, commute F.
- Manatee (suburban): math 54% / reading 50% proficiency, ranked #26 of 73 in FL (top 36%) — acceptable for families but not a draw, mixed tenant base, ~2y average lease.
- Market conditions: Rents soft (-1.0%/yr); 384 active listings in the ZIP; 16 comparable units currently listed for rent nearby; rentals at typical pace (median 16d on market — plan ~3-4 weeks tenant-placement turnaround); 7,472 units permitted in Manatee County in 2024 (1,782 in 5+ unit buildings).
- At $3,475/mo this rent would consume 59% of the median local household income ($71k/yr) (locally 1469% of renters already pay >50% of income on rent) — very limited rent-growth headroom before tenants either downsize or default.
Forward outlook
- Local home prices are declining (-3.0%/yr); year-one equity from $3k of loan paydown is wiped out by about $13k of value loss. Plan a longer hold.
- Manatee County population projected at +43% by 2050 — long-run rental-demand tailwind backs the buy-and-hold thesis.
Negotiation context
- It's been on market 22 days — a 2% lower offer ($414k) is reasonable based on typical stale-listing flexibility.
- 5 sale attempts since 20y ago with the ask held roughly flat each time — persistent listings suggest the price (not the market) is what's stuck; bring a comps-based counter.
Risks & watch-outs
- Climate carrying-cost: severe wind risk, 99% chance of damaging wind over 30y; extreme-heat days projected 7→29/yr by 2055 (HVAC capex compounding) — expect insurance premiums to compound above CPI over the hold.
Questions for the listing agent
- What do current leases actually rent for vs. the listed asking? Can we see a recent rent roll and the last 12 months of T-12 income?
- What does the HOA fee cover, when was the last increase, and are there any pending special assessments or reserve-fund shortfalls?
- Is there a deadline driving the sale (1031 exchange, divorce, estate, relocation)? That informs how much negotiation room exists.
- Schools are D-rated, which usually means shorter tenancies and higher turnover. Who's the typical renter profile here, and what's been the actual vacancy rate?
- The area grade is low — what's the realistic commute time and amenity access for the typical tenant pool here? Any planned neighborhood developments (good or bad) we should know about?
- What's the average days-on-market for RENTAL listings here right now (not sales)? A rising rental-DOM trend means longer vacancies and softer asking-rent achievability than the comps imply.
- What's the recent tenant-quality profile in this submarket — average credit score on applications, eviction rate, late-payment / NSF rate, and stable-employment percentage? A property-management company in the area should have these aggregated.
- How much new for-sale + rental construction is in the pipeline within 1–3 miles? Heavy new supply typically softens prices + rents 12–24 months out; constrained supply supports both.
Investment metrics
- 1% rule
- 0.83% ✗
- Cap rate
- 6.15%
- Cash-on-cash
- -0.52%
- DSCR
- 0.98
- GRM
- 10.1
CMA / ARV
- ARV (on-the-fly)
- $522,120
- Comps found
- 12
Show comp detail 12 sales within ~0.75 mi
| Address | Dist | Beds/Ba | Sqft | Sold | Price | $/sf | Match |
|---|---|---|---|---|---|---|---|
| 4630 61st Dr E | 0.05mi | 4/3.0 | 2,290 (0%) | 8mo | $440,000 | $192 | 91 |
| 6214 45th Ln E | 0.32mi | 4/3.0 | 2,401 (+5%) | 0mo | $505,000 | $210 | 76 |
| 5011 60th Dr E | 0.37mi | 4/2.5 | 2,288 (-0%) | 8mo | $536,000 | $234 | 74 |
| 4227 61st Ave E | 0.30mi | 3/2.5 (-1) | 2,009 (-12%) | 0mo | $449,000 | $223 | 58 |
| 6266 Mesa Gln | 0.54mi | 3/3.0 (-1) | 2,397 (+5%) | 5mo | $771,500 | $322 | 58 |
| 6255 Plateau Ct | 0.54mi | 3/3.0 (-1) | 2,397 (+5%) | 8mo | $685,000 | $286 | 56 |
| 4806 Lake Breeze Ter | 0.75mi | 4/3.0 | 2,222 (-3%) | 7mo | $560,000 | $252 | 55 |
| 6290 Mesa Gln | 0.58mi | 3/3.0 (-1) | 2,397 (+5%) | 7mo | $735,000 | $307 | 54 |
| 5513 47th Ct E | 0.43mi | 4/2.0 | 1,996 (-13%) | 1mo | $370,000 | $185 | 54 |
| 6005 Cedarwood Ln | 0.74mi | 4/2.0 | 2,212 (-3%) | 6mo | $400,000 | $181 | 51 |
| 3808 Maplewood Ter | 0.69mi | 4/2.0 | 2,180 (-5%) | 6mo | $440,000 | $202 | 51 |
| 4134 63rd Ter E | 0.65mi | 3/2.0 (-1) | 2,008 (-12%) | 8mo | $457,000 | $228 | 34 |
Match score weights: distance 35% · size 25% · config 20% · recency 20%. Top-matched comps best support the ARV.
Projected returns pro-forma
-3.0% appreciation · 0.0% rent growth · sell at horizon
- IRR
- -20.5%
- Equity multiple
- 0.31×
- Total profit
- $-81,511
- Equity at exit
- $62,608
- IRR
- -21.8%
- Equity multiple
- 0.03×
- Total profit
- $-114,598
- Equity at exit
- $36,305
Cash invested: $117,572 (down + closing). Projections, not guarantees.
Landlord ↔ Tenant lean methodology
- Overall (STATE)
- 87 Strongly Landlord-Friendly
- State Florida
- 87 Strongly Landlord-Friendly · R+3
- County
- — inherits STATE
- City
- — inherits STATE
ZIP-level market 34203
- Home prices YoY
- -24.5%
- Rents YoY
- -1.0%
- Active inventory
- 384
- Price-to-rent
- 10.1×
Monthly cashflow live
- Estimated rent
- $3,475 high interval (Pro) →
- Mortgage (P&I)
- −$2,202
- Tax from tax record
- −$262 /mo · $3,139/yr
- Insurance
- −$175
- HOA
- −$158
- Vacancy / Maint / Mgmt
- −$730
- Net cashflow
- $-51
Break-even live
UW: 25.0% down · 7.5% · 30yr · 1.5% tax · 5.0% vac · 8.0% maint · 8.0% mgmt
Financing live
Cash to close
- Down payment
- $104,975
- Closing costs
- $12,597
- Reserves months
- —
- Total cash needed
- —
Loan-product check · same deal, 3 products live
Conventional
25% down · 7.5% · 30yr
- Down + closing
- —
- Monthly P&I
- —
- Monthly cashflow
- —
- DSCR
- —
- Eligible?
- —
Personal DTI + credit; lowest rate.
DSCR
20% down · 8.5% · 30yr
- Down + closing
- —
- Monthly P&I
- —
- Monthly cashflow
- —
- DSCR
- —
- Eligible?
- —
No personal income docs; deal must DSCR.
Hard money
10% down · 12.0% · 12mo
- Down + closing
- —
- Monthly P&I
- —
- Monthly cashflow
- —
- DSCR
- —
- Eligible?
- —
Short-term bridge; refi at stabilization.
Rent comps 16 comps
| Address | Beds | Baths | Sqft | Rent | $/sqft | DOM | Units | Dist |
|---|---|---|---|---|---|---|---|---|
| 6188 46th St E Bradenton, FL | 4.0 | 3.0 | 2330 | $3,995 | $1.71 | 16d | 1 | 0.29mi |
| 5011 58th Ter E Bradenton, FL | 5.0 | 2.5 | 2516 | $3,400 | $1.35 | 10d | 1 | 0.35mi |
| 6222 45th Ln E Bradenton, FL | 3.0 | 2.0 | 2311 | $2,800 | $1.21 | 23d | 1 | 0.37mi |
| 4103 61st Ave E Bradenton, FL | 3.0 | 2.0 | 2287 | $2,750 | $1.20 | 23d | 1 | 0.45mi |
| 6289 Mesa Gln Bradenton, FL | 3.0 | 3.0 | 2406 | $4,750 | $1.97 | 10d | 1 | 0.62mi |
| 5419 Summit Gln Bradenton, FL | 3.0 | 3.5 | 1987 | $8,000 | $4.03 | 23d | 1 | 0.84mi |
| 5534 Spanish Moss Cv Bradenton, FL | 3.0 | 2.0 | 1716 | $2,500 | $1.46 | 14d | 1 | 0.85mi |
| 5534 Spanish Moss Cv Bradenton, FL | 3.0 | 2.0 | 1706 | $2,500 | $1.47 | 23d | 1 | 0.85mi |
| 5429 Spanish Moss Cv Bradenton, FL | 4.0 | 2.5 | 2046 | $2,600 | $1.27 | 14d | 1 | 0.88mi |
| 6141 36th Ln E Bradenton, FL | 4.0 | 3.0 | 1942 | $2,800 | $1.44 | 16d | 1 | 0.89mi |
| 3601 Garden Lakes Clenet Bradenton, FL | 3.0 | 2.0 | 1798 | $3,000 | $1.67 | 16d | 1 | 0.91mi |
| 4414 67th Avenue Cir E Sarasota, FL | 3.0 | 2.5 | 3048 | $4,995 | $1.64 | 3d | 1 | 1.08mi |
| 4414 67th Avenue Cir E Sarasota, FL | 3.0 | 2.5 | 3048 | $4,995 | $1.64 | 1d | 1 | 1.08mi |
| 6615 35th Ct E Sarasota, FL | 3.0 | 2.0 | 2065 | $3,250 | $1.57 | 23d | 1 | 1.29mi |
| 5631 29th St E Bradenton, FL | 3.0 | 2.0 | 1868 | $3,995 | $2.14 | 23d | 1 | 1.46mi |
| 5847 28th Ln E Bradenton, FL | 3.0 | 2.0 | 1900 | $2,700 | $1.42 | 23d | 1 | 1.48mi |
HOA detail
- Monthly dues
- $158 · $1,896/yr
- Likely covers
- security
Listing history 22 events
-
2026-06-18days on market $419,900 Active 22 DOM
-
2026-06-17days on market $419,900 Active 21 DOM
-
2026-06-16days on market $419,900 Active 20 DOM
-
2026-06-15days on market $419,900 Active 19 DOM
-
2026-06-13days on market $419,900 Active 17 DOM
-
2026-06-13days on market $419,900 Active 16 DOM
-
2026-06-10days on market $419,900 Active 14 DOM
-
2026-06-09days on market $419,900 Active 13 DOM
-
2026-06-08days on market $419,900 Active 12 DOM
-
2026-06-07days on market $419,900 Active 11 DOM
-
2026-06-03days on market $419,900 Active 7 DOM
-
2026-06-02days on market $419,900 Active 6 DOM
-
2026-06-01days on market $419,900 Active 5 DOM
-
2026-05-31days on market $419,900 Active 4 DOM
-
2026-05-27$419,900 Active
-
2006-10-03historical
-
2006-08-01soldstatus $425,000
-
2006-05-01$429,997
-
2006-05-01$449,997
-
2006-02-20$499,997
-
2006-02-20$469,997
-
2004-10-15soldstatus $1,190,000
ⓘ Source: listings_history table (triggers on properties + properties_extension) + one-shot
backfill from property_details.listing_events for pre-trigger history.
Tax reassessment forecast FL · Resets to sale price
- Current annual tax
- $3,139 · $262/mo
- Projected year-2 tax
- $3,485 · $290/mo
- Expected delta
- +$346/yr (+$29/mo · 11.0%)
ⓘ Screening estimate from a state-policy table — verify with the county assessor before closing.
Climate risk First Street
- Flood 1/10 Low FEMA zone X (unshaded) · 0% chance over 30 yrs
- Wildfire 1/10 Low
- Heat 10/10 Extreme 7 d/yr ≥107°F today · 29 d/yr by 30 yrs out
- Wind 10/10 Extreme 99% chance of damaging wind over 30 yrs
- Air quality 2/10 Low 1 unhealthy d/yr today · 1 by 30 yrs out
Nearby sold comps map
Loading sold comps map…
Walkable amenities ~0.75 mi
Loading nearby amenities…
Taxation est. · year 1
- Rental income
- $41,699
- − Mortgage interest
- −$23,521
- − Property taxes
- −$3,139
- − Insurance
- −$2,100
- − Repairs & maintenance
- −$3,336
- − Management
- −$3,336
- − HOA
- −$1,896
- − Depreciation
- −$12,215
- Taxable loss
- −$7,844
- Est. tax savings @ 24.0%
- +$1,883
- After-tax cash flow
- $1,266/yr
For passive investors: Depreciation is non-cash, so a rental often shows a tax loss while cash-flowing — sheltering income. Rental losses are passive: they offset passive income freely, and up to $25,000/yr can offset ordinary (W-2) income if you actively participate and your MAGI is under $100k (phasing out to $0 by $150k); unused losses carry forward. On sale, claimed depreciation is recaptured at up to 25%, and gains may owe capital-gains tax (a 1031 exchange can defer both). Figures are a year-1 estimate at your 24.0% rate — not tax advice; consult a CPA.
Schools (NCES district)
- District
- Manatee
- NCES district ID
- 1201230
- Math proficiency
- 54% ▼ -6.00%
- Reading proficiency
- 50% ▼ -2.00%
- Median HH income
- $49,607
- Composite
- 44.43/100
- National rank
- #2806
- State rank
- #26 of 73 in FL
Livability — Samoset
- Score
- 65/100
- State rank
- #645
- US rank
- #12763
Category grades
Schools grade is shown separately in the Schools card above.
Census & demographics
- County
- Manatee County · 416,364 people
- Metro
- North Port-Sarasota-Bradenton, FL
- Population (ZIP)
- 40,618
- Household income
- $70,761
- Rent vs Own
- Severe rent burden
- 1469.0
Population outlook (Manatee County) Hauer SSP2
- Today (2025)
- 447,342 people
- By 2030
- 488,911 · +9.3%
- By 2040
- 567,934 · +27.0%
- By 2050
- 637,995 · +42.6%
- By 2075
- 781,970 · +74.8%
- By 2100
- 848,272 · +89.6%
Race, ethnicity, and origin ACS 2023
- Neighborhood character
- Predominantly White (65%)
- Race & ethnicity
- White 65% Hispanic / Latino 19% Two or more races 12% Black 9% Asian 5%
- Hispanic origin (detail)
- Mexican 9% Puerto Rican 3% Cuban 2% Dominican 1%
- Common ancestry
- Lithuanian 3% Romanian 3% Slovak 2%
- Foreign-born
- 17% · Canada, Vietnam, Dominican Republic
- Languages at home
- 76% English-only · Spanish 16% Vietnamese 2% Other Indo-European 1%
Political lean MEDSL · Manatee
- 2024 margin
- Strong R (+23.5) · D 37.9% · R 61.4%
- 2008→2024 swing
- -16.5pp toward R · 2008: -7.0pp · 2024: -23.5pp
- All cycles
- 2024: R+23.5 2020: R+16.1 2016: R+17.1 2012: R+12.5 2008: R+7.0
Not yet ingested
- Civics
- —
Market trends
- HPI YoY
- ▼ -95.87%
- Current HPI
- 295.8871
- Rent YoY
- ▼ -0.97%
- Metro
- North Port-Sarasota-Bradenton, FL
- State GDP YoY
- ▲ 3.28%
- F500 in state
- 36
Industry mix (Fortune 500 HQ in FL)
| Industry | F500 HQs | Revenue |
|---|---|---|
| Industrial Technology | 2 | $29B |
|
||
| Insurance | 2 | $17B |
|
||
| Retail | 1 | $60B |
|
||
| Technology Distribution | 1 | $58B |
|
||
| Homebuilding | 1 | $35B |
|
||
| Technology Manufacturing | 1 | $35B |
|
||
Price history
-64.7% since first listed8 events — show timeline
- 2026-05-27 Listed $419,900 Stellar MLS as Distributed by MLS Grid
- 2006-10-03 Listing Removed — Stellar MLS as Distributed by MLS Grid
- 2006-08-01 Sold (Public Records) $425,000 Public Records
- 2006-05-01 Listed $449,997 Stellar MLS as Distributed by MLS Grid
- 2006-05-01 Listed $429,997 Stellar MLS as Distributed by MLS Grid
- 2006-02-20 Listed $469,997 Stellar MLS as Distributed by MLS Grid
- 2006-02-20 Listed $499,997 Stellar MLS as Distributed by MLS Grid
- 2004-10-15 Sold (Public Records) $1,190,000 Public Records
Property tax history
+1.8%/yrLatest (2024): $3,139 · +2.0% YoY. Source: county tax records.
Cash-flow waterfall
monthlySold comps — $/sqft
last 12 mo · ≤1 miLoading sold comps…