SL 10 Stillman Ln · Willoughby, OH
Flood risk 1/10 · Minimal
- FEMA flood zone
- X (unshaded)
- Chance of flooding over 30 yrs
- 0.0%
- Est. flood insurance / yr
- $507 – $1,088
Fire risk 1/10 · Minimal
- Est. fire insurance / yr
- $713 – $1,323
Heat risk 3/10 · Minor
- Hot days now (above 95°F)
- 7 days/yr
- Hot days in 30 yrs
- 17 days/yr
Wind risk 1/10 · Minimal
- Chance of severe wind over 30 yrs
- —
Air-quality risk 4/10 · Minor
- Unhealthy air days now
- 3 days/yr
- Unhealthy air days in 30 yrs
- 5 days/yr
Risk factors via First Street. Map © Google.
Why this score? — see what drove the F grade
The composite is a weighted blend of 9 inputs, each scored 0–100. Each bar is that input's sub-score; the figure is the points it added to the 100-point composite (weight × sub-score).
- ARV discount +7.5/15.0
- Cash flow +5.5/30.0
- Schools +4.3/10.0
- Livability +3.8/5.0
- 1% rule +3.6/10.0
- Rent growth +3.5/5.0
- Condition / age +1.0/5.0
- DSCR +0.0/10.0
- Appreciation +0.0/10.0
$160,000
🖨 Deal sheet 📄 Offer letter ✓ Due diligence
Listing remarks MLS
Why settle… when you can design everything? Exceptional opportunity to build your custom home on this over half-acre flat lot located just minutes from the lake and historic Downtown Willoughby. Enjoy convenient access to boating, dining, shopping, and major freeways. Public water, public sewer, and utilities are available at the street. Mature trees along the rear of the property provide added privacy. Surrounded by newer construction homes, this property offers both lifestyle appeal and long-term value without an HOA fee! Reach out today for more information!
Key facts
- Low hoa fees
- Generous lot sizes
- 9,583 sq ft lot
Tags
Neighborhood map
What this means for you Summary
Snapshot
- This is a single-family listed at $160k. Condition is rated poor.
Deal economics
- At list price, monthly cash flow is $-339 ($-4k/yr) — negative.
- To cash-flow at today's rent, offer at most $111k (30.7% below list).
- To meet the 1% rule (rent ≥ 1% of price), the offer needs to be $137k (14.3% below list).
- Recommended offer: $111k (30.7% below list) — sets the bar for cash-flow.
- Cap rate 3.7% vs local median 2.8% in Willoughby — top-decile yield for the area; either an underpriced asset or a hidden risk that comps aren't pricing in. Stress-test before assuming the spread holds.
Location & tenants
- Location reads 75/100 on livability (#249 in OH, #3,972 nationally) — a middle-class / working-renter tenant base. Strengths: crime A+, cost of living A+, housing A+; Watch: health & safety D, amenities F, commute F.
- Willoughby-Eastlake City (suburban): math 42% / reading 58% proficiency, ranked #434 of 656 in OH (top 66%) — acceptable for families but not a draw, mixed tenant base, ~2y average lease.
- Market conditions: Rents rising fast (+4.0%/yr); 187 active listings in the ZIP; 14 comparable units currently listed for rent nearby; rentals at typical pace (median 16d on market — plan ~3-4 weeks tenant-placement turnaround); solid renter incomes; 448 units permitted in Lake County in 2024 (0 in 5+ unit buildings).
Forward outlook
- Local home prices are declining (-3.0%/yr); year-one equity from $1k of loan paydown is wiped out by about $5k of value loss. Plan a longer hold.
- Lake County population projected to shrink 8% by 2050 — rents likely to lag national; underwrite the cash flow, not the appreciation.
Negotiation context
- It's been on market 156 days — a 12% lower offer ($141k) is reasonable based on typical stale-listing flexibility.
- 13 sale attempts since 35y ago; this cycle's ask is 220% above the opening price — seller raised mid-cycle; expect resistance to lowballs.
- Current owner paid $65k; list at $160k implies a 146% gain — meaningful room to come down on a strong offer.
Risks & watch-outs
- Watch-outs: HOA is 23% of rent.
Questions for the listing agent
- What do current leases actually rent for vs. the listed asking? Can we see a recent rent roll and the last 12 months of T-12 income?
- It's been on market 156 days. Have you received any prior offers? Is the seller open to a 31% concession, seller financing, or rate buy-down credit?
- Have any recent inspections been done? Can we get a copy of the seller's disclosures and any deferred-maintenance estimates?
- What does the HOA fee cover, when was the last increase, and are there any pending special assessments or reserve-fund shortfalls?
- Why hasn't it sold? Are there any deal-killer items the seller is aware of (foundation, flood, title, zoning, code violations)?
- Is there a deadline driving the sale (1031 exchange, divorce, estate, relocation)? That informs how much negotiation room exists.
- Schools are B-rated — typically a magnet for longer-tenancy family renters. What's the average tenant stay here, and is there a school-zone premium baked into asking?
- The area grade is low — what's the realistic commute time and amenity access for the typical tenant pool here? Any planned neighborhood developments (good or bad) we should know about?
- What's the average days-on-market for RENTAL listings here right now (not sales)? A rising rental-DOM trend means longer vacancies and softer asking-rent achievability than the comps imply.
- What's the recent tenant-quality profile in this submarket — average credit score on applications, eviction rate, late-payment / NSF rate, and stable-employment percentage? A property-management company in the area should have these aggregated.
- How much new for-sale + rental construction is in the pipeline within 1–3 miles? Heavy new supply typically softens prices + rents 12–24 months out; constrained supply supports both.
Investment metrics
- 1% rule
- 0.86% ✗
- Cap rate
- 3.75%
- Cash-on-cash
- -9.08%
- DSCR
- 0.60
- GRM
- 9.7
CMA / ARV
No comps found within radius.
Show comp detail 12 sales within ~0.75 mi
| Address | Dist | Beds/Ba | Sqft | Sold | Price | $/sf | Match |
|---|---|---|---|---|---|---|---|
| 1522 Mapledale Rd | 0.53mi | 3/2.0 | 1,080 | 2mo | $160,000 | $148 | 61 |
| 5307 Karen Isle Dr | 0.57mi | 3/2.0 | 2,066 | 0mo | $360,000 | $174 | 61 |
| 1798 E 337th St | 0.60mi | 3/1.0 | 1,800 | 1mo | $61,555 | $34 | 59 |
| 35338 Bald Eagle Ln | 0.58mi | 3/2.5 | 2,402 | 2mo | $520,000 | $216 | 59 |
| 1588 Mapledale Rd | 0.61mi | 3/1.5 | 1,400 | 0mo | $197,500 | $141 | 59 |
| 5109 Melody Ln | 0.63mi | 3/2.0 | — | 2mo | $190,000 | — | 57 |
| 5406 Karen Isle Dr | 0.64mi | 3/2.0 | 1,278 | 2mo | $295,000 | $231 | 56 |
| 1677 Douglas Rd | 0.66mi | 4/2.0 | 1,270 | 2mo | $210,000 | $165 | 55 |
| 5430 Oak Ridge Dr | 0.69mi | 4/2.0 | 1,628 | 2mo | $306,000 | $188 | 54 |
| 5229 Melody Ln | 0.68mi | 3/1.5 | 930 | 2mo | $230,000 | $247 | 54 |
| 5459 Oak Ridge Dr | 0.73mi | 5/3.5 | 2,150 | 1mo | $367,000 | $171 | 53 |
| 1604 Empire Rd | 0.74mi | 3/1.0 | 1,006 | 2mo | $190,000 | $189 | 52 |
Match score weights: distance 35% · size 25% · config 20% · recency 20%. Top-matched comps best support the ARV.
Projected returns pro-forma
-3.0% appreciation · 4.01% rent growth · sell at horizon
- IRR
- -30.7%
- Equity multiple
- -0.02×
- Total profit
- $-45,902
- Equity at exit
- $23,857
- IRR
- -26.8%
- Equity multiple
- -0.36×
- Total profit
- $-61,015
- Equity at exit
- $13,834
Cash invested: $44,800 (down + closing). Projections, not guarantees.
Landlord ↔ Tenant lean methodology
- Overall (STATE)
- 73 Landlord-Friendly
- State Ohio
- 73 Landlord-Friendly · R+6
- County
- — inherits STATE
- City
- — inherits STATE
ZIP-level market 44094
- Rents YoY
- 4.0%
- Active inventory
- 187
- Price-to-rent
- 9.7×
Monthly cashflow live
- Estimated rent
- $1,370 high interval (Pro) →
- Mortgage (P&I)
- −$839
- Tax est. 1.5%
- −$200 /mo · $2,400/yr
- Insurance
- −$67
- HOA
- −$316
- Vacancy / Maint / Mgmt
- −$288
- Net cashflow
- $-339
Break-even live
UW: 25.0% down · 7.5% · 30yr · 1.5% tax · 5.0% vac · 8.0% maint · 8.0% mgmt
Financing live
Cash to close
- Down payment
- $40,000
- Closing costs
- $4,800
- Reserves months
- —
- Total cash needed
- —
Loan-product check · same deal, 3 products live
Conventional
25% down · 7.5% · 30yr
- Down + closing
- —
- Monthly P&I
- —
- Monthly cashflow
- —
- DSCR
- —
- Eligible?
- —
Personal DTI + credit; lowest rate.
DSCR
20% down · 8.5% · 30yr
- Down + closing
- —
- Monthly P&I
- —
- Monthly cashflow
- —
- DSCR
- —
- Eligible?
- —
No personal income docs; deal must DSCR.
Hard money
10% down · 12.0% · 12mo
- Down + closing
- —
- Monthly P&I
- —
- Monthly cashflow
- —
- DSCR
- —
- Eligible?
- —
Short-term bridge; refi at stabilization.
Rent comps 14 comps
| Address | Beds | Baths | Sqft | Rent | $/sqft | DOM | Units | Dist |
|---|---|---|---|---|---|---|---|---|
| 35124 Euclid Ave Willoughby, OH | 1.0 | 1.0 | 673 | $1,162 | $1.73 | 1d | 2 | 0.26mi |
| 30620 Euclid Ave Wickliffe, OH | 2.0 | 1.0 | 1500 | $1,500 | $1.00 | 3d | 1 | 0.55mi |
| 30600 Euclid Ave Wickliffe, OH | 1.0 | 1.0 | 750 | $948 | $1.26 | 16d | 1 | 0.61mi |
| 32002 N Marginal Dr Willowick, OH | 2.0 | 1.5 | — | $1,095 | — | 43d | 1 | 0.70mi |
| 1902 Harding Dr Wickliffe, OH | 3.0 | 2.0 | 2376 | $2,300 | $0.97 | 43d | 1 | 0.78mi |
| 31621 N Marginal Dr Unit B Willowick, OH | 3.0 | 1.5 | 1200 | $1,550 | $1.29 | 3d | 1 | 0.82mi |
| 30446 Euclid Ave Wickliffe, OH | 2.0 | 1.5 | 1044 | $1,350 | $1.29 | 43d | 1 | 0.85mi |
| 762 E 305th St Willowick, OH | 3.0 | 1.0 | 2436 | $2,000 | $0.82 | 1d | 1 | 1.13mi |
| 1592 Ridgewick Dr Wickliffe, OH | 2.0 | 1.0 | — | $1,200 | — | 43d | 1 | 1.21mi |
| 30050 Euclid Ave Unit A2 Wickliffe, OH | 2.0 | 1.0 | 1036 | $1,350 | $1.30 | 43d | 1 | 1.28mi |
| 2250 Par Ln Willoughby Hills, OH | 2.0–3.0 | 2.0–2.5 | 1375 | $1,840 | $1.34 | 1d | 15 | 1.44mi |
| 33201 Vine St Willowick, OH | 1.0–2.0 | 1.0 | 621 | $1,200 | $1.93 | 20d | 1 | 1.45mi |
| 2252 Par Ln Willoughby Hills, OH | 1.0–3.0 | 1.0–2.0 | 1046 | $1,330 | $1.27 | 1d | 36 | 1.47mi |
| 1323 E 360th St Eastlake, OH | 3.0 | 1.0 | 1036 | $1,599 | $1.54 | 16d | 1 | 1.49mi |
HOA detail
- Monthly dues
- $316 · $3,792/yr
- Likely covers
- watersewer
Listing history 39 events
-
2026-06-18days on market $160,000 Active 156 DOM
-
2026-06-17days on market $160,000 Active 155 DOM
-
2026-06-16days on market $160,000 Active 154 DOM
-
2026-06-15days on market $160,000 Active 153 DOM
-
2026-06-13days on market $160,000 Active 151 DOM
-
2026-06-13days on market $160,000 Active 150 DOM
-
2026-06-09days on market $160,000 Active 147 DOM
-
2026-06-08days on market $160,000 Active 146 DOM
-
2026-06-07days on market $160,000 Active 145 DOM
-
2026-06-03days on market $160,000 Active 141 DOM
-
2026-06-02days on market $160,000 Active 140 DOM
-
2026-06-01days on market $160,000 Active 139 DOM
-
2026-05-31days on market $160,000 Active 138 DOM
-
2026-05-26$50,000 Active
-
2026-04-27soldstatus $65,000 Closed 574-char remark
Show marketing remark (574 chars)
Why settle… when you can design everything? Exceptional opportunity to build your custom home on this over half-acre flat lot located just minutes from the lake and historic Downtown Willoughby. Enjoy convenient access to boating, dining, shopping, and major freeways. Public water, public sewer, and utilities are available at the street. Mature trees along the rear of the property provide added privacy. Surrounded by newer construction homes, this property offers both lifestyle appeal and long-term value without an HOA fee! Reach out today for more information!
-
2026-04-16status Pending 574-char remark
Show marketing remark (574 chars)
Why settle… when you can design everything? Exceptional opportunity to build your custom home on this over half-acre flat lot located just minutes from the lake and historic Downtown Willoughby. Enjoy convenient access to boating, dining, shopping, and major freeways. Public water, public sewer, and utilities are available at the street. Mature trees along the rear of the property provide added privacy. Surrounded by newer construction homes, this property offers both lifestyle appeal and long-term value without an HOA fee! Reach out today for more information!
-
2026-02-18$75,000 Active 574-char remark
Show marketing remark (574 chars)
Why settle… when you can design everything? Exceptional opportunity to build your custom home on this over half-acre flat lot located just minutes from the lake and historic Downtown Willoughby. Enjoy convenient access to boating, dining, shopping, and major freeways. Public water, public sewer, and utilities are available at the street. Mature trees along the rear of the property provide added privacy. Surrounded by newer construction homes, this property offers both lifestyle appeal and long-term value without an HOA fee! Reach out today for more information!
-
2026-01-12$160,000 Active 346-char remark
Show marketing remark (346 chars)
Kirtland Tudor Estates - Timeless English Tudor design, directly across from the renowned Kirtland Country Club and residing in the highly acclaimed Kirtland School District. The "Villages" within Kirtland Tudor Estates offers generous lot sizes and low HOA fees covering main entrance and grounds maintenance. Other lots are available.
-
2009-10-01soldstatus $30,000
-
2009-08-20$34,900
-
1999-06-28historical
-
1999-04-28$45,000
-
1997-03-07soldstatus $37,000
-
1996-12-17$39,900
-
1996-05-27historical
-
1996-02-27$39,975
-
1995-08-30historical
-
1995-05-19$39,900
-
1994-08-27historical
-
1994-05-27$43,000
-
1993-12-01soldstatus $37,000
-
1993-09-01$40,000
-
1993-07-19historical
-
1993-01-19$35,000
-
1992-07-08soldstatus $32,000
-
1992-06-20historical
-
1992-04-20$34,900
-
1992-04-06historical
-
1991-10-06$34,900
ⓘ Source: listings_history table (triggers on properties + properties_extension) + one-shot
backfill from property_details.listing_events for pre-trigger history.
Climate risk First Street
- Flood 1/10 Low FEMA zone X (unshaded) · 0% chance over 30 yrs
- Wildfire 1/10 Low
- Heat 3/10 Moderate 7 d/yr ≥95°F today · 17 d/yr by 30 yrs out
- Wind 1/10 Low
- Air quality 4/10 Moderate 3 unhealthy d/yr today · 5 by 30 yrs out
Nearby sold comps map
Loading sold comps map…
Walkable amenities ~0.75 mi
Loading nearby amenities…
Taxation est. · year 1
- Rental income
- $16,445
- − Mortgage interest
- −$8,962
- − Property taxes
- −$2,400
- − Insurance
- −$800
- − Repairs & maintenance
- −$1,316
- − Management
- −$1,316
- − HOA
- −$3,792
- − Depreciation
- −$4,655
- Taxable loss
- −$6,795
- Est. tax savings @ 24.0%
- +$1,631
- After-tax cash flow
- $-2,438/yr
For passive investors: Depreciation is non-cash, so a rental often shows a tax loss while cash-flowing — sheltering income. Rental losses are passive: they offset passive income freely, and up to $25,000/yr can offset ordinary (W-2) income if you actively participate and your MAGI is under $100k (phasing out to $0 by $150k); unused losses carry forward. On sale, claimed depreciation is recaptured at up to 25%, and gains may owe capital-gains tax (a 1031 exchange can defer both). Figures are a year-1 estimate at your 24.0% rate — not tax advice; consult a CPA.
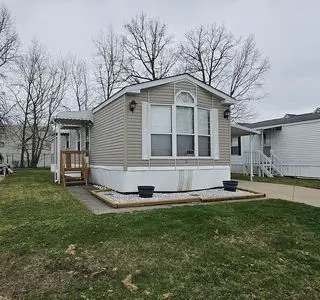
Condition & rehab AI · 1 photo
This mobile home requires extensive repairs and renovations to improve its condition and increase its resale and rental value.
Repairs flagged
- Major siding — The siding is visibly damaged and needs replacement.
- Major roof — The roof appears old and possibly leaking, requiring replacement.
- Major front porch — The front porch is in disrepair, with missing or damaged boards, requiring full replacement or repair.
- Major flooring — The flooring is likely in poor condition and needs replacement or repair.
- Major HVAC/mechanicals — The HVAC and mechanical systems are likely in poor condition and need replacement or repair.
- Major landscaping — The landscaping is minimal and needs significant improvement to enhance curb appeal and attract potential buyers/tenants.
Value-add opportunities
- Both extensive exterior renovation — A complete exterior renovation would significantly improve the home's appearance and curb appeal, attracting both buyers and renters.
- Both HVAC and mechanical system replacement — Replacing the HVAC and mechanical systems would improve the home's comfort and energy efficiency, making it more attractive to buyers and renters.
- Both landscaping and curb appeal improvements — Enhancing the landscaping and curb appeal would make the home more attractive and increase its resale and rental value.
- Both interior updates — Updating the interior, including flooring and paint, would improve the home's overall condition and make it more attractive to buyers and renters.
- Both roof replacement — Replacing the roof would address a major issue and improve the home's overall condition, making it more attractive to buyers and renters.
Renovation cost estimate screening
| Repair item | Severity | Est. cost |
|---|---|---|
| siding · The siding is visibly damaged and needs replacement. | Major | $15,000–50,000 |
| roof · The roof appears old and possibly leaking, requiring replacement. | Major | $15,000–50,000 |
| front porch · The front porch is in disrepair, with missing or damaged boards, requiring full replacement or repair. | Major | $15,000–50,000 |
| flooring · The flooring is likely in poor condition and needs replacement or repair. | Major | $15,000–50,000 |
| HVAC/mechanicals · The HVAC and mechanical systems are likely in poor condition and need replacement or repair. | Major | $15,000–50,000 |
| landscaping · The landscaping is minimal and needs significant improvement to enhance curb appeal and attract potential buyers/tenants. | Major | $15,000–50,000 |
| Total estimated repair cost · 6 items | $90,000–300,000 |
Value-add ROI direction
- Both extensive exterior renovation — A complete exterior renovation would significantly improve the home's appearance and curb appeal, attracting both buyers and renters. ↑
- Both HVAC and mechanical system replacement — Replacing the HVAC and mechanical systems would improve the home's comfort and energy efficiency, making it more attractive to buyers and renters. ↑
- Both landscaping and curb appeal improvements — Enhancing the landscaping and curb appeal would make the home more attractive and increase its resale and rental value. ↑
- Both interior updates — Updating the interior, including flooring and paint, would improve the home's overall condition and make it more attractive to buyers and renters. ↑
- Both roof replacement — Replacing the roof would address a major issue and improve the home's overall condition, making it more attractive to buyers and renters. ↑
ⓘ Cost ranges are severity-bucket heuristics (US national rule-of-thumb). Get contractor quotes + a written scope before underwriting a rehab budget.
Schools (NCES district)
- District
- Willoughby-Eastlake City
- NCES district ID
- 3904510
- Math proficiency
- 42% ▼ -21.00%
- Reading proficiency
- 58% ▼ -11.00%
- Median HH income
- $52,500
- Composite
- 42.96/100
- National rank
- #3110
- State rank
- #434 of 656 in OH
Livability — Willoughby
- Score
- 75/100
- State rank
- #249
- US rank
- #3972
Category grades
Schools grade is shown separately in the Schools card above.
Census & demographics
- Census place
- Willoughby, OH
- County
- Lake County · 204,927 people
- City population
- 36,873
- Metro
- Cleveland-Elyria, OH
- Population (ZIP)
- 36,873
- Household income
- $78,772
- Rent vs Own
- Severe rent burden
- 1381.0
Population outlook (Lake County) Hauer SSP2
- Today (2025)
- 230,022 people
- By 2030
- 228,151 · -0.8%
- By 2040
- 221,018 · -3.9%
- By 2050
- 212,754 · -7.5%
- By 2075
- 200,309 · -12.9%
- By 2100
- 183,315 · -20.3%
Race, ethnicity, and origin ACS 2023
- Neighborhood character
- Predominantly White (86%)
- Race & ethnicity
- White 86% Black 7% Two or more races 4% Hispanic / Latino 2% Asian 2%
- Common ancestry
- Romanian 7% Lithuanian 2% Slovak 2%
- Foreign-born
- 7% · Canada, China
- Languages at home
- 92% English-only · Russian/Polish/Slavic 3% Other Indo-European 1% German/W. Germanic 1%
Political lean MEDSL · Lake
- 2024 margin
- R (+14.3) · D 42.4% · R 56.7%
- 2008→2024 swing
- -15.2pp toward R · 2008: 0.8pp · 2024: -14.3pp
- All cycles
- 2024: R+14.3 2020: R+13.6 2016: R+15.6 2012: R+1.7 2008: D+0.8
Not yet ingested
- Civics
- —
Market trends
- HPI YoY
- ▼ -229.28%
- Current HPI
- 179.81
- Rent YoY
- ▲ 4.01%
- Metro
- Cleveland-Elyria, OH
- State GDP YoY
- ▲ 1.98%
- F500 in state
- 48
Industry mix (Fortune 500 HQ in OH)
| Industry | F500 HQs | Revenue |
|---|---|---|
| Insurance | 3 | $145B |
|
||
| Industrial Machinery | 3 | $49B |
|
||
| Financial Services | 3 | $24B |
|
||
| Consumer Goods | 2 | $93B |
|
||
| Aerospace / Defense | 2 | $47B |
|
||
| Utilities | 2 | $33B |
|
||
Price history
+43.3% since first listed26 events — show timeline
- 2026-05-26 Listed $50,000 FSBO.com
- 2026-04-27 Sold (MLS) $65,000 MLSNOW
- 2026-04-16 Pending — MLSNOW
- 2026-02-18 Listed $75,000 MLSNOW
- 2026-01-12 Listed $160,000 MLSNOW
- 2009-10-01 Sold (MLS) $30,000 MLSNOW
- 2009-08-20 Listed $34,900 MLSNOW
- 1999-06-28 Listing Removed — MLSNOW
- 1999-04-28 Listed $45,000 MLSNOW
- 1997-03-07 Sold (MLS) $37,000 MLSNOW
- 1996-12-17 Listed $39,900 MLSNOW
- 1996-05-27 Listing Removed — MLSNOW
- 1996-02-27 Listed $39,975 MLSNOW
- 1995-08-30 Listing Removed — MLSNOW
- 1995-05-19 Listed $39,900 MLSNOW
- 1994-08-27 Listing Removed — MLSNOW
- 1994-05-27 Listed $43,000 MLSNOW
- 1993-12-01 Sold (MLS) $37,000 MLSNOW
- 1993-09-01 Listed $40,000 MLSNOW
- 1993-07-19 Listing Removed — MLSNOW
- 1993-01-19 Listed $35,000 MLSNOW
- 1992-07-08 Sold (MLS) $32,000 MLSNOW
- 1992-06-20 Listing Removed — MLSNOW
- 1992-04-20 Listed $34,900 MLSNOW
- 1992-04-06 Listing Removed — MLSNOW
- 1991-10-06 Listed $34,900 MLSNOW
Cash-flow waterfall
monthlySold comps — $/sqft
last 12 mo · ≤1 miLoading sold comps…